Archive for November, 2016
At least 90 people were killed and more than 150 injured when an Indian express train derailed in northern Uttar Pradesh on Sunday.
Sunday, November 20th, 2016
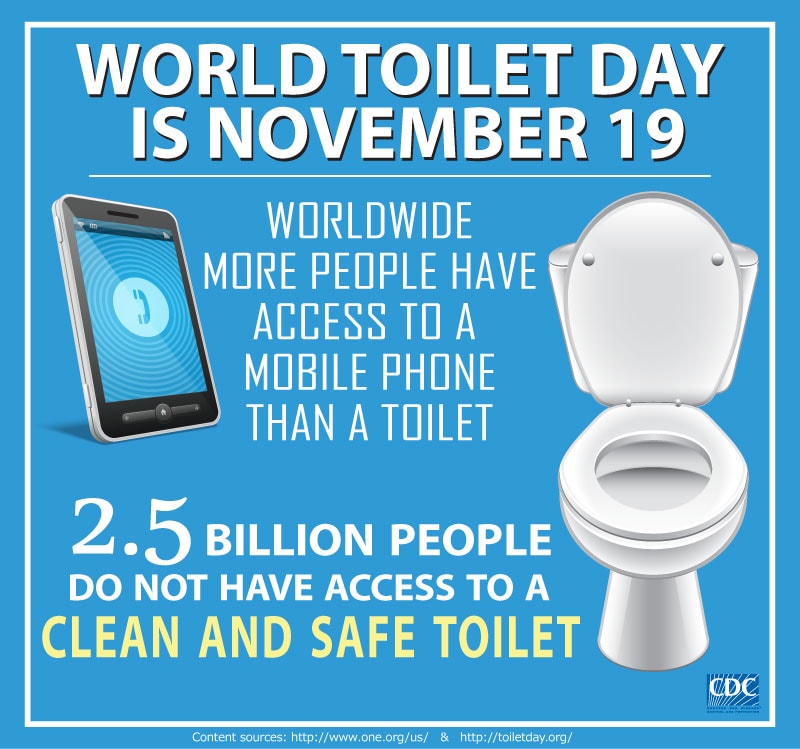
November 19 is World Toilet Day.
Saturday, November 19th, 2016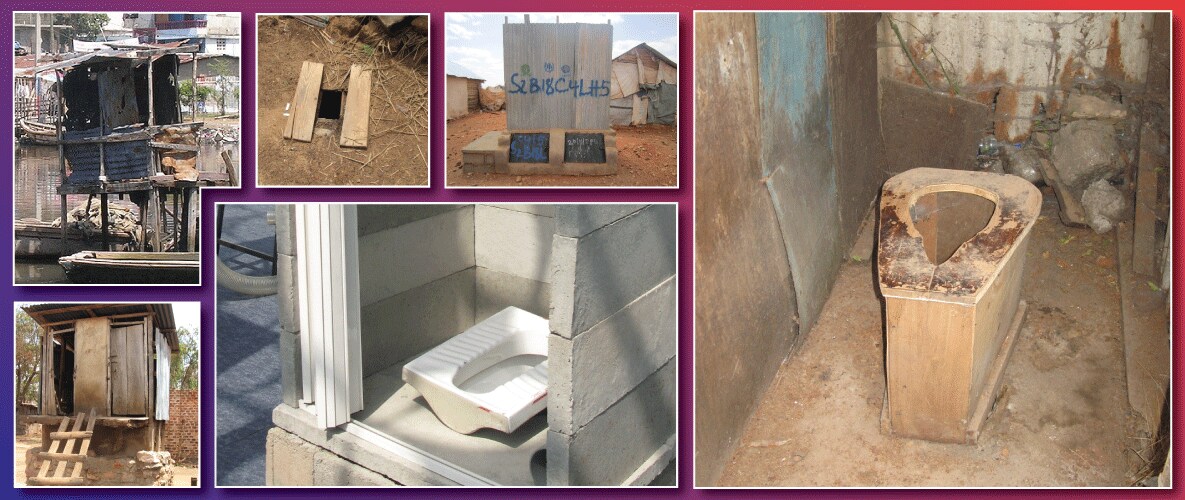
- Open defecation, where people have no choice but to go outside, contributes to fecal contamination of the environment which is one of the main causes of diarrhea, which results in the deaths of more than 800,000 children under age 5 every year.
- 80% of diseases in developing countries are caused by unsafe water and poor sanitation, which includes inadequate facilities.
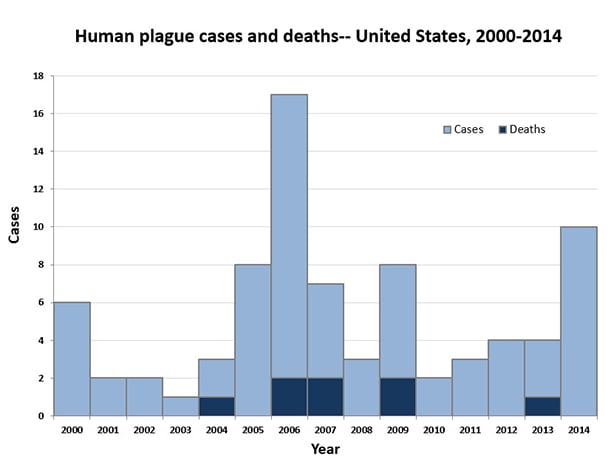
In August 2015, plague was diagnosed for 2 persons (septicemic and bubonic) who had visited Yosemite National Park in California, USA.
Saturday, November 19th, 2016

A person wearing a hat, a mask suggestive of a bird beak, goggles or glasses, and a long gown. The clothing identifies the person as a “plague doctor” and is intended as protection. Descriptions indicate that the gown was made from heavy fabric or leather and was usually waxed. The beak contained pungent substances like herbs or perfumes, thought at the time to purify the air and helpful in relieving the stench. The person also carries a pointer or rod to keep patients at a distance. (Library of Medicine)
Prevalence of electrolyte and metabolic abnormalities in Ebola patients
Saturday, November 19th, 2016Emerging Infectious Disease Journal
- Abnormalities were common among patients, particularly hypokalemia, hypocalcemia, hyponatremia, raised creatinine, high anion gap, and anemia.
- Besides age and PCR cycle threshold value, renal dysfunction, low calcium levels, and low hemoglobin levels were independently associated with increased risk for death.
Mozambique: At least 73 died and 110 were injured when a fuel tanker exploded in Tet province
Friday, November 18th, 2016Un plat de poisson servi avec de la mayonnaise
Friday, November 18th, 2016Food poisoning among French prisoners
- A dish of fish served with mayonnaise could be the cause
- Affected about 100 detainees out of approximately 260

11/17/1421: A storm in the North Sea batters the European coastline. Over the next several days, approximately 10,000 people in what is now the Netherlands died in the resulting floods.
Thursday, November 17th, 2016Hospital fires (2012-2014)
Thursday, November 17th, 2016Data snapshot: Hospital fires (2012-2014)
Loss measures for hospitals and all other medical facility fires (three-year average, 2012-2014)
The average number of fatalities per 1,000 hospital fires was lower than the same measure for all other medical facility fires. In addition, the number of injuries was also lower than that of other medical facilities. 2
| Loss measure | Hospital fires | All other medical facility fires |
|---|---|---|
| Loss measure
Fatalities/1,000 fires
|
Hospital fires0.4 | All other medical facility fires0.6 |
| Loss measure
Injuries/1,000 fires
|
Hospital fires17.3 | All other medical facility fires19.6 |
| Loss measure
Dollar loss/fire
|
Hospital fires$6,030 | All other medical facility fires$11,290 |
Hospital fires by incident type (2012-2014)
The majority of hospital fires were fires that were confined to cooking pots (60 percent). Confined fires are smaller fires that rarely result in death, serious injury or large content losses. 3 Fires in trash bins, incinerators or compactors composed 10 percent of hospital fires, while 3 percent were fuel burner or chimney fires.
Nonconfined fires, generally larger structure fires, made up 27 percent of hospital fires. Source: NFIRS 5.0.
Leading confined fire types
- Cooking vessel: 60.4%
- Trash, incinerator or compactor: 9.8%
- Fuel burner or chimney: 2.9%
Hospital fires by time of alarm (2012-2014)
Hospital fires occurred most frequently from 8 a.m. to 6 p.m., accounting for 60 percent of the fires. The fires peaked between the hour of noon and 1 p.m. This period of high fire incidence coincides with lunchtime meal preparations, as cooking is the leading cause of hospital fires. Source: NFIRS 5.0.
Causes of hospital fires (2012-2014)
The leading causes of all hospital fires were:
- Cooking (68 percent)
- Electrical malfunction (6 percent)
- Heating (5 percent)
Source: NFIRS 5.0.
Note: Percentages are adjusted for those fires with unknown values of cause. Ten percent of hospital fires had unknown values of cause.
While cooking was the leading reported cause of hospital fires overall, it only accounted for 6 percent of all nonconfined hospital fires. Nonconfined fires are larger, more serious fires.
The leading causes of nonconfined hospital fires were:
- Electrical malfunction (22 percent)
- Appliances (13 percent)
- Intentional actions (12 percent)
- Other equipment (11 percent)
Extent of fire spread in hospital fires (2012-2014)
Eighty-four percent of all hospital fires were limited to the object of origin. Only 3 percent extended beyond the room of origin. Source: NFIRS 5.0.
Limited to room of origin 13.1%
Limited to floor of origin 1.7%
Limited to building of origin 1.4%
Beyond building of origin 0.0%
83.7% Limited to object of origin
13.1% Limited to room of origin
1.7% Limited to floor of origin
1.4% Limited to building of origin
0.0% Beyond building of origin
Note: Total percentages do not add up to 100 percent due to rounding.
For more information on hospitals, including patient experience and quality of care data, please visit: Medicare.gov.
Sources: NFIRS 5.0 and the National Fire Protection Association.
Notes:
- Medical facilities are defined by Property Use codes 311 to 343. Hospitals are defined by Property Use code 331. Fires are defined as a subset of nonresidential building fires in NFIRS by using Incident Types 111 to 123 (excluding Incident Type 112). For Incident Types 113 to 118, the Structure Type is 1, 2 or null, and for Incident Types 111 and 120 to 123, the Structure Type is 1 or 2. Aid Types 3 (mutual aid given) and 4 (automatic aid given) were excluded to avoid double counting of incidents. Estimates of fires are rounded to the nearest 100, deaths to the nearest five, injuries to the nearest 25, and dollar loss to the nearest million dollars.
- The average loss measures computed from the NFIRS data alone in the table differ from the average loss measures computed from national estimates. Average loss for fatalities and injuries is computed per 1,000 fires. Average dollar loss is computed per fire and rounded to the nearest $10. The 2012 and 2013 dollar-loss values were adjusted to 2014 dollars.
- In NFIRS, confined fires are defined by Incident Types 113 to 118.
