2016-2017 Influenza Season Week 3 ending January 21, 2017
January 31st, 20172016-2017 Influenza Season Week 3 ending January 21, 2017
All data are preliminary and may change as more reports are received.
Synopsis:
During week 3 (January 15-21, 2017), influenza activity increased in the United States..
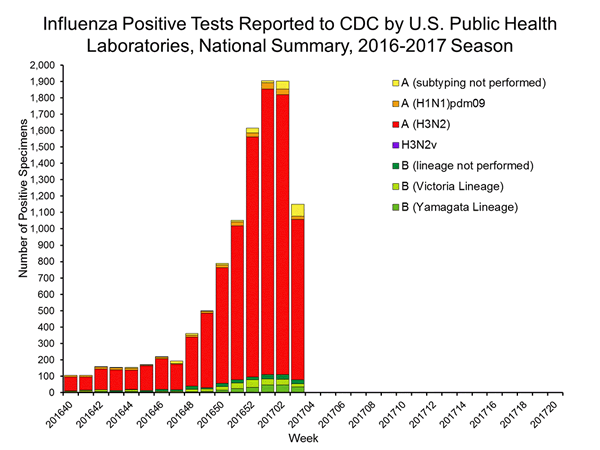
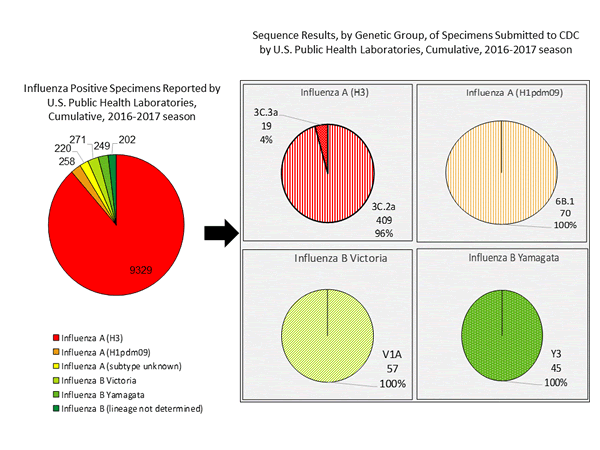
- Viral Surveillance: The most frequently identified influenza virus subtype reported by public health laboratories during week 3 was influenza A (H3). The percentage of respiratory specimens testing positive for influenza in clinical laboratories increased.
- Pneumonia and Influenza Mortality: The proportion of deaths attributed to pneumonia and influenza (P&I) was above the system-specific epidemic threshold in the National Center for Health Statistics (NCHS) Mortality Surveillance System.
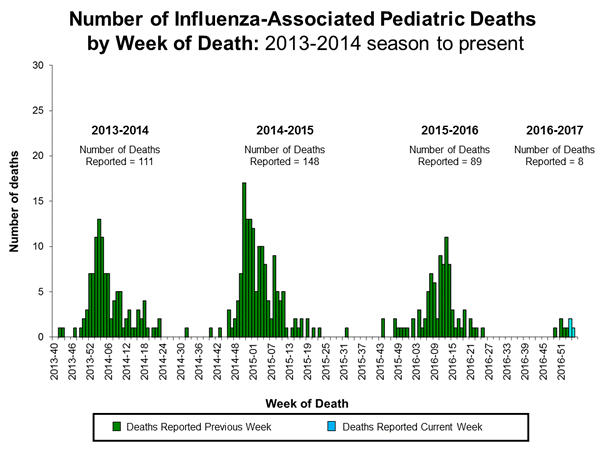
- Influenza-associated Pediatric Deaths: Three influenza-associated pediatric deaths were reported.
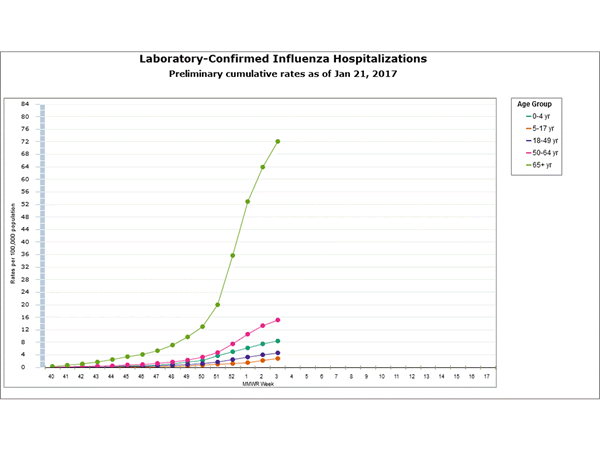
- Influenza-associated Hospitalizations: A cumulative rate for the season of 15.4 laboratory-confirmed influenza-associated hospitalizations per 100,000 population was reported.
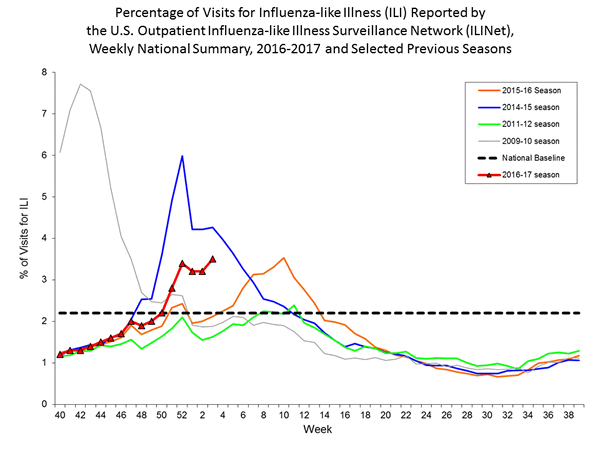
- Outpatient Illness Surveillance:The proportion of outpatient visits for influenza-like illness (ILI) was 3.4%, which is above the national baseline of 2.2%. All 10 regions reported ILI at or above their region-specific baseline levels. New York City and 10 states experienced high ILI activity; 10 states experienced moderate ILI activity; Puerto Rico and 17 states experienced low ILI activity; 13 states experienced minimal ILI activity, and the District of Columbia had insufficient data.
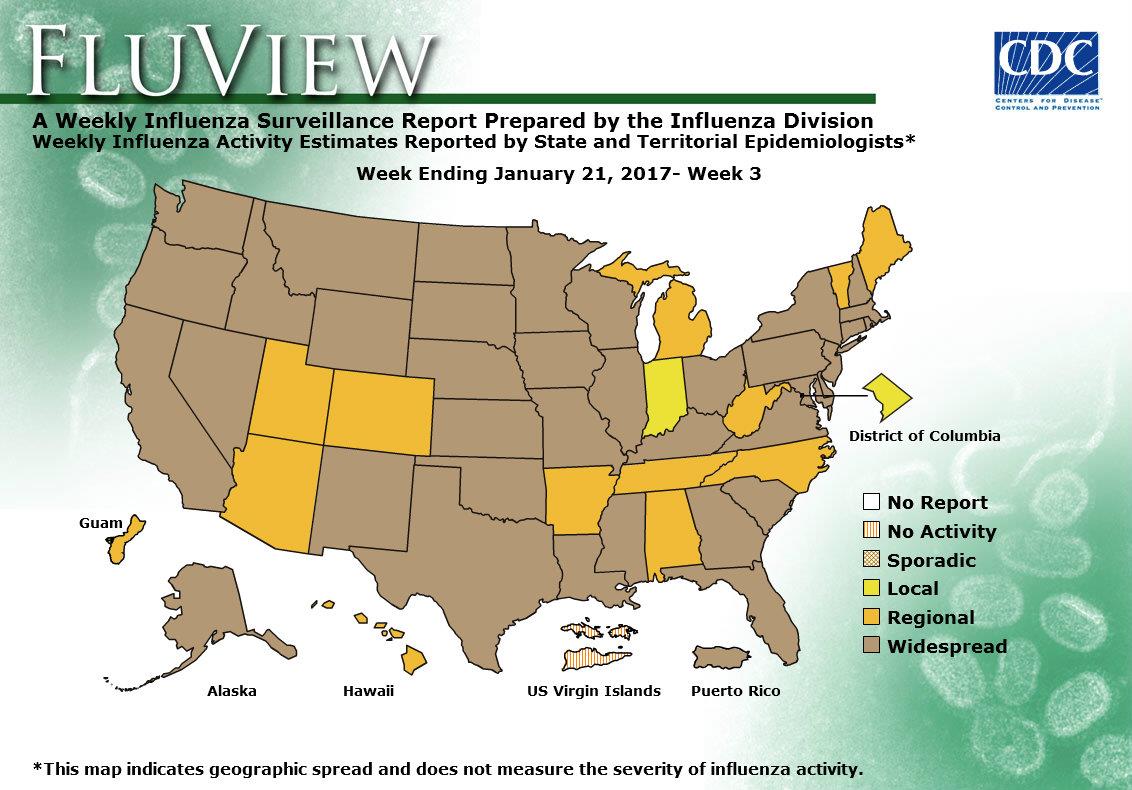
- Geographic Spread of Influenza: The geographic spread of influenza in Puerto Rico and 37 states was reported as widespread; Guam and 12 states reported regional activity; the District of Columbia and one state reported local activity; and the U.S. Virgin Islands reported no activity.