Archive for January, 2017
Coalition for Epidemic Preparedness Innovations raises $500 million
Tuesday, January 24th, 2017“Stung by the lack of vaccines to fight the West African Ebola epidemic, a group of prominent donors announced Wednesday that they had raised almost $500 million for a new partnership to stop epidemics before they spiral out of control.
The partnership, the Coalition for Epidemic Preparedness Innovations, will initially develop and stockpile vaccines against three known viral threats, and also push the development of technology to brew large amounts of vaccine quickly when new threats…arise……Bill Gates, founder of the Bill and Melinda Gates Foundation, one of the largest initial donors…has often predicted that the catastrophe most likely to kill 10 million people in the near future is a pandemic rather than nuclear war, terrorism, famine or natural disaster.
The other donors….include the governments of Japan and Norway, and Britain’s Wellcome Trust. Each is putting up $100 million to $125 million over five years; Germany, India and the European Commission are expected to announce donations soon.
Six major vaccine makers — GlaxoSmithKline, Johnson & Johnson, Merck, Pfizer, Sanofi and Takeda — joined in the coalition as “partners” rather than donors, as did the World Health Organization and Doctors Without Borders……”
1/23/1556: An estimated 8.3 earthquake in Shaanxi, China, kills an estimated 830,000 people more or less.
Monday, January 23rd, 2017- “…The quake struck in the middle of a densely populated area with poorly constructed buildings and homes, resulting in a horrific death toll…”
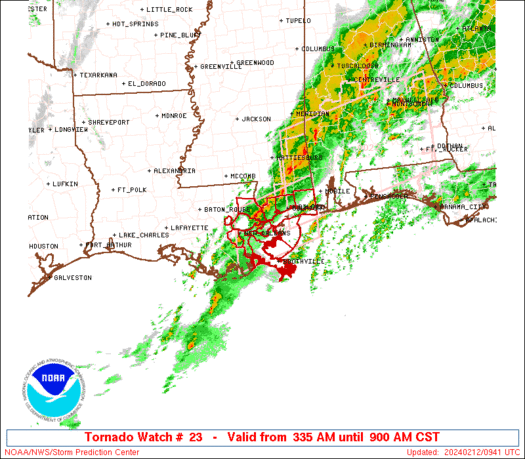
A series of furious storms roared through the Southeast on Sunday, killing at least 18 people, splintering homes and toppling trees and power lines in the path.
Monday, January 23rd, 2017The mountainous area of Befotaka in southeastern Madagascar has seen 68 cases — of which 27 have died — since the end of last year.
Monday, January 23rd, 2017India: At least 39 passengers were killed and over 50 injured when the Hirakhand Express derailed .
Sunday, January 22nd, 2017M 7.9 – 41km WNW of Panguna, Papua New Guinea
Sunday, January 22nd, 2017
WEAK53 PAAQ 220440
TIBAK1
Tsunami Information Statement Number 1
NWS National Tsunami Warning Center Palmer AK
840 PM PST Sat Jan 21 2017
…THIS IS A TSUNAMI INFORMATION STATEMENT FOR ALASKA, BRITISH
COLUMBIA, WASHINGTON, OREGON AND CALIFORNIA…
EVALUATION
———-
* There is no tsunami danger for the areas listed above.
* Based on the depth of the earthquake a tsunami
is not expected.
* An earthquake has occurred with parameters listed below.
PRELIMINARY EARTHQUAKE PARAMETERS
———————————
* The following parameters are based on a rapid preliminary
assessment and changes may occur.
* Magnitude 8.0
* Origin Time 1930 AKST Jan 21 2017
2030 PST Jan 21 2017
0430 UTC Jan 22 2017
* Coordinates 6.1 South 155.2 East
* Depth 104 miles
* Location near the Solomon Islands
ADDITIONAL INFORMATION AND NEXT UPDATE
————————————–
* Refer to the internet site ntwc.arh.noaa.gov for
additional information.
* Pacific coastal regions outside California, Oregon,
Washington, British Columbia and Alaska should refer to the
Pacific Tsunami Warning Center messages at ptwc.weather.gov.
* This will be the only U.S. National Tsunami Warning center
message for this event unless additional information becomes
available.
$$
A case report on an immunocompromised patient with prolonged influenza virus reveals resistance to two common antiviral drugs and shows how rapidly antiviral resistance can evolve.
Sunday, January 22nd, 2017Trebbien R, Pedersen SS, Vorborg K, Franck KT, Fischer TK. Development of oseltamivir and zanamivir resistance in influenza A(H1N1)pdm09 virus, Denmark, 2014. Euro Surveill. 2017;22(3):pii=30445. DOI: http://dx.doi.org/10.2807/1560-7917.ES.2017.22.3.30445
“Influenza virus is the cause of annual seasonal epidemics worldwide, and leads to high morbidity in the population. Severe disease and deadly outcome due to influenza virus are recognised in the defined risk groups, in particular elderly persons > 65 years of age and immunocompromised patients. Influenza is normally an acute self-limiting disease with a duration of 5 to 7 days, however, in immunocompromised patients prolonged infections lasting several months have been reported [1–4]. Prevention of severe influenza disease is mainly based on immunisations with split vaccines which are produced annually to accommodate the changing antigenicity of seasonal epidemic viruses [5,6]. The effect of vaccination in immunocompromised patients is questionable and this is why other modes of prevention and/or treatment often are considered for this risk group [7–12]. For treatment of influenza viruses only a few antiviral drugs are available; the neuraminidase (NA) inhibitors and the matrix-2 (M2)-ion channel inhibitors. The current circulating epidemic influenza viruses harbour natural resistance towards the M2-ion channel inhibitors therefore these are not an option for treatment [13–15]. The NA inhibitors bind to the NA surface protein and prevent it from facilitating the release of new virus particles from an infected cell [16]. In Denmark, two different NA inhibitors are approved and available for treatment of influenza: oseltamivir (Tamiflu) and zanamivir (Relenza). Oseltamivir is the drug of choice for treatment due to its easy oral administration whereas zanamivir (intravenous or inhalation) is often used when the effect of oseltamivir is limited, e.g. in case of development of resistance. In the NA gene of the H1N1 viruses a range of amino acid mutations are recognised to confer reduced inhibition by NA inhibitors [16–18]. Among these, two well characterised mutations are the H275Y mutation which results in viruses with highly reduced inhibition by oseltamivir and the I223R mutation which results in reduced inhibition by both oseltamivir and zanamivir [16,17].
Antiviral treatment of immunocompromised patients with prolonged influenza virus infection can lead to multidrug-resistant influenza quasispecies in the same patient [1]. We describe how the emergence of such virus variants poses challenges in the combat of a severe influenza infection in a Danish patient treated with antivirals. The patient had sustained shedding of influenza A(H1N1)pdm09 virus for 6 months and was treated with oseltamivir and subsequently zanamivir. Antiviral resistance mutation profiles were evaluated using conventional Sanger sequencing and next generation sequencing (NGS)…..”
Flu in Europe: Week 2/2017 (9 – 15 January 2017)
Saturday, January 21st, 2017Week 2/2017 (9 – 15 January 2017)
- Influenza activity remained widespread across the region with high or very high intensity in 8 out of 44 reporting countries or regions and medium intensity in 26 countries.
- The proportion of influenza virus detections among sentinel surveillance specimens was 46%, a slight decline from 52% in the previous week.
- The great majority of influenza viruses detected were type A (97%) and, of those subtyped, 99% were A(H3N2).
- Most of the hospitalized laboratory-confirmed cases reported have occurred in people aged 65 years or more.
- Excess all-cause mortality among the elderly has been observed in the past 1 to 2 months in most of the 18 countries that take part in EuroMOMO.
Season overview
- Influenza activity started early this season compared to previous seasons.
- Week 46/2016 is the earliest week that the overall influenza-positivity rate in sentinel specimens reached 10% since the emergence of A(H1N1)pdm09 viruses in the 2009 season; during the last 6 seasons this occurred between weeks 48 and 51.
- Since week 40/2016, influenza A viruses have predominated, accounting for 96% of all sentinel detections; the great majority (99%) of subtyped influenza A viruses from sentinel sites has been A(H3N2).
- In an influenza season in which A(H3N2) viruses predominate, elderly populations can be expected to be most severely affected. Indeed, confirmed cases of influenza A infection reported from hospitals have predominantly been in adults aged over 65 years.
- So far, circulating A(H3N2) viruses are antigenically similar to the vaccine strain. While about two-thirds of the A(H3N2) viruses characterized belong to a new genetic subclade (3C.2a1), these viruses are antigenically similar to the vaccine strain (clade 3C.2a).
- Early monitoring of vaccine effectiveness in Finland and Sweden suggests levels of effectiveness similar to estimates from multi-country studies during the seasons 2011–2012 to 2014–2015 with 26% (95% CI 22% to 30%) and 24% (95% CI 11% to 34%) vaccine effectiveness, respectively, in persons aged 65 years and older with laboratory-confirmed influenza A. Given the partial effectiveness of influenza vaccines, rapid use of neuraminidase inhibitors for laboratory-confirmed or probable cases of influenza infection should be considered for vaccinated and non-vaccinated patients at risk of developing complications.
- No reduced antiviral susceptibility has been observed among the viruses tested.
- A risk assessment on seasonal influenza in EU/EEA countries was published by ECDC on 24 December 2016. The above summary is in line with the findings of the risk assessment.
Figure. Influenza virus detections in sentinel-source specimens by type and subtype, by week and cumulatively
CDC’s Summary of Weekly FluView Report, Week 2
Saturday, January 21st, 2017Summary of Weekly FluView Report
U.S. Situation Update
Key Flu Indicators
According to the FluView report for the week ending January 14, 2017 (week 2), flu activity continues to increase in the United States. The proportion of people seeing their health care provider for influenza-like-illness (ILI) has been at or above the national baseline for five consecutive weeks so far this season and the number of states reporting widespread flu activity increased from 21 states to 29 states. Also, CDC reported two additional flu-associated pediatric deaths for the 2016-2017 season. Influenza A (H3) viruses continue to predominate. Flu activity is expected to continue over the coming weeks. CDC recommends annual flu vaccination for everyone 6 months of age and older. Anyone who has not gotten vaccinated yet this season should get vaccinated now. Below is a summary of the key flu indicators for the week ending January 14, 2017:
- Influenza-like Illness Surveillance: For the week ending January 14, the proportion of people seeing their health care provider(https://www.cdc.gov/flu/weekly/#_blank) for influenza-like illness (ILI) increased to 3.3%. This remains above the national baseline of 2.2%. All ten regions reported ILI at or above their region-specific baseline level. For the last 15 seasons, the average duration of a flu season by this measure has been 13 weeks, with a range from one week to 20 weeks.
- Influenza-like Illness State Activity Indicator Map: New York City and six states (Missouri, New Jersey, New York, Oklahoma, South Carolina, and Tennessee) experienced high ILI activity. Puerto Rico and eight states (Alabama, Alaska, Georgia, Louisiana, Pennsylvania, Utah, Virginia, and Wyoming) experienced moderate ILI activity. 14 states (Arizona, Arkansas, California, Colorado, Hawaii, Idaho, Illinois, Kansas, Kentucky, Michigan, Mississippi, Nebraska, Nevada, and South Dakota). 22 states experienced minimal ILI activity. The District of Columbia did not have sufficient data to calculate an activity level. ILI activity data indicate the amount of flu-like illness that is occurring in each state.
- Geographic Spread of Influenza Viruses: Widespread influenza activity was reported by Puerto Rico and 29 states (Alaska, California, Connecticut, Delaware, Florida, Idaho, Illinois, Kentucky, Maryland, Massachusetts, Missouri, Montana, Nebraska, Nevada, New Hampshire, New Jersey, New York, North Dakota, Ohio, Oklahoma, Oregon, Pennsylvania, Rhode Island, South Carolina, Texas, Virginia, Washington, Wisconsin, and Wyoming). Regional influenza activity was reported by Guam and 17 states (Alabama, Arizona, Arkansas, Colorado, Georgia, Hawaii, Iowa, Kansas, Louisiana, Maine, Michigan, Minnesota, Mississippi, New Mexico, North Carolina, South Dakota, and Utah). Local influenza activity was reported by the District of Columbia and four states (Indiana, Tennessee, Vermont, and West Virginia). Sporadic influenza activity was reported by the U.S. Virgin Islands. Geographic spread data show how many areas within a state or territory are seeing flu activity.
- Flu-Associated Hospitalizations: Since October 1, 2016, a total of 2,864 laboratory-confirmed influenza-associated hospitalizations(https://www.cdc.gov/flu/weekly/#_blank) have been reported. This translates to a cumulative overall rate of 10.2 hospitalizations per 100,000 people in the United States. Additional data, including hospitalization rates during other influenza seasons, can be found at http://gis.cdc.gov/GRASP/Fluview/FluHospRates.html and http://gis.cdc.gov/grasp/fluview/FluHospChars.html.
- The highest hospitalization rates are among people 65 years and older (47.3 per 100,000), followed by adults 50-64 years (10.1 per 100,000) and children younger than 5 years (6.8 per 100,000). During most seasons, children younger than 5 years and adults 65 years and older have the highest hospitalization rates.
- Hospitalization data are collected from 13 states and represent approximately 9% of the total U.S. population. The number of hospitalizations reported does not reflect the actual total number of influenza-associated hospitalizations in the United States.
- The highest hospitalization rates are among people 65 years and older (47.3 per 100,000), followed by adults 50-64 years (10.1 per 100,000) and children younger than 5 years (6.8 per 100,000). During most seasons, children younger than 5 years and adults 65 years and older have the highest hospitalization rates.
- Mortality Surveillance:
- The proportion of deaths(https://www.cdc.gov/flu/weekly/#_blank) attributed to pneumonia and influenza (P&I) was 7.0% for the week ending December 31, 2016 (week 52). This percentage is below the epidemic threshold of 7.3% for week 52 in the National Center for Health Statistics (NCHS) Mortality Surveillance System.
- Pediatric Deaths:
- Two influenza-associated pediatric deaths were reported to CDC during the week ending January 14, 2017.
- One death was associated with an influenza A virus for which no subtyping was performed and occurred during week 49 (the week ending December 10, 2016.
- One death was associated with an influenza virus for which the type was not determined and occurred during week 1 (the week ending January 7, 2017).
- A total of 5 influenza-associated pediatric deaths have been reported during the 2016-2017 season.
- Laboratory Data:
- Nationally, the percentage of respiratory specimens(https://www.cdc.gov/flu/weekly/index.htm#_blank) testing positive for influenza viruses in clinical laboratories during the week ending January 14 was 15.3%.
- Regionally, the three week average percent of specimens testing positive for influenza in clinical laboratories ranged from 9.2% to 28.0%.
- During the week ending January 14, of the 4,258 (15.3%) influenza-positive tests reported to CDC by clinical laboratories, 3,916 (92.0%) were influenza A viruses and 342 (8.0%) were influenza B viruses.
- The most frequently identified influenza virus type reported by public health laboratories during the week ending January 14 was influenza A viruses, with influenza A (H3) viruses predominating.
- During the week ending January 14, 824 (94.2%) of the 875 influenza-positive tests reported to CDC by public health laboratories were influenza A viruses and 51 (5.8%) were influenza B viruses. Of the 777 influenza A viruses that were subtyped, 761 (97.9%) were H3 viruses and 16 (2.1%) were (H1N1)pdm09 viruses.
- Since October 1, 2016, antigenic and/or genetic characterization shows that the majority of the tested viruses remain similar to the recommended components of the 2016-2017 Northern Hemisphere vaccines.
- Since October 1, 2016, CDC tested 545 specimens (59 influenza A (H1N1)pdm09, 385 influenza A (H3N2), and 101 influenza B viruses) for resistance to the neuraminidase inhibitors antiviral drugs. None of the tested viruses were found to be resistant to oseltamivir, zanamivir, or peramivir.


