2017-2018 Influenza Season Week 4 ending January 27, 2018
February 3rd, 2018Synopsis:
During week 4 (January 21-27, 2018), influenza activity increased in the United States.
- Viral Surveillance: The most frequently identified influenza virus subtype reported by public health laboratories during week 4 was influenza A(H3). The percentage of respiratory specimens testing positive for influenza in clinical laboratories remained elevated.
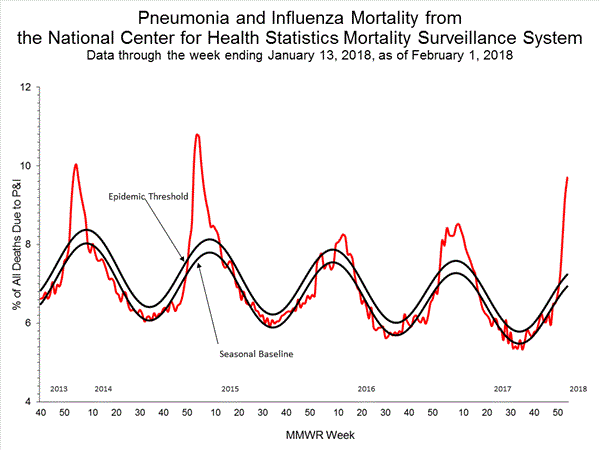
- Pneumonia and Influenza Mortality: The proportion of deaths attributed to pneumonia and influenza (P&I) was above the system-specific epidemic threshold in the National Center for Health Statistics (NCHS) Mortality Surveillance System.
- Influenza-associated Pediatric Deaths: Seventeen influenza-associated pediatric deaths were reported, one of which occurred during the 2015-2016 season.
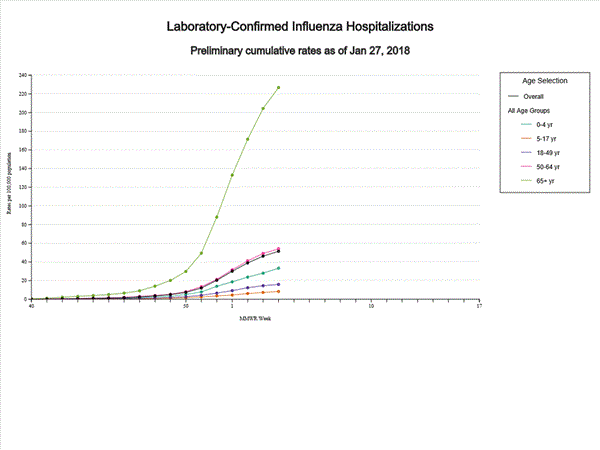
- Influenza-associated Hospitalizations: A cumulative rate of 51.4 laboratory-confirmed influenza-associated hospitalizations per 100,000 population was reported.
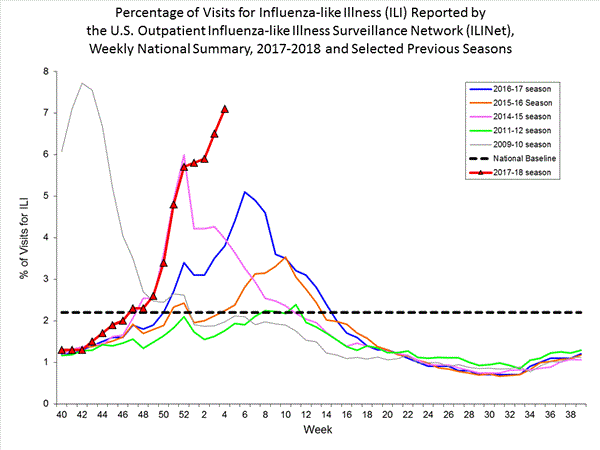
- Outpatient Illness Surveillance: The proportion of outpatient visits for influenza-like illness (ILI) was 7.1%, which is above the national baseline of 2.2%. All 10 regions reported ILI at or above region-specific baseline levels. New York City, the District of Columbia, and 42 states experienced high ILI activity; Puerto Rico and two states experienced moderate ILI activity; three states experienced low ILI activity; and three states experienced minimal ILI activity.
- Geographic Spread of Influenza:The geographic spread of influenza in Puerto Rico and 48 states was reported as widespread; Guam and one state reported regional activity; the District of Columbia and one state reported local activity; and the U.S. Virgin Islands reported sporadic activity.
Influenza-Associated Pediatric Mortality:
Seventeen influenza-associated pediatric deaths were reported to CDC during week 4.
Five deaths were associated with an influenza A(H3) virus and occurred during weeks 1, 2, 3, and 4 (the weeks ending January 6, January 13, January 20, and January 27, 2018). Two deaths were associated with an influenza A(H1N1)pdm09 virus and occurred during weeks 3 and 4 (the weeks ending January 20, 2018, and January 27, 2018, respectively). Four deaths were associated with an influenza A virus for which no subtyping was performed and occurred during weeks 3 and 4. Five deaths were associated with an influenza B virus and occurred during weeks 1, 3, and 4 (the week ending January 6, January 20, and January 27, 2018, respectively).
A total of 53 influenza-associated pediatric deaths have been reported for the 2017-2018 season.
One death that occurred during the 2015-2016 season was associated with an influenza A virus for which no subtyping was performed and occurred during week 28 (the week ending July 16, 2016). This death brings the total number of reported influenza-associated deaths occurring during that season to 93.
Additional data can be found at: http://gis.cdc.gov/GRASP/Fluview/PedFluDeath.html.
Influenza-Associated Hospitalizations:
The Influenza Hospitalization Surveillance Network (FluSurv-NET) conducts population-based surveillance for laboratory-confirmed influenza-related hospitalizations in children younger than 18 years of age (since the 2003-2004 influenza season) and adults (since the 2005-2006 influenza season).
The FluSurv-NET covers more than 70 counties in the 10 Emerging Infections Program (EIP) states (CA, CO, CT, GA, MD, MN, NM, NY, OR, and TN) and additional Influenza Hospitalization Surveillance Project (IHSP) states. The IHSP began during the 2009-2010 season to enhance surveillance during the 2009 H1N1 pandemic. IHSP sites included IA, ID, MI, OK and SD during the 2009-2010 season; ID, MI, OH, OK, RI, and UT during the 2010-2011 season; MI, OH, RI, and UT during the 2011-2012 season; IA, MI, OH, RI, and UT during the 2012-2013 season; and MI, OH, and UT during the 2013-2014, 2014-15, 2015-16, 2016-17, and 2017-18 seasons.
Data gathered are used to estimate age-specific hospitalization rates on a weekly basis, and describe characteristics of persons hospitalized with influenza illness. The rates provided are likely to be an underestimate as influenza-related hospitalizations can be missed, either because testing is not performed, or because cases may be attributed to other causes of pneumonia or other common influenza-related complications.
A total of 14,676 laboratory-confirmed influenza-associated hospitalizations were reported between October 1, 2017 and January 27, 2018. The overall hospitalization rate was 51.4 per 100,000 population. The highest rate of hospitalization was among adults aged ≥65 years (226.8 per 100,000 population), followed by adults aged 50-64 (54.0 per 100,000 population) and children aged 0-4 years (33.3 per 100,000 population). Among 14,676 hospitalizations, 12,849 (87.5%) were associated with influenza A virus, 1,762 (12.0%) with influenza B virus, 35 (0.2%) with influenza A virus and influenza B virus co-infection, and 30 (0.2%) with influenza virus for which the type was not determined. Among those with influenza A subtype information, 2,797 (86.5%) were A(H3N2) and 437 (13.5%) were A(H1N1)pdm09 virus.
Among 1,708 hospitalized adults with information on underlying medical conditions, 1,183 (69.3%) had at least one reported underlying medical condition; the most commonly reported were cardiovascular disease, metabolic disorder, obesity, and chronic lung disease. Among 180 hospitalized children with information on underlying medical conditions, 93 (51.7%) had at least one underlying medical condition; the most commonly reported were asthma, neurologic disorder, and obesity. Among 138 hospitalized women of childbearing age (15-44 years) with information on pregnancy status, 33 (23.9%) were pregnant.
Additional FluSurv-NET data can be found at: http://gis.cdc.gov/GRASP/Fluview/FluHospRates.html and http://gis.cdc.gov/grasp/fluview/FluHospChars.html.
Outpatient Illness Surveillance:
Nationwide during week 4, 7.1% of patient visits reported through the U.S. Outpatient Influenza-like Illness Surveillance Network (ILINet) were due to influenza-like illness (ILI). This percentage is above the national baseline of 2.2%.(ILI is defined as fever (temperature of 100°F [37.8°C] or greater) and cough and/or sore throat.)
Additional ILINet data, including national, regional and select state-level data, are available at http://gis.cdc.gov/grasp/fluview/fluportaldashboard.html.
On a regional level, the percentage of outpatient visits for ILI ranged from 2.8% to 13.0% during week 4. All 10 regions reported percentages of outpatient visits for ILI at or above their region specific baselines.