CDC: Annual snapshot of foodborne illnesses
April 29th, 2019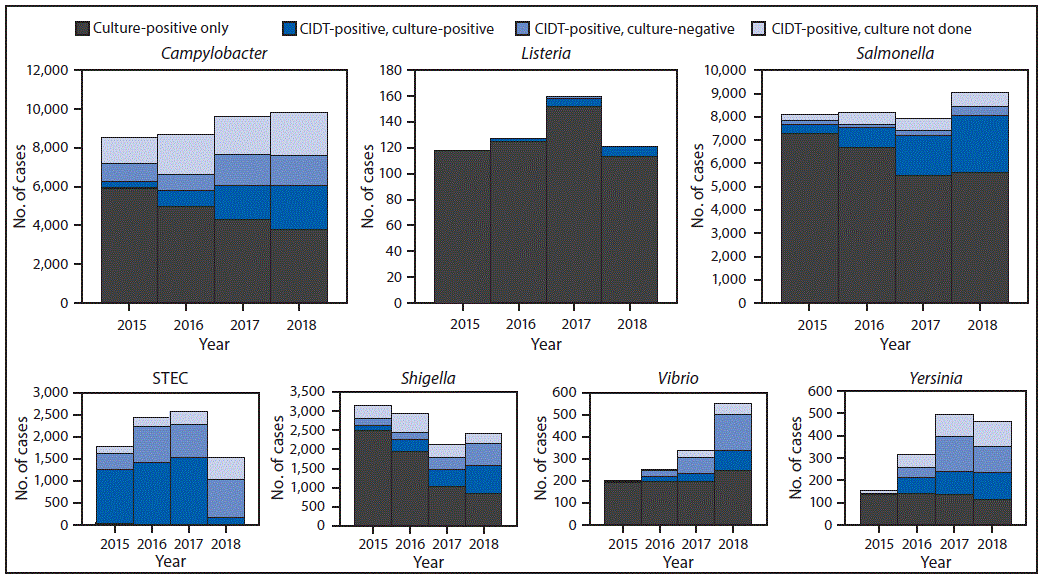
Tack DM, Marder EP, Griffin PM, et al. Preliminary Incidence and Trends of Infections with Pathogens Transmitted Commonly Through Food — Foodborne Diseases Active Surveillance Network, 10 U.S. Sites, 2015–2018. MMWR Morb Mortal Wkly Rep 2019;68:369–373. DOI: http://dx.doi.org/10.15585/mmwr.mm6816a2External.
This entry was posted
on
Monday, April 29th, 2019 at
10:00 am and is filed under
Food-borne diseases .
You can follow any responses to this entry through the RSS 2.0 feed. Both comments and pings are currently closed.
You can follow any responses to this entry through the RSS 2.0 feed. Both comments and pings are currently closed.
Comments are closed.
Categories
- 2019 Novel Coronavirus (100)
- Acute flaccid myelitis (AFM) (12)
- Air (1)
- Alkhurma hemorrhagic fever (AHF) (1)
- Aluminium phosphide (1)
- AMR-Antimicrobial Resistance (3)
- Anaplasmosis (3)
- Angiostrongylus cantonensis (4)
- Animals/Pets (13)
- Anthrax (20)
- Avalanche (16)
- Aviation (70)
- Bioterrorism (30)
- Blast Effects/Injuries (35)
- Botulism (32)
- Buruli ulcer (1)
- Cancer (6)
- Candida auris (9)
- CBIRNE (3)
- CCHF (2)
- CDC (111)
- Chagas Disease (8)
- Chemical Threats (43)
- Chikungunya (62)
- China (12)
- Cholera (83)
- Ciguatera (4)
- Civil unrest (38)
- Climate Change (64)
- CO (4)
- Coccidioidomycosis (1)
- Communicable diseases (7)
- Conflict (117)
- Cyanide (2)
- Cyberterrorism (6)
- Cyclospora (5)
- Dengue (50)
- Diarrhea (5)
- Diphtheria (6)
- Documents (96)
- Drills/exercises (24)
- Drought (9)
- E. coli O157:H7 (5)
- Earthquake (213)
- Eastern Equine Encephalitis (1)
- Ebola (171)
- Echovirus 30 (1)
- Education (17)
- Elephantiasis (lymphatic filariasis (2)
- EMS (7)
- Environment (33)
- Ethics (5)
- Europe (6)
- Explosives (47)
- Famine (12)
- FBI (7)
- FCC (1)
- FDA (16)
- FEMA (45)
- FGM (Female Genital Mutilation) (15)
- Filariasis (2)
- Fires/Wildfires (251)
- First Responders (22)
- Flood (161)
- Folic Acid (1)
- Food-borne diseases (104)
- Global Health (129)
- Guinea worm disease/Dracunculiasis (9)
- H3N2 (3)
- H5N6 (1)
- H7N9 (50)
- H9N2 (1)
- Haff Disease (1)
- Hajj (1)
- Hanta virus (1)
- Hazardous Materials (HAZMAT) (84)
- Hepatitis C (16)
- Historical (382)
- Historical Event (397)
- HIV/AIDS (10)
- Homeland Security (7)
- Hookworm (1)
- Human Rights (26)
- Humanitarian (107)
- Influenza (136)
- Kids-Infants (112)
- Konzo (2)
- Landslides/mudslides (22)
- Lassa Fever (31)
- Lead poisoning (2)
- Legionnaire's Disease (6)
- Leishmaniasis (10)
- Leprosy (5)
- Leptospirosis (4)
- Lightning (3)
- Listeria (6)
- Loiasis (1)
- Malaria (55)
- Malnutrition (6)
- Maritime (58)
- Mass fatalities (69)
- Mass Gatherings (19)
- Mass shooting (197)
- Mayaro fever (1)
- MCI (4)
- Measles (49)
- Melioidosis (6)
- Meningitis (9)
- Mental health (11)
- MERS-CoV (157)
- Microplastics (1)
- Migration (128)
- Monkeypox (6)
- Mumps (3)
- Mycetoma (1)
- Naegleria fowleri (9)
- NASA (28)
- NDMS/DMAT (2)
- Neglected Tropical Diseases (15)
- Neurocysticercosis (1)
- Nipah virus (11)
- NOAA (2)
- Nodding Syndrome (1)
- Non-communicable diseases (3)
- Norovirus (1)
- Novichok (12)
- Ntwetwe virus (1)
- Nuclear-Radiation-Contamination (70)
- Obesity (2)
- Onchocerciasis (river blindness) (3)
- ORT (1)
- Pandemic (93)
- PFAs (1)
- PHEMCE (3)
- Plague (40)
- Podoconiosis (2)
- PODs (2)
- Polio (33)
- Pollution (10)
- Public Health (25)
- Rabies (35)
- Red Cross/Red Crescent (9)
- Ricin (8)
- Rift Valley Fever (5)
- Riots (15)
- Rocky Mountain Spotted Fever (2)
- Rohingya (63)
- Rotavirus (2)
- Salmonella (4)
- Salt (1)
- Schistosomiasis (5)
- Scurvy (1)
- Seoul Virus (1)
- SFTS (9)
- Silicosis (1)
- Slavery (6)
- Smallpox (10)
- Smog (6)
- Snake envenomation (7)
- Social media (2)
- Stampede (17)
- STI (1)
- Strategic National Stockpile (9)
- Structural (71)
- Sword's Point (1)
- TB (8)
- Telemedicine (1)
- Terrorism (443)
- Tetanus (4)
- Thelaziasis (2)
- Tick-borne diseases (1)
- Tobacco (3)
- Tornado (33)
- Trachoma (10)
- Trafficking (11)
- Transportation incident (103)
- Trauma (5)
- Triage (2)
- Trichinosis (1)
- Tropical cyclones (470)
- Tropical storms (336)
- Tsunami (22)
- Tuberculosis (12)
- Tularemia (2)
- Typhoid fever (2)
- Uncategorized (103)
- United Nations (14)
- USDA (3)
- Usutu virus (1)
- VHF (10)
- Vibrio vulnificus (2)
- Volcano (82)
- Water (28)
- Weather (186)
- West Nile Virus (11)
- WHO (124)
- Women issues (37)
- Wuhan (55)
- Yellow Fever (86)
- Zika virus (271)
Recent Posts
Archives
- February 2022
- December 2021
- May 2021
- April 2021
- March 2021
- February 2021
- January 2021
- December 2020
- November 2020
- October 2020
- September 2020
- August 2020
- July 2020
- June 2020
- March 2020
- February 2020
- January 2020
- December 2019
- November 2019
- October 2019
- September 2019
- August 2019
- July 2019
- June 2019
- May 2019
- April 2019
- March 2019
- February 2019
- January 2019
- December 2018
- November 2018
- October 2018
- September 2018
- August 2018
- July 2018
- June 2018
- May 2018
- April 2018
- March 2018
- February 2018
- January 2018
- December 2017
- November 2017
- October 2017
- September 2017
- August 2017
- July 2017
- June 2017
- May 2017
- April 2017
- March 2017
- February 2017
- January 2017
- December 2016
- November 2016
- October 2016
- September 2016
- August 2016
- July 2016
- June 2016
- May 2016
- April 2016
- March 2016
- February 2016
- January 2016
- December 2015
- November 2015