2015-2016 Influenza Season Week 2 ending January 16, 2016
January 24th, 2016During week 2 (January 10-16, 2016), influenza activity increased slightly in the United States.
- Viral Surveillance: The most frequently identified influenza virus type reported by public health laboratories during week 2 was influenza A, with influenza A (H1N1)pdm09 viruses predominating. The percentage of respiratory specimens testing positive for influenza in clinical laboratories increased.
- Novel Influenza A Virus: One human infection with a novel influenza A virus was reported.
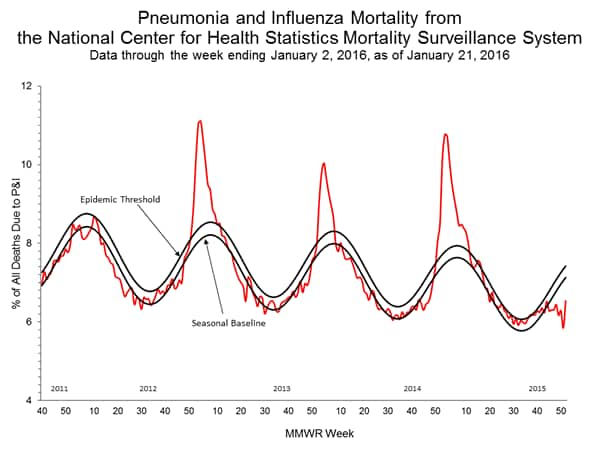
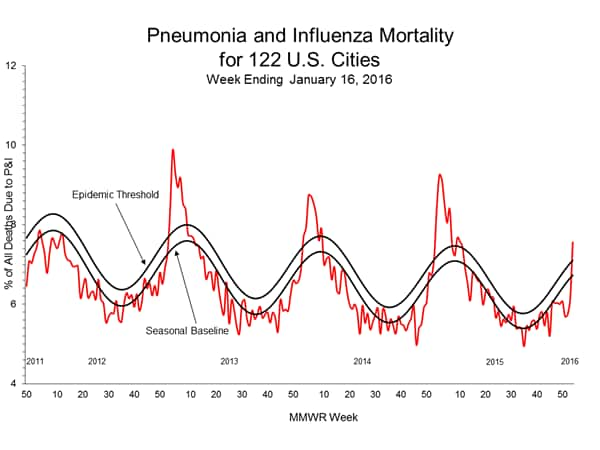
- Pneumonia and Influenza Mortality: The proportion of deaths attributed to pneumonia and influenza (P&I) was below the system-specific epidemic threshold in the NCHS Mortality Surveillance System and above the system-specific epidemic threshold in the 122 Cities Mortality Reporting System.
- Influenza-associated Pediatric Deaths: No influenza-associated pediatric deaths were reported.
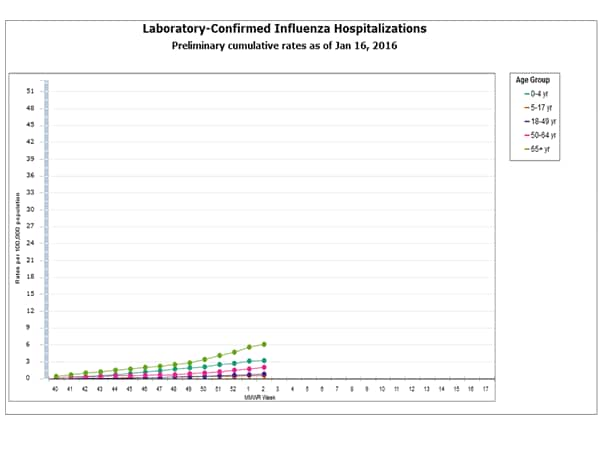
- Influenza-associated Hospitalizations: A cumulative rate for the season of 1.8 laboratory-confirmed influenza-associated hospitalizations per 100,000 population was reported.
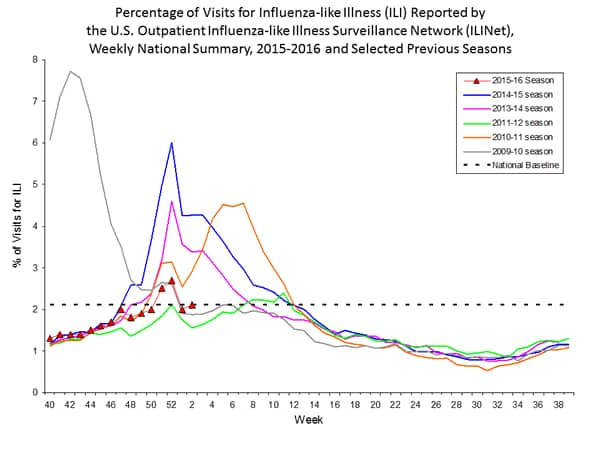
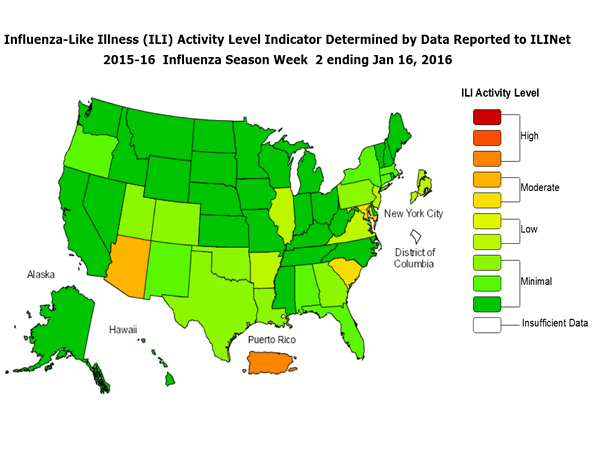
- Outpatient Illness Surveillance: The proportion of outpatient visits for influenza-like illness (ILI) was 2.1%, which is at the national baseline of 2.1%. Six of 10 regions reported ILI at or above region-specific baseline levels. Puerto Rico experienced high ILI activity; three states experienced moderate ILI activity; New York City and four states experienced low ILI activity; 43 states experienced minimal ILI activity; and the District of Columbia had insufficient data.
- Geographic Spread of Influenza: The geographic spread of influenza in three states was reported as widespread; Puerto Rico and 10 states reported regional activity; Guam and 12 states reported local activity; the U.S. Virgin Islands and 24 states reported sporadic activity; and the District of Columbia and one state reported no influenza activity.
Region and state-specific data are available at http://www.cdc.gov/flu/weekly/nchs.htm.