Global & Disaster Medicine

Archive for December, 2019

CDC: Preparing Children with Special Healthcare Needs for an Emergency

CDC Resources

Preparation

First and foremost, establish a personal support network or self-help team that is familiar with your child’s special healthcare needs, and available to help before, during, and after an emergency. Work with your team to identify the 7 key areas of support:

  1. Make arrangements prior to an emergency for your team to immediately check-in with you when disaster strikes.
  2. Exchange important keys or codes, such as, house keys, car keys, and garage door codes.
  3. Show them where you keep emergency supplies.
  4. Share copies of your emergency documents, evacuation plans and emergency health information card.
  5. Review and practice ways for contacting each other in an emergency.
  6. Notify your team when you have plans to travel, and make sure they know when you will return.
  7. Learn about each other’s needs and how you can help before, during and after an emergency.

In order to prepare your family and your team ahead of time, make sure you create an emergency care plan that considers the special needs of your child. For example, if your child has specific dietary needs or mobility limitations, make sure that your emergency plan has information on the kinds of food to avoid or a list of items that your child may need for his or her assistant devices (ex. Spare battery for an electric chair). It might also be helpful to create a kit or go-bag that has necessary back-up battery supplies, special non-perishable foods and special medicines. For example, if your child has asthma, make sure you have an adequate supply of asthma medications such as albuterol. You may also need to consider having spare albuterol inhalers at school and at home in case there’s an emergency.

Work with your healthcare provider and your child’s school to make sure they are aware of your child’s needs and have plans in place to accommodate those needs in case of an emergency. The American College of Emergency Physicians and the American Academy of Pediatrics developed an Emergency Information Form to help emergency care professionals and healthcare providers give appropriate care for children with special healthcare needs during an emergency.

Special education. Teddy bear hiding behind a blackboard. Special education text drawing on the blackboard

Transportation

Each emergency is different and may require different actions to keep your family safe. Depending on the emergency, authorities may ask you to stay where you are by sheltering in place, or they may recommend that you evacuate.

The American Academy of Pediatrics advises that children with special health care needs need to have access to safe transportation, specifically family vehicles and school buses that are specific to their needs.

In order to do this, families, healthcare professionals, and school administrators need to be aware of the current guidelines for properly securing and transporting children of different ages, and with different physical and mental abilities.

Families and caretakers of children with special health care needs need to avoid using makeshift restraint systems or products that are not suitable to the child being transported.

When transporting a child with special healthcare needs, please consider the following:

  1. Place the child in the back seat of a motor vehicle.
  2. For a child who requires observation during travel, and for whom an adult is not available to ride in the back seat with, an air bag on/off switch may be considered for the vehicle.
  3. Follow all instructions by the manufacturer of the vehicle, and safety seat.
  4. Children with a medical problem should have a special care plan that details how to transport them during an emergency.
  5. Families of children with special healthcare needs need to properly install appropriate restraint systems in family vehicles and know how to use them.
  6. Parents, healthcare professionals, and educators should consider a child’s transportation needs and incorporate those needs into the child’s Individual Education Plan (IEP).

Reunification

Each day, 69 million children in the United States attend childcare or school. As a caregiver you can protect your children by knowing their school or childcare center’s emergency plan.

If an emergency occurs during the school day, school authorities will activate their emergency action plan, which may include evacuating the children off site to a safer place or emergency shelter.

In situations such as this, wait until emergency or school authorities say it is safe for you to pick up your child. Do not go to your child’s childcare center or school during an emergency, doing so can put you and your child at greater risk. Instead, take steps now to help with reunification:

  • On an annual basis, make sure that your child’s school has up-to-date emergency contact information for your child. Be sure to notify the school every time your address or phone number changes.
  • Get a copy of your child’s school or child care center emergency plan. These will explain their evacuation plans, how the facility will contact you, and how you will be reunited with your child during or after an emergency.
  • Send your child to school with an updated backpack emergency card. It’s an easy way to share emergency contact information and can help when there is a communication barrier. Also, if your child is able, teach them how to call 9-1-1 and memorize important phone numbers.
  • Create reunification and communication plans that cater to your child’s special and specific needs. This may involve establishing non-verbal cues that will allow a child to communicate their needs to a trusted adult or peer.
  • Reviewing and practicing your plan with your team and family before an emergency will also help you recognize what might be missing from your plan.

The U.S. Department of Education’s Office of Safe and Supportive Schools (OSSS) and its Readiness and Emergency Management for Schools (REMS) Technical Assistance (TA) Center offers a variety of resources on the topics of reunification, access, and functional needs via web pages hosted on their website. Each page offers resources from the REMS TA Center and other national and Federal partners, including CDC that can support planning around these topics before, during, and after emergencies.


Thanks in advance for your questions and comments on this Public Health Matters post. Please note that the CDC does not give personal medical advice. If you are concerned you have a disease or condition, talk to your doctor.

Have a question for CDC? CDC-INFO (http://www.cdc.gov/cdc-info/index.html) offers live agents by phone and email to help you find the latest, reliable, and science-based health information on more than 750 health topics.

Posted on December 2, 2019 by Holly Gay


After a volcanic island in New Zealand erupted, aerial searches have revealed “no signs of life” since the eruption.

FOX: https://www.foxnews.com/world/new-zealand-volcano-white-island-tourist-no-signs-of-life


Mental health: One of the most overlooked consequences of climate change

EHN

Hardly a day goes by where we aren’t reminded that the Earth’s climate is changing and that we are responsible for much if not most of that change.

The findings of one study after another are punctuated by breaking news or the direct experience of wildfires, hurricanes and floods that forced thousands of people to evacuate, damage property, and erase tangible reminders of our past.

More ubiquitous, but less publicized, are the millions of people who are exposed to heat waves, long-term droughts, rising sea levels, and eroding coastlines, forcing them to move elsewhere or spend large sums of money building communities that are habitable.

We respond to such news and events in a variety of ways. Some of us sink into deep despair or simply resign ourselves to the inevitability of global climate change. Some of us live with the trauma of having survived life-threatening extreme weather events. Some of us actively avoid the reality of climate change or spend considerable psychic energy denying that it is happening or, at the very least, denying our responsibility for its happening.

Each of these responses represent a challenge to our mental health. For instance, people exposed to life-threatening extreme weather events are more likely to experience post-traumatic stress disorder, depression and anxiety.

People exposed to prolonged heat waves are more likely to make poor decisions that place them at risk for death or severe injury. People exposed to long-term drought are more likely to experience depression, interpersonal violence and thoughts of suicide. People exposed to sea level rise and coastal erosion are more likely to experience anxiety and interpersonal conflict with others in their community.

However, these mental health challenges are perhaps the most overlooked consequences of climate change.

Increasing temperatures and heatwaves, the spread of emerging infectious illnesses, and the widespread concerns about food security in drought-plagued regions of the world all threaten our physical health.

Environmental changes that threaten our livelihoods, access to food, and habitability of our communities lead to widespread unemployment and poverty, civil conflict, and dislocation.


Climate-related disasters have been the number 1 reason for internal displacement in the past decade

An Oxfam report painted a bleak picture of the damage already done

People living in small island developing states are 150X more likely to be displaced by extreme weather than people living in Europe.


Forced from home: climate-fuelled displacement

Pastoralist communities in the Somalia region

Publication date: 2 December 2019
Author: Oxfam

Climate-fuelled disasters were the number one driver of internal displacement over the last decade – forcing an estimated 20 million people a year from their homes. While no one is immune, it is overwhelmingly poor countries that are most at risk. Eighty percent of those displaced in the last decade live in Asia, home to over a third of the world’s poorest people.

Small island developing states make up seven of the 10 countries that face the highest risk of internal displacement as a result of extreme weather events. These communities are 150 times more likely to be displaced by extreme weather disasters than communities in Europe. Countries from Somalia to Guatemala are seeing large numbers of people displaced by both conflict and the climate crisis.

Despite this, the international community has made little progress towards the provision of new funds to help poor countries recover from loss and damage resulting from the climate emergency. As the 2019 UN Climate Summit opens, Oxfam is calling for more urgent and ambitious emissions reductions to minimize the impact of the crisis on people’s lives, and the establishment of a new ‘Loss and Damage’ finance facility to help communities recover and rebuild.


Climate-related disasters: Looking at the numbers

OXFAM

Noaga Oueda in her field of sorghum, in Burkina Faso.

Let’s look at the numbers

30 Y The number of climate-related disasters has tripled in 30 years. By the 2030s, large parts of Southern, Eastern and the Horn of Africa and South and East Asia will experience greater exposure to droughts, floods and tropical storms.
20 M On average, over 20 million people a year were internally displaced by extreme weather disasters over the last 10 years. Eighty percent of those displaced live in Asia – home to over a third of the world’s poorest people.
10 % The richest 10 percent of people in the world produce around half of global emissions. The poorest half of the world’s population – 3.5 billion people – is responsible for just 10 percent of carbon emissions.
100 Just 100 companies are responsible for close to three quarters of global emissions (71 percent) and spend millions lobbying against climate action.
700 $ Between 2008 and 2018, 18 African countries have collectively suffered an annual loss of over 700$ million from climate-related disasters.

December 7, 1941: Memento mori


How CDC Uses Flu Forecasting

https://www.cdc.gov/flu/weekly/flusight/index.html?deliveryName=USCDC_7_3-DM14949

How CDC Forecasts Seasonal Influenza in the U.S.

The timing and severity of influenza in the United States can vary widely from season to season. Flu forecasting aims to predict the characteristics of influenza seasons before disease activity occurs and is captured by the U.S. influenza surveillance system. Since the 2013-2014 flu season, the Influenza Division at CDC has worked with CDC’s Epidemic Prediction Initiative and external researchers to improve the science and usability of flu forecasting, including the coordination of flu forecasting challenges. Recently, these challenges have been extended to the state level.

This page includes information on current and past influenza forecasting efforts, including working with external researchers and the flu season characteristics being forecasted.

Working with External Researches to Predict Flu in the U.S.

Every influenza season since 2013–2014, CDC’s Influenza Division has engaged with members of the scientific community on real-world influenza forecasting challenges known as FluSight. Originally, 11 teams participated, but interest in FluSight has grown in the six years since FluSight’s inception. We anticipate that more than 20 teams will participate during the 2019-2020 flu season.

Each challenge usually runs from late October through mid-May. Teams independently develop their forecasting approaches using a variety of methods and data sources, and teams submit forecasts to CDC on a weekly basis. At the conclusion of each challenge, CDC determines how accurate each team’s forecasts were by scoring forecasts against actual flu activity, announcing an overall winner.

FluSight brings together multiple forecasts and researchers, making real-time forecasts available in one central location and providing structured and standardized assessments of forecast accuracy. Recently, funding was awarded to Carnegie Mellon University and University at Massachusetts Amherst  to further improve the accuracy and communication of influenza forecasts at the national, regional, and state level.

What the Forecasts Aim to Predict

CDC and FluSight partners worked together to develop targets – or the outcome that a forecast is predicting (like season peak) – that would be meaningful to public health. Targets for the main FluSight Challenge at the national level are season onset, peak week, peak intensity, and short-term activity. These target definitions rely on the percent of visits to health-care providers that are for influenza-like illness from the CDC’s U.S. Outpatient ILI Surveillance Network (ILINet).

  • Season onset: The first week when ILINet is at or above baseline and remains there for at least two more weeks
  • Peak week: The week when ILINet is the highest for the whole season (it is possible to have more than one peak week in a given season if two weeks are “tied” for the highest value)
  • Peak intensity: The highest value that ILINet reaches during the season
  • Short-term ILI activity: The ILINet value one, two, three, and four weeks ahead of the date that they are available in FluView.

State-level forecasting efforts are recent, only having been available starting in the 2017-18 season. Some targets in these systems vary from the national-level.

Collaborating After Each Challenge to Understand Forecast Results and Prepare for Next Season

At the end of every forecasting season, CDC, FluSight partners, and stakeholders gather to review forecasting approaches, discuss the accuracy of forecasts from the past season, identity overall challenges and successes and plans for future seasons, such as the additions of new forecasting targets. These meetings improve the usefulness of forecasting by providing the opportunity for collaboration among forecasters and public health officials.

More Resources

Types of Influenza Viruses

CDC https://www.cdc.gov/flu/about/viruses/types.htm?deliveryName=USCDC_7_3-DM14949

illustration and cross section of flu virus

Human Seasonal Influenza Virus

figure 1 - phylogenetic tree , node common acestor, subclade, clade 
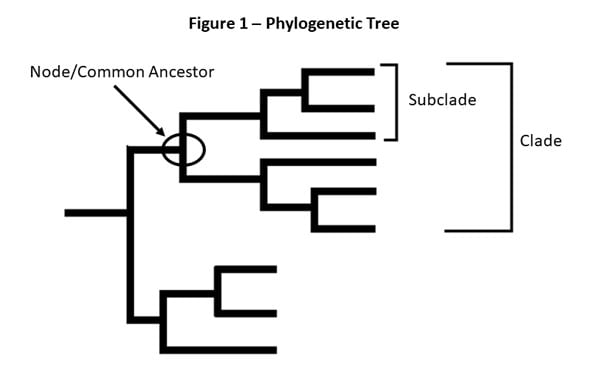
Figure 1 – This is a picture of a phylogenetic tree. In a phylogenetic tree, related viruses are grouped together on branches. Influenza viruses whose HA genes’ share the same genetic changes and who also share a common ancestor (node) are grouped into specific “clades” and “sub clades.” These clades and sub-clades are alternatively sometimes called “groups” and “sub-groups.”


understanding the naming of flu viruses virus type, place virus isolated, strain number, year isolated, virus subtype example a sydney o5 97 (h3n2)

Figure 3 – This image shows how influenza viruses are named. The name starts with the virus type, followed by the place the virus was isolated, followed by the virus strain number, the year isolated, and finally, the virus subtype.


There are four types of influenza viruses: A, B, C and D. Human influenza A and B viruses cause seasonal epidemics of disease (known as the flu season) almost every winter in the United States. Influenza A viruses are the only influenza viruses known to cause flu pandemics, i.e., global epidemics of flu disease. A pandemic can occur when a new and very different influenza A virus emerges that both infects people and has the ability to spread efficiently between people. Influenza type C infections generally cause mild illness and are not thought to cause human flu epidemics. Influenza D viruses primarily affect cattle and are not known to infect or cause illness in people.

Influenza A viruses are divided into subtypes based on two proteins on the surface of the virus: hemagglutinin (H) and neuraminidase (N). There are 18 different hemagglutinin subtypes and 11 different neuraminidase subtypes (H1 through H18 and N1 through N11, respectively). While there are potentially 198 different influenza A subtype combinations, only 131 subtypes have been detected in nature. Current subtypes of influenza A viruses that routinely circulate in people include: A(H1N1) and A(H3N2). Influenza A subtypes can be further broken down into different genetic “clades” and “sub-clades.” See the “Influenza Viruses” graphic below for a visual depiction of these classifications.

Clades and sub-clades can be alternatively called “groups” and “sub-groups,” respectively. An influenza clade or group is a further subdivision of influenza viruses (beyond subtypes or lineages) based on the similarity of their HA gene sequences. (See the Genome Sequencing and Genetic Characterization page for more information). Clades and subclades are shown on phylogenetic trees as groups of viruses that usually have similar genetic changes (i.e., nucleotide or amino acid changes) and have a single common ancestor represented as a node in the tree (see Figure 1). Dividing viruses into clades and subclades allows flu experts to track the proportion of viruses from different clades in circulation.

Note that clades and sub-clades that are genetically different from others are not necessarily antigenically different (i.e., viruses from a specific clade or sub-clade may not have changes that impact host immunity in comparison to other clades or sub-clades).

Currently circulating influenza A(H1N1) viruses are related to the pandemic 2009 H1N1 virus that emerged in the spring of 2009 and caused a flu pandemic (CDC 2009 H1N1 Flu website). This virus, scientifically called the “A(H1N1)pdm09 virus,” and more generally called “2009 H1N1,” has continued to circulate seasonally since then. These H1N1 viruses have undergone relatively small genetic changes and changes to their antigenic properties (i.e., the properties of the virus that affect immunity) over time.

Of all the influenza viruses that routinely circulate and cause illness in people, influenza A(H3N2) viruses tend to change more rapidly, both genetically and antigenically. Influenza A(H3N2) viruses have formed many separate, genetically different clades in recent years that continue to co-circulate.

Influenza B viruses are not divided into subtypes, but instead are further classified into two lineages: B/Yamagata and B/Victoria. Similar to influenza A viruses, influenza B viruses can then be further classified into specific clades and sub-clades. Influenza B viruses generally change more slowly in terms of their genetic and antigenic properties than influenza A viruses, especially influenza A(H3N2) viruses. Influenza surveillance data from recent years shows co-circulation of influenza B viruses from both lineages in the United States and around the world. However, the proportion of influenza B viruses from each lineage that circulate can vary by geographic location.

Naming Influenza Viruses

CDC follows an internationally accepted naming convention for influenza viruses. This convention was accepted by WHO in 1979 and published in February 1980 in the Bulletin of the World Health Organization, 58(4):585-591 (1980) (see A revision of the system of nomenclature for influenza viruses: a WHO Memorandum pdf icon[854 KB, 7 pages]external icon). The approach uses the following components:

  • The antigenic type (e.g., A, B, C, D)
  • The host of origin (e.g., swine, equine, chicken, etc.). For human-origin viruses, no host of origin designation is given. Note the following examples:
    • (Duck example): avian influenza A(H1N1), A/duck/Alberta/35/76
    • (Human example): seasonal influenza A(H3N2), A/Perth/16/2019
  • Geographical origin (e.g., Denver, Taiwan, etc.)
  • Strain number (e.g., 7, 15, etc.)
  • Year of collection (e.g., 57, 2009, etc.)
  • For influenza A viruses, the hemagglutinin and neuraminidase antigen description are provided in parentheses (e.g., influenza A(H1N1) virus, influenza A(H5N1) virus)
  • The 2009 pandemic virus was assigned a distinct name: A(H1N1)pdm09 to distinguish it from the seasonal influenza A(H1N1) viruses that circulated prior to the pandemic.
  • When humans are infected with influenza viruses that normally circulate in swine (pigs), these viruses are call variant viruses and are designated with a letter ‘v’ (e.g., an A(H3N2)v virus).

Influenza Vaccine Viruses

One influenza A(H1N1), one influenza A(H3N2), and one or two influenza B viruses (depending on the vaccine) are included in each season’s influenza vaccines. Getting a flu vaccine can protect against flu viruses that are like the viruses used to make vaccine. Information about this season’s vaccine can be found at Preventing Seasonal Flu with Vaccination. Seasonal flu vaccines do not protect against influenza C or D viruses. In addition, flu vaccines will NOT protect against infection and illness caused by other viruses that also can cause influenza-like symptoms. There are many other viruses besides influenza that can result in influenza-like illness (ILI) that spread during flu season.


Pensacola: Active shooter today


Eliminating measles globally

CDC: https://www.cdc.gov/mmwr/volumes/68/wr/mm6848a1.htm?s_cid=mm6848a1_e&deliveryName=USCDC_921-DM14806

Patel MK, Dumolard L, Nedelec Y, et al. Progress Toward Regional Measles Elimination — Worldwide, 2000–2018. MMWR Morb Mortal Wkly Rep 2019;68:1105–1111. DOI: http://dx.doi.org/10.15585/mmwr.mm6848a1external icon

What is already known about this topic?

In 2012, the World Health Assembly endorsed the Global Vaccine Action Plan; countries in all six World Health Organization regions have adopted goals to eliminate measles by 2020.

What is added by this report?

During 2000–2018, annual reported measles incidence decreased 66%, and annual estimated measles deaths decreased 73%. Since 2000, measles vaccination has prevented an estimated 23.2 million deaths globally. However, measles incidence increased in five regions during 2016–2018.

What are the implications for public health practice?

To achieve regional measles elimination goals, resource commitments are needed to strengthen routine immunization systems, close immunity gaps, and improve case-based surveillance.

The figure consists of three world maps showing reported measles incidence per 1 million population, by country, in the years 2000, 2016, and 2018.

The figure is a bar chart comparing the estimated number of deaths with and without measles vaccination for the years 2000–2018.


Categories

Recent Posts

Archives

Admin