Archive for April, 2016
Japanese rescuers were digging through the rubble of buildings and mud on Saturday to reach dozens believed trapped after a powerful 7.3 magnitude earthquake struck a southern island, killing at least 26 and injuring about a thousand.
Saturday, April 16th, 2016A M7.0 earthquake struck early Saturday morning in Kyushu, the same region a M6.2 quake struck 2 days earlier.
Friday, April 15th, 2016
On April 15, 1912, the Titanic sank off the Newfoundland coast, less than three hours after striking an iceberg. About 1,500 people died.
Friday, April 15th, 2016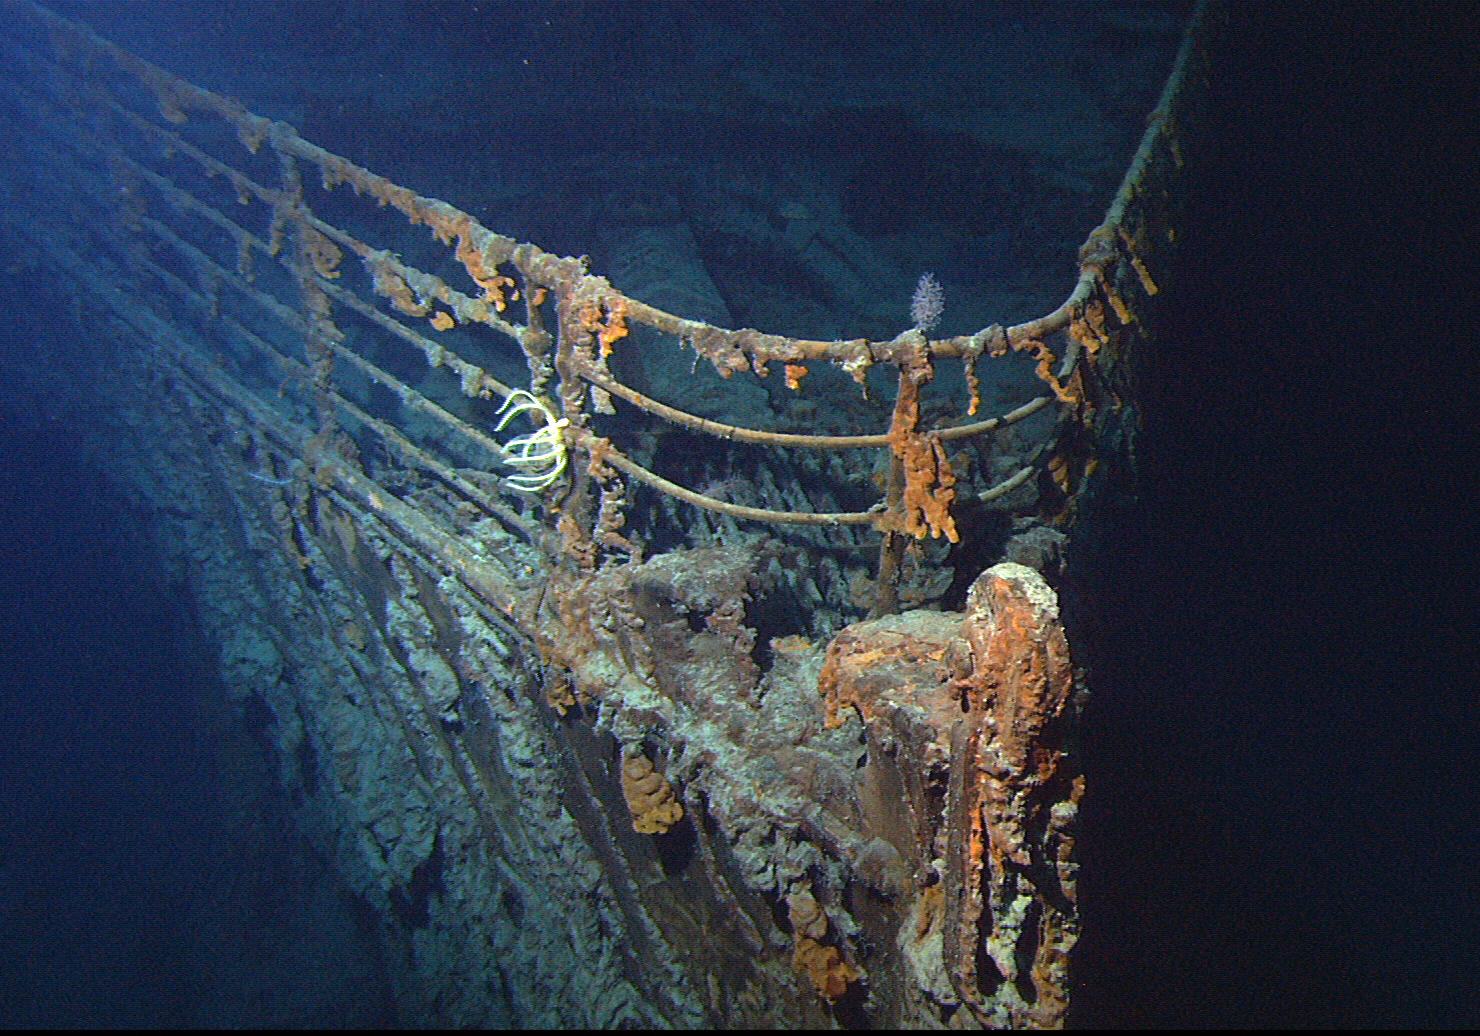
Japan: “…The ground shook for about 20 seconds before the 6.2-magnitude quake stopped…”
Friday, April 15th, 2016** At least 9 dead;
** Nearly 800 people were injured, 50 severely.
** 44,449 people had evacuated.
USGS: Tectonic Summary
The April 14, 2016 M 6.2 earthquake north of Kumamoto, on the island of Kyushu in southwest Japan, occurred as the result of strike-slip faulting at shallow depth. Focal mechanisms for the earthquake indicate slip occurred on either a left-lateral fault striking to the northwest, or on a right-lateral fault striking northeast. While the earthquake occurred several hundred kilometers northwest of the Ryukyu Trench, where the Philippine Sea plate begins its northwestward subduction beneath Japan and the Eurasia plate, the shallow depth and faulting mechanism of this earthquake indicate it occurred on a crustal fault within the upper Eurasia plate. At the location of this event, the Philippine Sea plate converges with Eurasia towards the northwest at a velocity of 58 mm/yr.
Moderate-to-large, shallow earthquakes in Kyushu are infrequent – most seismicity in the region is related to the subduction of the Philippine Sea plate at depth. Thirteen M 5+ earthquakes have occurred at shallow depths (> 50 km) within 100 km of the April 2016 event over the past century. In January and April of 1975, two shallow events with magnitudes of M 5.8 and M 6.1 – 40 km and 65 km to the northwest of the April 2016 earthquake, respectively – caused injuries, but no known fatalities. A shallow M 6.6 earthquake in March 2005, just off the north coast of Kyushu and 110 km north of the April 2016 event, caused over 1000 injuries and at least one fatality.
Mapped faults in the region generally trend east-west or northeast-southwest, in agreement with the right-lateral plane of preliminary focal mechanisms, and the trend of early aftershocks. In the first three hours after the M 6.2 event (12:26:36 UTC), 7 aftershocks have been located, the largest of which is a M 6.0 event at 15:03:47 UTC.
Seismotectonics of the Philippine Sea and Vicinity
The Philippine Sea plate is bordered by the larger Pacific and Eurasia plates and the smaller Sunda plate. The Philippine Sea plate is unusual in that its borders are nearly all zones of plate convergence. The Pacific plate is subducted into the mantle, south of Japan, beneath the Izu-Bonin and Mariana island arcs, which extend more than 3,000 km along the eastern margin of the Philippine Sea plate. This subduction zone is characterized by rapid plate convergence and high-level seismicity extending to depths of over 600 km. In spite of this extensive zone of plate convergence, the plate interface has been associated with few great (M>8.0) ‘megathrust’ earthquakes. This low seismic energy release is thought to result from weak coupling along the plate interface (Scholz and Campos, 1995). These convergent plate margins are also associated with unusual zones of back-arc extension (along with resulting seismic activity) that decouple the volcanic island arcs from the remainder of the Philippine Sea Plate (Karig et al., 1978; Klaus et al., 1992).
South of the Mariana arc, the Pacific plate is subducted beneath the Yap Islands along the Yap trench. The long zone of Pacific plate subduction at the eastern margin of the Philippine Sea Plate is responsible for the generation of the deep Izu-Bonin, Mariana, and Yap trenches as well as parallel chains of islands and volcanoes, typical of circum-pacific island arcs. Similarly, the northwestern margin of the Philippine Sea plate is subducting beneath the Eurasia plate along a convergent zone, extending from southern Honshu to the northeastern coast of Taiwan, manifested by the Ryukyu Islands and the Nansei-Shoto (Ryukyu) trench. The Ryukyu Subduction Zone is associated with a similar zone of back-arc extension, the Okinawa Trough. At Taiwan, the plate boundary is characterized by a zone of arc-continent collision, whereby the northern end of the Luzon island arc is colliding with the buoyant crust of the Eurasia continental margin offshore China.
Along its western margin, the Philippine Sea plate is associated with a zone of oblique convergence with the Sunda Plate. This highly active convergent plate boundary extends along both sides the Philippine Islands, from Luzon in the north to the Celebes Islands in the south. The tectonic setting of the Philippines is unusual in several respects: it is characterized by opposite-facing subduction systems on its east and west sides; the archipelago is cut by a major transform fault, the Philippine Fault; and the arc complex itself is marked by active volcanism, faulting, and high seismic activity. Subduction of the Philippine Sea Plate occurs at the eastern margin of the archipelago along the Philippine Trench and its northern extension, the East Luzon Trough. The East Luzon Trough is thought to be an unusual example of a subduction zone in the process of formation, as the Philippine Trench system gradually extends northward (Hamburger et al., 1983). On the west side of Luzon, the Sunda Plate subducts eastward along a series of trenches, including the Manila Trench in the north, the smaller less well-developed Negros Trench in the central Philippines, and the Sulu and Cotabato trenches in the south (Cardwell et al., 1980). At its northern and southern terminations, subduction at the Manila Trench is interrupted by arc-continent collision, between the northern Philippine arc and the Eurasian continental margin at Taiwan and between the Sulu-Borneo Block and Luzon at the island of Mindoro. The Philippine fault, which extends over 1,200 km within the Philippine arc, is seismically active. The fault has been associated with major historical earthquakes, including the destructive M7.6 Luzon earthquake of 1990 (Yoshida and Abe, 1992). A number of other active intra-arc fault systems are associated with high seismic activity, including the Cotabato Fault and the Verde Passage-Sibuyan Sea Fault (Galgana et al., 2007).
Relative plate motion vectors near the Philippines (about 80 mm/yr) is oblique to the plate boundary along the two plate margins of central Luzon, where it is partitioned into orthogonal plate convergence along the trenches and nearly pure translational motion along the Philippine Fault (Barrier et al., 1991). Profiles B and C reveal evidence of opposing inclined seismic zones at intermediate depths (roughly 70-300 km) and complex tectonics at the surface along the Philippine Fault.
Several relevant tectonic elements, plate boundaries and active volcanoes, provide a context for the seismicity presented on the main map. The plate boundaries are most accurate along the axis of the trenches and more diffuse or speculative in the South China Sea and Lesser Sunda Islands. The active volcanic arcs (Siebert and Simkin, 2002) follow the Izu, Volcano, Mariana, and Ryukyu island chains and the main Philippine islands parallel to the Manila, Negros, Cotabato, and Philippine trenches.
Seismic activity along the boundaries of the Philippine Sea Plate (Allen et al., 2009) has produced 7 great (M>8.0) earthquakes and 250 large (M>7) events. Among the most destructive events were the 1923 Kanto, the 1948 Fukui and the 1995 Kobe (Japan) earthquakes (99,000, 5,100, and 6,400 casualties, respectively), the 1935 and the 1999 Chi-Chi (Taiwan) earthquakes (3,300 and 2,500 casualties, respectively), and the 1976 M7.6 Moro Gulf and 1990 M7.6 Luzon (Philippines) earthquakes (7,100 and 2,400 casualties, respectively). There have also been a number of tsunami-generating events in the region, including the Moro Gulf earthquake, whose tsunami resulted in more than 5000 deaths.
Induced Earthquakes Raise Chances of Damaging Shaking in 2016
Friday, April 15th, 2016
For the first time, new USGS maps identify potential ground-shaking hazards from both human-induced and natural earthquakes. In the past, USGS maps only identified natural earthquake hazards.
This is also the first one-year outlook for the nation’s earthquake hazards, and is a supplement to existing USGS assessments that provide a 50-year forecast
The report shows that approximately 7 million people live and work in areas of the central and eastern U.S. (CEUS) with potential for damaging shaking from induced seismicity. Within a few portions of the CEUS, the chance of damage from all types of earthquakes is similar to that of natural earthquakes in high-hazard areas of California.
“By including human-induced events, our assessment of earthquake hazards has significantly increased in parts of the U.S.,” said Mark Petersen, Chief of the USGS National Seismic Hazard Mapping Project. “This research also shows that much more of the nation faces a significant chance of having damaging earthquakes over the next year, whether natural or human-induced.”
Induced earthquakes are triggered by human activities, with wastewater disposal being the primary cause for recent events in many areas of the CEUS. Wastewater from oil and gas production operations can be disposed of by injecting it into deep underground wells, below aquifers that provide drinking water.
Important Note: USGS scientists only distinguished between human-induced and natural seismicity in the CEUS. In the west, scientists categorized all earthquakes as natural. Scientists also used a different methodology in looking at the CEUS compared to the west.

USGS map displaying potential to experience damage from a natural or human-induced earthquake in 2016. Chances range from less than one percent to 12 percent.
Six States Face the Highest Hazards
The most significant hazards from induced seismicity are in six states, listed in order from highest to lowest potential hazard: Oklahoma, Kansas, Texas, Colorado, New Mexico and Arkansas. Oklahoma and Texas have the largest populations exposed to induced earthquakes.
“In the past five years, the USGS has documented high shaking and damage in areas of these six states, mostly from induced earthquakes,” said Petersen. “Furthermore, the USGS Did You Feel It? website has archived tens of thousands of reports from the public who experienced shaking in those states, including about 1,500 reports of strong shaking or damage.”
In developing this new product, USGS scientists identified 21 areas with increased rates of induced seismicity. Induced earthquakes have occurred within small areas of Alabama and Ohio but a recent decrease in induced earthquake activity has resulted in a lower hazard forecast in these states for the next year. In other areas of Alabama and small parts of Mississippi, there has been an increase in activity, and scientists are still investigating whether those events were induced or natural.
People living in areas of higher earthquake hazard should learn how to be prepared for earthquakes, and guidance can be found through FEMA’s Ready Campaign.

USGS map displaying 21 areas where scientists have observed rapid changes in seismicity that have been associated with wastewater injection. The map also shows earthquakes—both natural and induced—recorded from 1980 to 2015 in the central and eastern U.S. with a magnitude greater than or equal to 2.5.
One-Year Outlook: The Nation’s Shortest Forecast Yet
The new hazard model estimates where, how often and how strongly earthquake ground shaking could occur in the United States during calendar year 2016. The USGS chose this short timeframe of one year because induced earthquake activity can increase or decrease with time and is subject to commercial and policy decisions that could change rapidly.
The USGS National Seismic Hazard Map uses a 50-year forecast because that is the average lifetime of a building, and such information is essential to engineering design and the development of building codes. Building code committees are still determining whether it is appropriate to treat induced earthquakes in building code revisions, in part because induced seismicity changes on short time scales compared to the years it takes for building codes to be updated, reviewed and adopted.
How Will This Help Protect Communities?
The new report can be used by both government officials to make more informed decisions and by emergency response personnel to assess vulnerability and provide safety information to those who are in potential danger. Engineers can use this product to evaluate earthquake safety of buildings, bridges, pipelines and other important structures.
Dramatic Change in the Central U.S.
The central U.S. has undergone the most dramatic increase in seismicity over the past six years. From 1973 to 2008, there was an average of 24 earthquakes of magnitude 3.0 and larger per year. From 2009 to 2015, the rate steadily increased, averaging 318 per year and peaking in 2015 with 1,010 earthquakes. Through mid-March in 2016, there have been 226 earthquakes of magnitude 3.0 and larger in the central U.S. region. To date, the largest earthquake located near several active injection wells was a magnitude 5.6 in 2011 near Prague, Oklahoma.
Research in the Western U.S.
The CEUS has experienced the most significant U.S. increase in seismic activity due to induced earthquakes in recent years. Therefore, in the 2016 forecast, scientists distinguish between human-induced and natural seismicity only for the CEUS. Scientists also used a historical catalog of seismic events leading back to the 1700s, putting a strong emphasis on earthquakes in 2015.
While there are some areas of induced earthquakes in the western U.S., they don’t significantly change the regional hazard level compared to the much more abundant natural earthquakes. Therefore scientists just considered the historical catalog in the western U.S. and did not separate natural from induced earthquakes. Future research could take a more detailed look at induced seismicity in the west, including in California at The Geysers, Brawley or the Los Angeles Basin.
Explanation of Updates — Mostly, But Not All, Are Induced
The USGS published a study in 2014 that only considered natural earthquakes. The largest changes in this new report are primarily due to hazards from induced earthquakes, but the calculations also consider updated forecasts for natural earthquakes since the previous hazard map was released. For example, the New Madrid Seismic Zone near Memphis has experienced a higher rate of natural earthquakes in the past two years, leading to a slightly higher hazard potential in small portions of Arkansas, Missouri, Illinois, Kentucky and Tennessee.
Wastewater disposal is thought to be the primary reason for the recent increase in earthquakes in the CEUS. While most injection wells are not associated with earthquakes, some other wells have been implicated in published scientific studies, and many states are now regulating wastewater injection in order to limit earthquake hazards.
Many questions have been raised about hydraulic fracturing—commonly referred to as “fracking”—and USGS studies suggest that this process is only rarely the cause of felt earthquakes.
Learn more by reading six facts and common questions about human-caused earthquakes.
Distinguishing Between Induced and Natural Earthquakes
To determine whether particular clusters of earthquakes were natural or induced, the USGS relied on published literature and discussions with state officials and the scientific and earthquake engineering community. Scientists looked at factors such as whether an earthquake occurred near a wastewater disposal well and whether the well was active at the time these earthquakes occurred. If so, it was classified as an induced event.
Current research indicates that the maximum magnitudes of induced earthquakes may be lower than for natural earthquakes, but many scientists suggest that induced earthquakes can trigger larger earthquakes on known or unknown faults. In the CEUS, there may be thousands of faults that could rupture in a large earthquake. Induced earthquakes also tend to exhibit swarm-like behavior with more numerous and smaller earthquakes at shallower depths. These factors were taken into account in the analysis.
Testing and Future Research
“We are using the best available data and principles to determine when, where and how strong the ground could shake from induced earthquakes,” said Petersen. “Of course there is a level of uncertainty associated with this and all hazard maps, as we are still learning about their behavior and can only forecast with probability—instead of predict with certainty—where earthquakes are likely to occur in the future. Testing these maps after a year will be important in validating and improving the models.”
USGS Science
The USGS is the only federal agency with responsibility for recording and reporting earthquake activity nationwide and assessing seismic hazard. These maps are part of USGS contributions to the National Earthquake Hazards Reduction Program, which is a congressionally established partnership of four federal agencies with the purpose of reducing risks to life and property in the United States that result from earthquakes.
Japan: An 6.2M earthquake on Thursday, brought down some buildings, killed at least 2 and injuring hundreds, but no problems reported at the nuclear power plants.
Thursday, April 14th, 2016


Saudia Arabia has now confirmed 1,374 cases since the outbreak began in 2012, including 587 fatalities.
Thursday, April 14th, 2016
Microcephaly and Other Birth Defects & Zika: Cause and Effect
Thursday, April 14th, 2016CDC Concludes Zika Causes Microcephaly and Other Birth Defects
Media Statement
For Immediate Release: Wednesday, April 13, 2016
Contact: Media Relations,
(404) 639-3286
Scientists at the Centers for Disease Control and Prevention (CDC) have concluded, after careful review of existing evidence, that Zika virus is a cause of microcephaly and other severe fetal brain defects. In the report published in the New England Journal of Medicine, the CDC authors describe a rigorous weighing of evidence using established scientific criteria.
“This study marks a turning point in the Zika outbreak. It is now clear that the virus causes microcephaly. We are also launching further studies to determine whether children who have microcephaly born to mothers infected by the Zika virus is the tip of the iceberg of what we could see in damaging effects on the brain and other developmental problems,” said Tom Frieden, M.D., M.P.H., director of the CDC. “We’ve now confirmed what mounting evidence has suggested, affirming our early guidance to pregnant women and their partners to take steps to avoid Zika infection and to health care professionals who are talking to patients every day. We are working to do everything possible to protect the American public.”
Background
The report notes that no single piece of evidence provides conclusive proof that Zika virus infection is a cause of microcephaly and other fetal brain defects. Rather, increasing evidence from a number of recently published studies and a careful evaluation using established scientific criteria supports the authors’ conclusions.
The finding that Zika virus infection can cause microcephaly and other severe fetal brain defects means that a woman who is infected with Zika during pregnancy has an increased risk of having a baby with these health problems. It does not mean, however, that all women who have Zika virus infection during pregnancy will have babies with problems. As has been seen during the current Zika outbreak, some infected women have delivered babies that appear to be healthy.
Establishing this causal relationship between Zika and fetal brain defects is an important step in driving additional prevention efforts, focusing research activities, and reinforcing the need for direct communication about the risks of Zika. While one important question about causality has been answered, many questions remain. Answering these will be the focus of ongoing research to help improve prevention efforts, which ultimately may help reduce the effects of Zika virus infection during pregnancy.
At this time, CDC is not changing its current guidance as a result of this finding. Pregnant women should continue to avoid travel to areas where Zika is actively spreading. If a pregnant woman travels to or lives in an area with active Zika virus transmission, she should talk with her healthcare provider and strictly follow steps to prevent mosquito bites and to prevent sexual transmission of Zika virus. We also continue to encourage women and their partners in areas with active Zika transmission to engage in pregnancy planning and counseling with their health care providers so that they know the risks and the ways to mitigate them.
CDC: The Zika virus DOES cause microcephaly and other birth defects
Thursday, April 14th, 2016“….Based on all of the available evidence, the CDC said two separate sets of criteria to determine a pathogen or environmental exposure causes a birth defect have been met…..”