Archive for the ‘NASA’ Category
NASA: Tropical Cyclone Maha
Tuesday, November 12th, 2019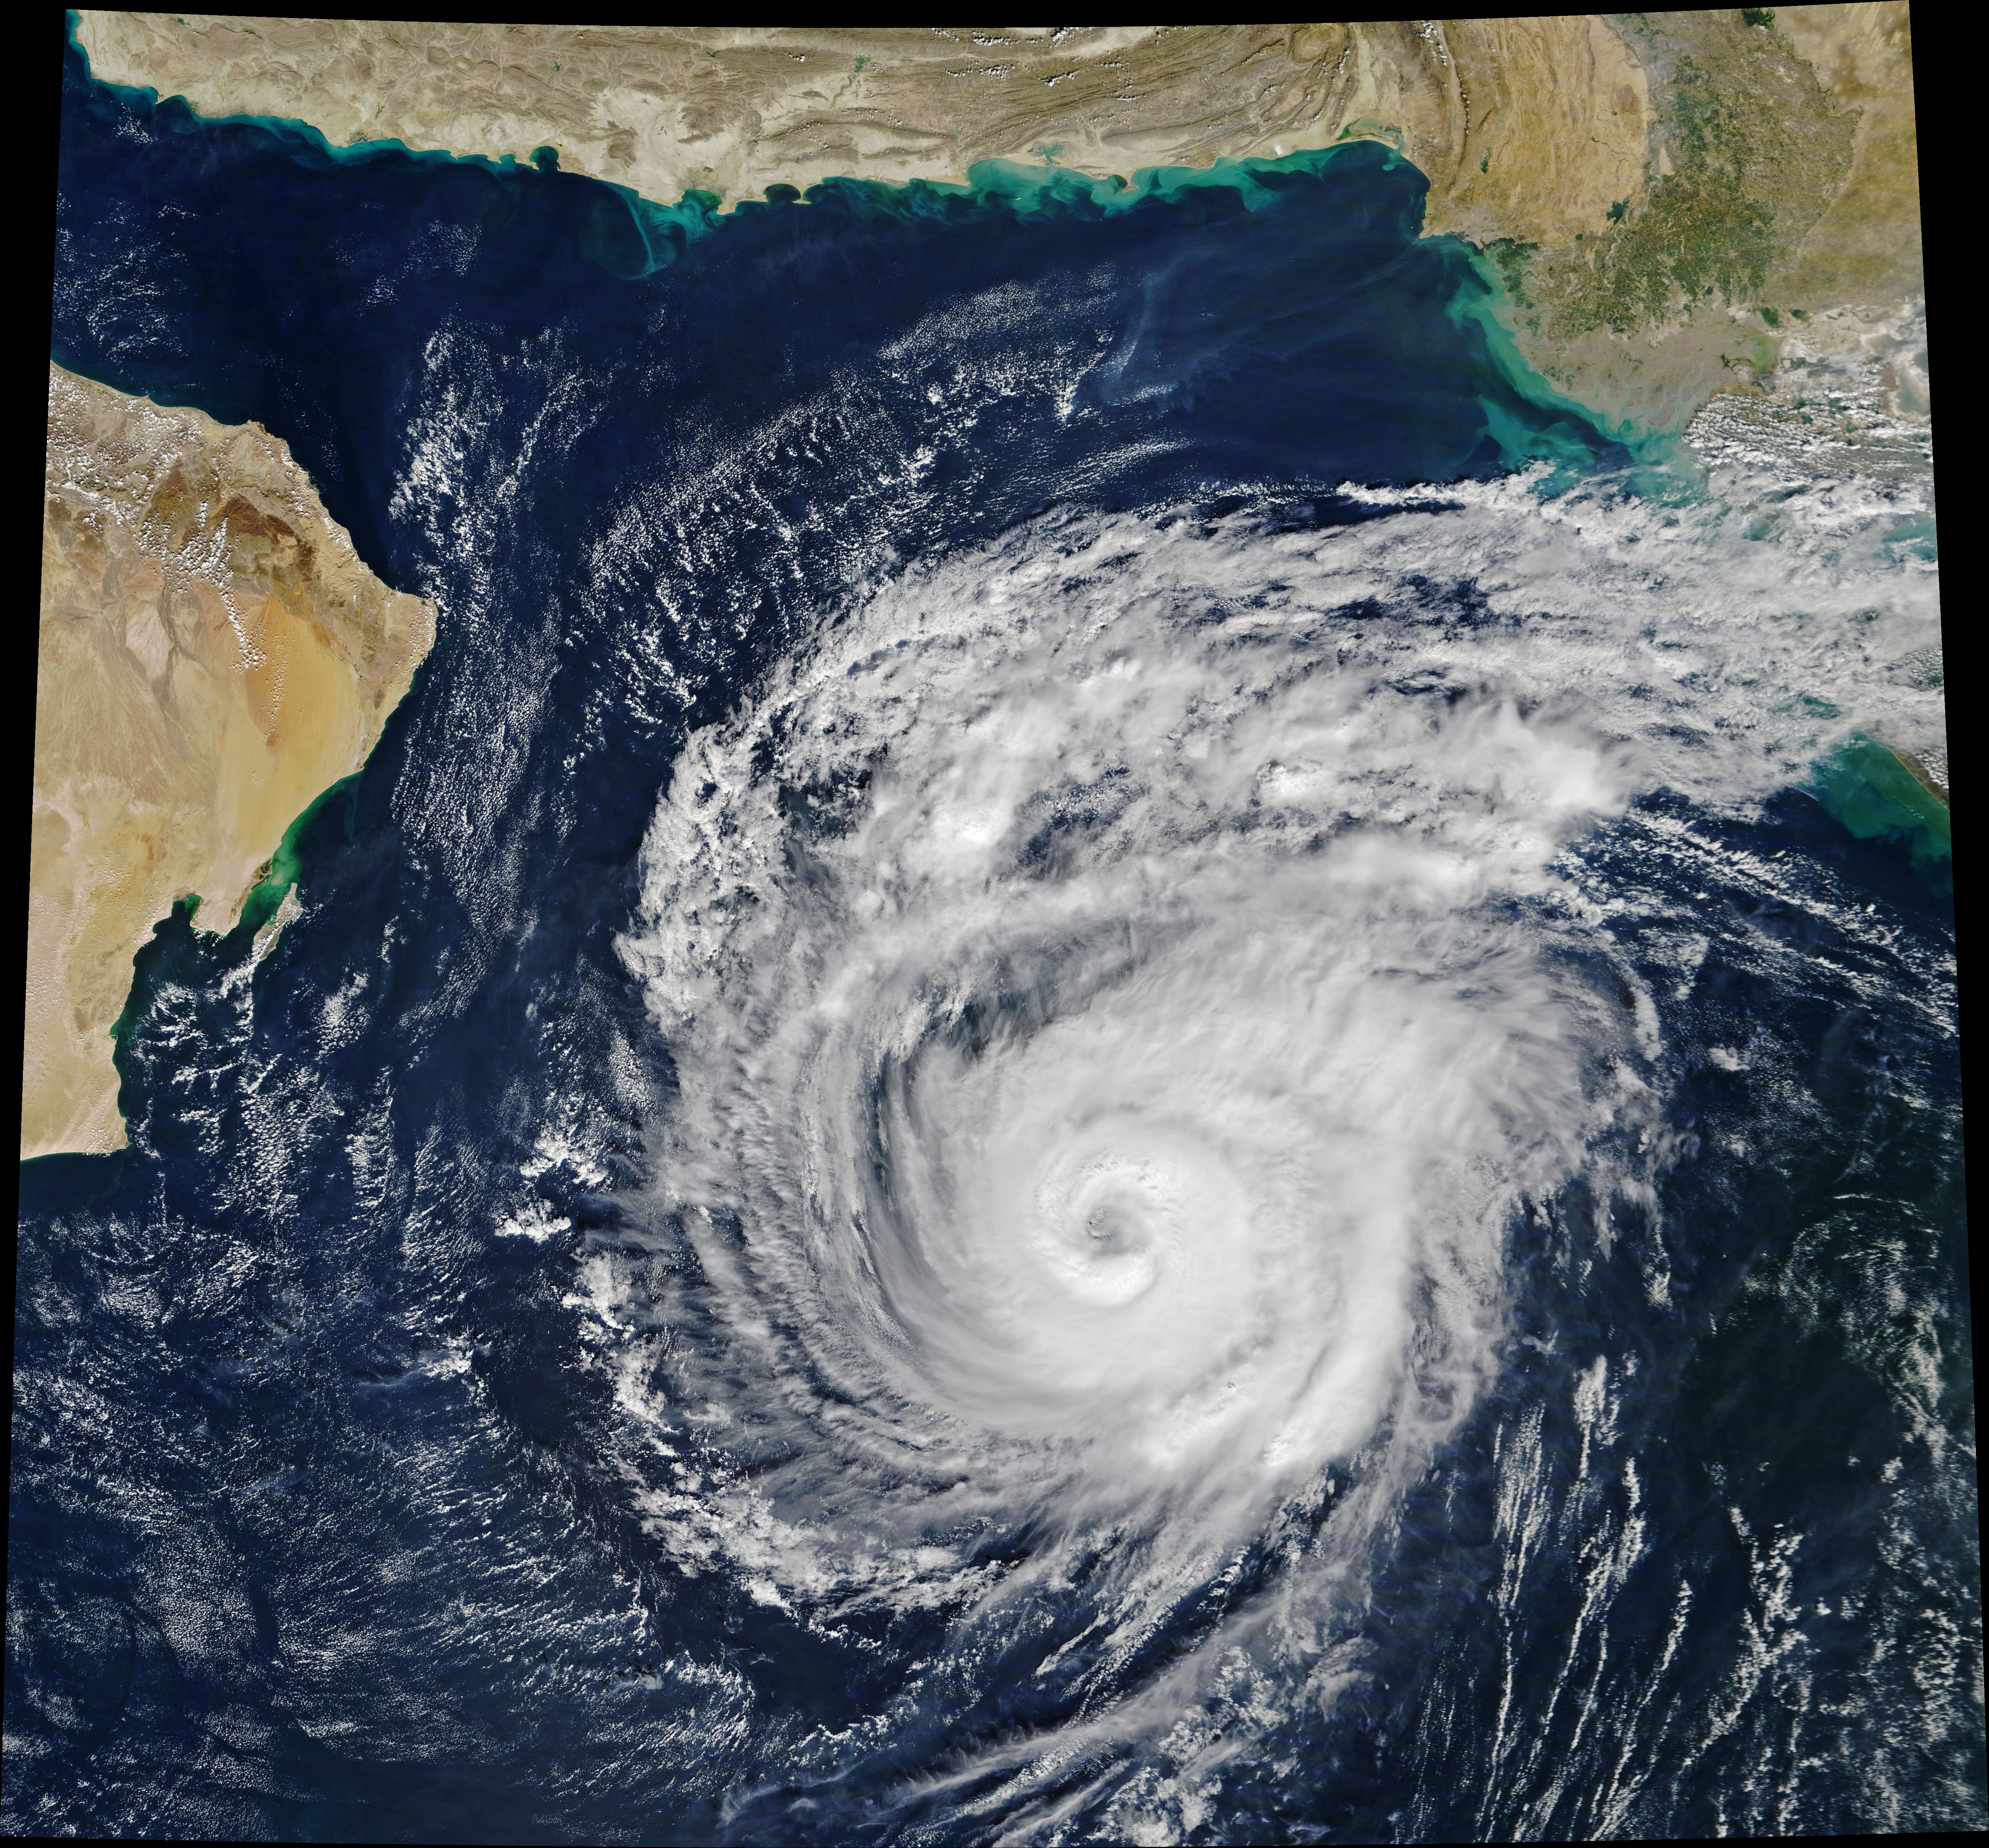
Tropical Cyclone Maha has taken a sharp turn over the Arabian Sea and is now poised to brush India’s west coast on November 7, 2019. By landfall, forecasters expect the storm to have weakened from its extremely severe peak on November 4, which was when the Moderate Resolution Imaging Spectroradiometer (MODIS) on NASA’s Terra satellite acquired this natural-color image. At the time, sustained winds measured 185 kilometers (115 miles) per hour—the equivalent of a category 3 storm on the Saffir-Simpson wind scale.
Considered in isolation, there’s nothing particularly unusual about Maha. However, in the context of the season and the basin, it is the latest in a series of strong tropical cyclones in an area that typically doesn’t see many. In fact, the North Indian basin is usually the least active in the Northern Hemisphere.
The California wildfires as seen from Outer Space
Thursday, October 31st, 2019TODAY: NOAA's #GOES17, from 22,300 miles in space, captures the thick smoke plumes streaming from the massive #KincadeFire. @NWS: "Potentially historic fire weather conditions expected in the northern Bay Area."
#CaliforniaFires #CaWx #CAFireWX pic.twitter.com/u4Aqxwhr3k— NOAA Satellites – Public Affairs (@NOAASatellitePA) October 27, 2019
The explosive growth of the #KincadeFire, which now covers more than 75,000 acres, is visible in this Fire Temperature RGB imagery from #GOESWest. Extremely critical #FireWeather conditions are forecast to persist across parts of #California into Thursday. https://t.co/DqzXks1jS5 pic.twitter.com/nVwbogsAai
— NOAA Satellites (@NOAASatellites) October 29, 2019
NASA & Hurricane Dorian from Outer Space
Sunday, September 1st, 2019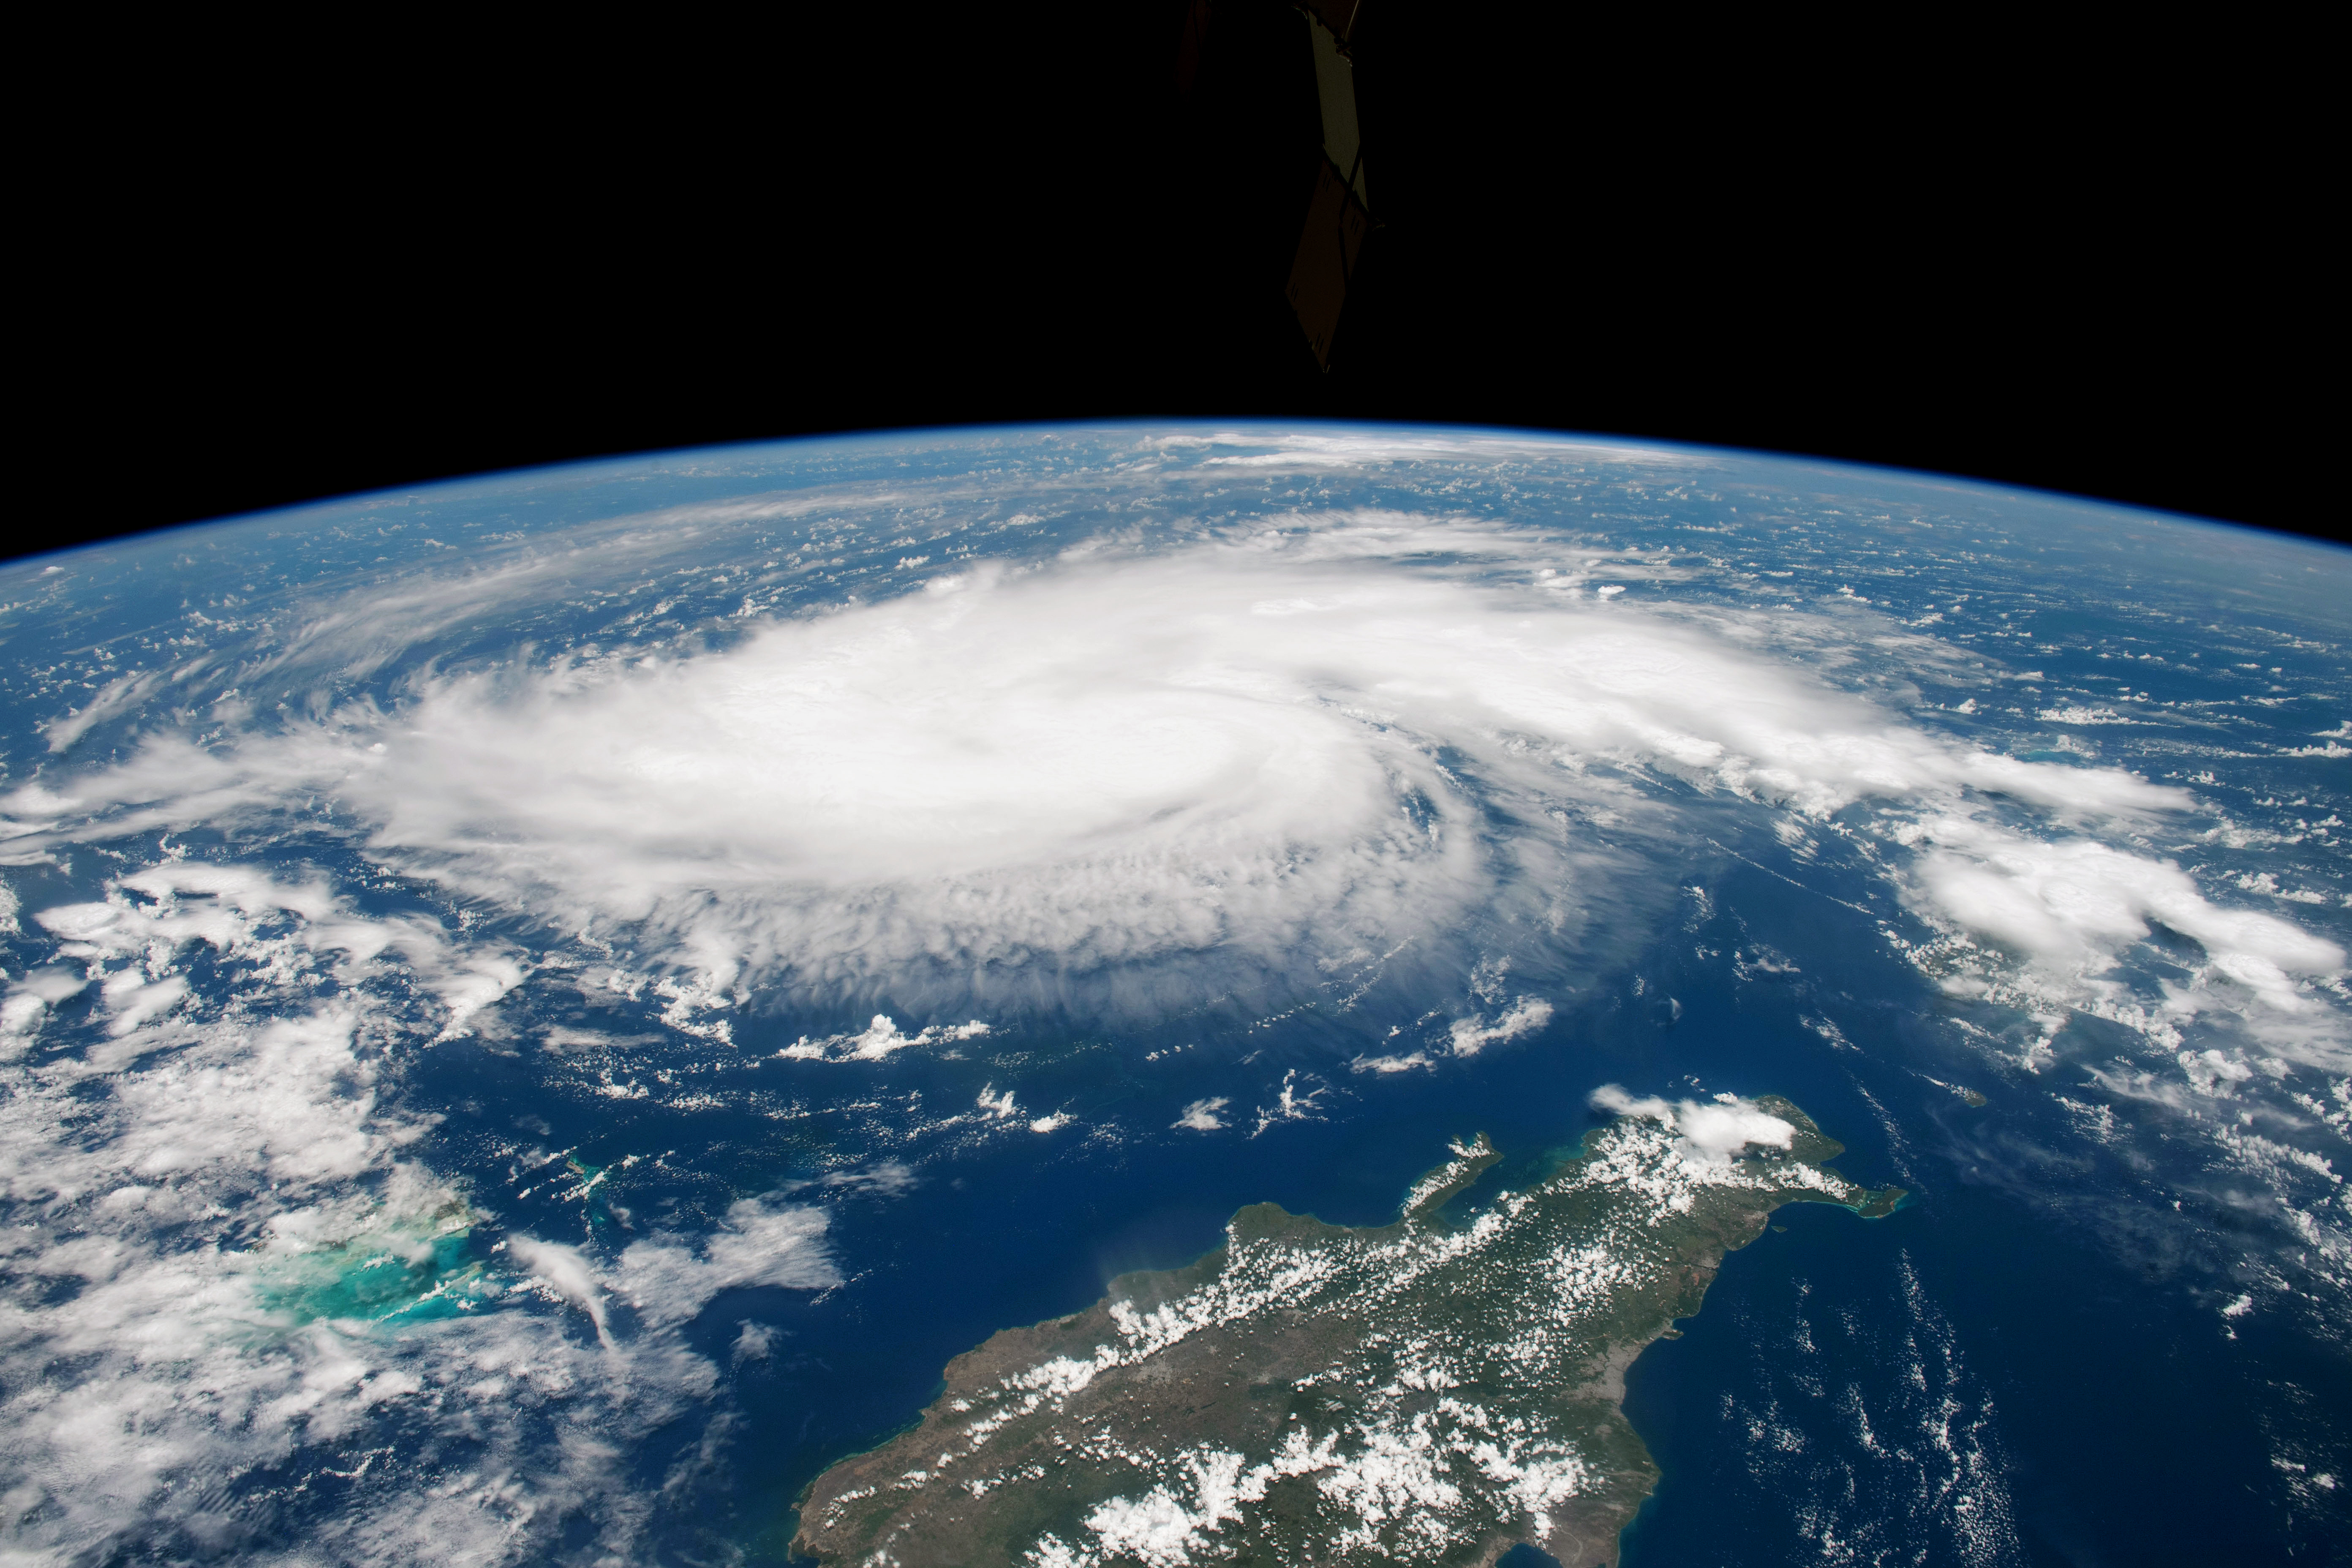
Heading into the Labor Day holiday weekend in United States, citizens and government officials braced for a potent hurricane that has been intensifying in the tropical Atlantic Ocean. By the afternoon of August 30, 2019, Hurricane Dorian had reached category 3 intensity and was headed for the northern Bahamas and the east coast of Florida as a major hurricane, the first of the 2019 Atlantic season.
The photograph above was shot by an astronaut on the International Space Station at 11:12 a.m. Atlantic Standard Time (17:12 Universal Time) on August 29, 2019. At that time Dorian had maximum sustained winds of 85 miles (135 kilometers) per hour and a central pressure of 986 millibars, according to the National Hurricane Center. As of 2 p.m. AST (18:00 UT) on August 30, the center of the storm was about 445 miles (715 kilometers) east of the northwestern Bahamas and 625 miles (1005 kilometers) east of West Palm Beach, Florida. Sustained winds were measured at 115 mph (185 kmph) and the minimum central pressure was 970 millibars.
A key factor in the development of a hurricane is the warmth of the ocean surface. Warm water is the fuel that leads a storm to intensify, as heat and moisture move from the ocean to the atmosphere. This map above shows sea surface temperatures (SSTs) in the western Atlantic as of August 28, as well as population density in the U.S. Southeast and several Caribbean islands. Meteorologists generally agree that SSTs should be above 27.8°Celsius (82°Fahrenheit) to sustain and intensify hurricanes (although there are some exceptions).
The data for the map come from the MUR Global Foundation Sea Surface Temperature Analysis, produced at NASA’s Jet Propulsion Laboratory. It is based on observations from several satellite instruments, including the NASA Advanced Microwave Scanning Radiometer-EOS (AMSRE), the Moderate Resolution Imaging Spectroradiometer (MODIS) on the NASA Aqua and Terra platforms, the U.S. Navy microwave WindSat radiometer, the Advanced Very High Resolution Radiometer (AVHRR) on several NOAA satellites, and on in situ SST observations from NOAA. Population data come from the Socioeconomic Data and Applications Center (SEDAC).
NHC Forecasters reported on August 30: “Life-threatening storm surge and devastating hurricane-force winds are likely in portions of the northwestern Bahamas, where a hurricane watch is in effect…A prolonged period of storm surge, high winds and rainfall is likely in portions of Florida into next week, including the possibility of hurricane-force winds over inland portions of the Florida peninsula.”
NASA Earth Observatory images by Joshua Stevens and Lauren Dauphin, using MUR Global Foundation Sea Surface Temperature Analysis data from the Physical Oceanography Distributed Active Archive Center (PODAAC) at NASA/JPL, and population data from the Socioeconomic Data and Applications Center (SEDAC). Astronaut photograph ISS060-E-47508 was acquired on August 29, 2019, with a Nikon D5 digital camera using a 28 millimeter lens and is provided by the ISS Crew Earth Observations Facility and the Earth Science and Remote Sensing Unit, Johnson Space Center. The image was taken by a member of the Expedition 60 crew. The image has been cropped and enhanced to improve contrast, and lens artifacts have been removed. Story by Michael Carlowicz.
Raikoke Volcano on the Kuril Islands rarely erupts. The small, oval-shaped island most recently exploded in 1924 and in 1778. The dormant period ended around 4:00 a.m. local time on June 22, 2019
Thursday, June 27th, 2019
A thick plume of volcanic ash rises above the dense cloud cover in this close-up #Himawari8 view of the #Raikoke volcano's eruption. This was the volcano's first eruption since 1924. More imagery: https://t.co/wIF4txQIDW pic.twitter.com/vZExba5QDZ
— NOAA Satellites (@NOAASatellites) June 24, 2019
Unlike some of its perpetually active neighbors on the Kamchatka Peninsula, Raikoke Volcano on the Kuril Islands rarely erupts. The small, oval-shaped island most recently exploded in 1924 and in 1778.
The dormant period ended around 4:00 a.m. local time on June 22, 2019, when a vast plume of ash and volcanic gases shot up from its 700-meter-wide crater. Several satellites—as well as astronauts on the International Space Station—observed as a thick plume rose and then streamed east as it was pulled into the circulation of a storm in the North Pacific.
On the morning of June 22, astronauts shot a photograph (above) of the volcanic plume rising in a narrow column and then spreading out in a part of the plume known as the umbrella region. That is the area where the density of the plume and the surrounding air equalize and the plume stops rising. The ring of clouds at the base of the column appears to be water vapor.
“What a spectacular image. It reminds me of the classic Sarychev Peak astronaut photograph of an eruption in the Kuriles from about ten years ago,” said Simon Carn, a volcanologist at Michigan Tech. “The ring of white puffy clouds at the base of the column might be a sign of ambient air being drawn into the column and the condensation of water vapor. Or it could be a rising plume from interaction between magma and seawater because Raikoke is a small island and flows likely entered the water.”
The Moderate Resolution Imaging Spectroradiometer (MODIS) on NASA’s Terra satellite acquired the second image on the morning of June 22. At the time, the most concentrated ash was on the western edge of the plume, above Raikoke. The third image, an oblique, composite view based on data from the Visible Infrared Imaging Radiometer Suite (VIIRS) on Suomi NPP, shows the plume a few hours later. After an initial surge of activity that included several distinct explosive pulses, activity subsided and strong winds spread the ash across the Pacific. By the next day, just a faint remnant of the ash remained visible to MODIS.
Since ash contains sharp fragments of rock and volcanic glass, it poses a serious hazard to aircraft. The Tokyo and Anchorage Volcanic Ash Advisory Centers have been tracking the plume closely and have issued several notes to aviators indicating that ash had reached an altitude of 13 kilometers (8 miles). Meanwhile, data from the CALIPSO satellite indicate that parts of the plume may have reached 17 kilometers (10 miles).
In addition to tracking ash, satellite sensors can also track the movements of volcanic gases. In this case, Raikoke produced a concentrated plume of sulfur dioxide (SO2) that separated from the ash and swirled throughout the North Pacific as the plume interacted with the storm.
“Radiosonde data from the region indicate a tropopause altitude of about 11 kilometers, so altitudes of 13 to 17 kilometers suggest that the eruption cloud is mostly in the stratosphere,” said Carn. “The persistence of large SO2 amounts over the last two days also indicates stratospheric injection.”
Volcanologists watch closely for plumes that reach the stratosphere because they tend to stay aloft for longer than those that remain within the troposphere. That is why plumes that reaches the stratosphere typically have the greatest effects on aviation and climate.
NASA Earth Observatory images by Joshua Stevens, using MODIS and VIIRS data from NASA EOSDIS/LANCE and GIBS/Worldview and the Suomi National Polar-orbiting Partnership. Astronaut photograph ISS059-E-119250 was acquired on June 22, 2019, with a Nikon D5 digital camera and is provided by the ISS Crew Earth Observations Facility and the Earth Science and Remote Sensing Unit, Johnson Space Center. The image was taken by a member of the Expedition 59 crew. The image has been cropped and enhanced to improve contrast, and lens artifacts have been removed. Story by Adam Voiland, with information from Erik Klemetti (Denison University), Simon Carn (Michigan Tech), and Andrew Prata (Barcelona Supercomputing Center).
NASA: 2018 was Fourth Warmest Year in Continued Warming Trend
Friday, February 8th, 2019


According to an ongoing temperature analysis conducted by scientists at NASA’s Goddard Institute for Space Studies, the average global temperature on Earth has increased by about 0.8° Celsius (1.4° Fahrenheit) since 1880. Two-thirds of the warming has occurred since 1975, at a rate of roughly 0.15-0.20°C per decade.
NASA: Camp Fire Photos from Space
Sunday, November 11th, 2018
11/8/18
On November 8, 2018, the Camp Fire erupted 90 miles (140 kilometers) north of Sacramento, California. As of 10 a.m. Pacific Standard Time on November 9, the fire had consumed 70,000 acres of land and was five percent contained, or surrounded by a barrier.
The Operational Land Imager on Landsat 8 acquired this image on November 8, 2018, around 10:45 a.m. local time (18:45 Universal Time). The image was created using Landsat bands 4-3-2 (visible light), along with shortwave-infrared light to highlight the active fire. The fire started around 6:30 a.m. Pacific Standard Time, and by 8:00 p.m., it had burned 20,000 acres of land.
11/9/18
Strong winds pushed the fire to the south and southwest overnight, tripling its size and spreading smoke over the Sacramento Valley. The Moderate Resolution Imaging Spectrometer (MODIS) on NASA’s Terra satellite captured the natural-color image above on November 9. The High-Resolution Rapid Refresh Smoke model, using data from National Oceanic and Atmospheric Administration (NOAA) and NASA satellites, shows the smoke should continue to spread west. The image also shows two more fires in southern California, the Hill and Woolsey Fires.
More than 2,000 personnel have been sent to fight the Camp Fire, which is predicted to be fully contained by November 30. Firefighters are having difficulty containing it due to strong winds, which fan the flames and carry burning vegetation downwind. The area also has heavy and dry fuel loads, or flammable material.
State and local officials have closed several major highways, including portions of Highway 191. They also ordered evacuations in several towns, including Concow and Paradise, where the fatal fire burned through the town.
NASA Earth Observatory image by Joshua Stevens, using Landsat data from the U.S. Geological Survey, and MODIS data from NASA EOSDIS/LANCE and GIBS/Worldview. Story by Kasha Patel.
NASA: Florida Slammed by Hurricane Michael
Friday, October 12th, 2018
At approximately 1:30 p.m. Eastern Daylight Time (17:30 Universal Time) on October 10, 2018, Hurricane Michael made landfall near Mexico Beach, Florida. Wind speeds were estimated to be 155 miles (250 kilometers) per hour, which would make the category 4 hurricane the strongest on record to hit the Florida Panhandle. The storm has already destroyed homes and knocked out electric power in the area. Forecasters expect Michael to bring heavy winds and rain to the southeastern United States for several days.
The Geostationary Operational Environmental Satellite 16 (GOES-16) acquired data for the composite images above around 1 p.m. Eastern Time on October 10. GOES-16 data (band 2) were overlaid on a MODIS “blue marble.” GOES-16 is operated by the National Oceanic and Atmospheric Administration (NOAA); NASA helps develop and launch the GOES series of satellites.
The National Weather Service office in Tallahassee issued an extreme wind warning as the storm approached. Forecasters were expecting large storm surges—rising seawater that moves inland as it is pushed onshore by hurricane-force winds. The worst surges were expected to inundate areas between Tyndall Air Force Base and Keaton Beach with 9 to 14 feet of water on October 10.
As the storm moves inland, forecasters expect life-threatening winds to also affect parts of Alabama and Georgia. Areas as far as southeastern Virginia could see several inches over the next three days. North Carolina has declared a state of emergency as the storm forecast has it passing over areas that were affected by Hurricane Florence last month.
NASA Earth Observatory images by Joshua Stevens, using data from GOES-16. Story by Kasha Patel.