Archive for the ‘Influenza’ Category
Weekly U.S. Influenza Surveillance Report: Key Updates for Week 49, ending December 7, 2019
Friday, December 13th, 2019Viruses
11.3% of respiratory specimens tested by clinical laboratories were positive for influenza viruses. This is higher than the previous week.
Nationally, B/Victoria viruses are most common followed by A(H1N1)pdm09 and A(H3N2) viruses. The predominant virus varies by region and age group.
Genetic and antigenic characterization and antiviral susceptibility of viruses collected in the U.S. this season are now being reported.
Illness
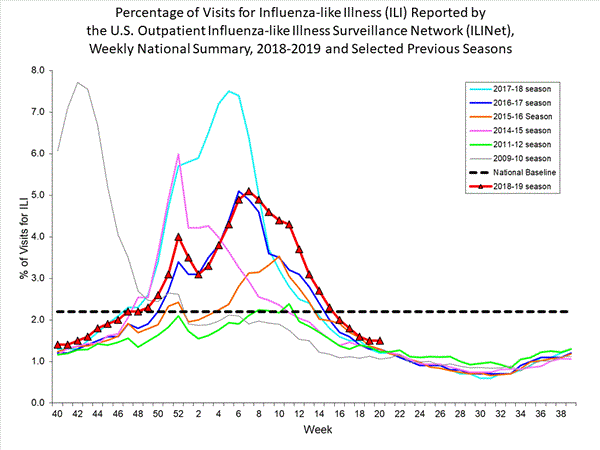
3.2% of visits to health care providers were for influenza-like illness (ILI). ILI has been at or above the national baseline of 2.4% for five weeks. All regions were at or above their baselines.
The number of jurisdictions experiencing high ILI activity decreased to 12 this week compared to 13 last week. In addition, 12 jurisdictions had moderate activity compared to 15 last week.
The number of jurisdictions reporting regional or widespread activity increased to 38 this week from 30 last week.
Severe Disease
The overall hospitalization rate for the season is 3.9 per 100,000. This is similar to what has been seen at this time during other recent seasons.
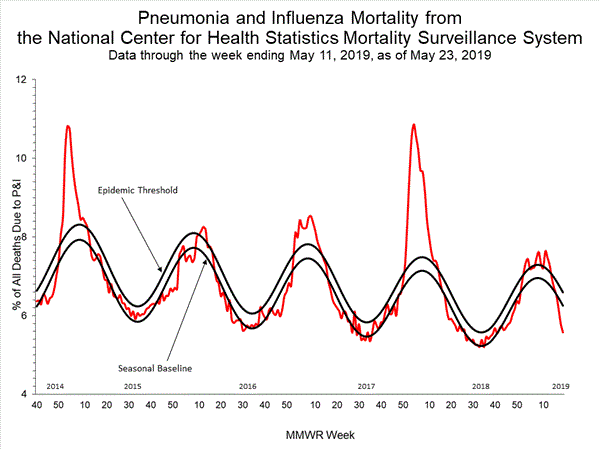
5.0% of deaths were attributed to pneumonia and influenza (P&I). This is below the epidemic threshold of 6.5%.
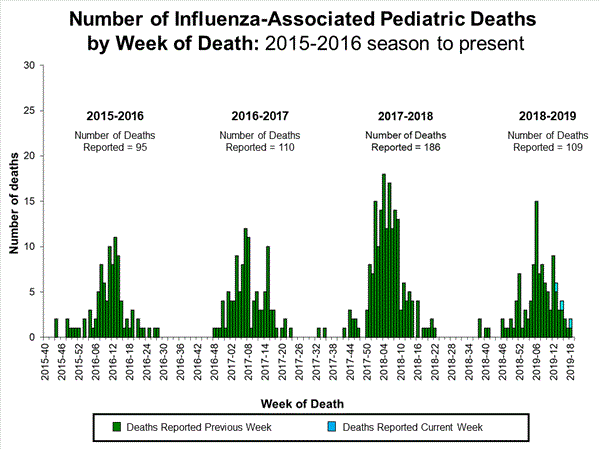
Four new influenza-associated pediatric deaths occurring during the 2019-2020 season were reported to CDC this week. The total for the season is 10.
All data are preliminary and may change as more reports are received.
A description of the CDC influenza surveillance system, including methodology and detailed descriptions of each data component is available on the surveillance methods page.
Additional information on the current and previous influenza seasons for each surveillance component are available on FluView Interactive.
Key Points
- The 2019-2020 season is underway; all regions of the country are seeing elevated levels of flu-like illness.
- Activity is being caused mostly by influenza B/Victoria viruses, which is unusual for this time of year. A/H1N1 viruses are the next most common and are increasing in proportion relative to other influenza viruses in some regions.
- CDC estimates that so far this season there have been at least 2.6 million flu illnesses, 23,000 hospitalizations and 1,300 deaths from flu.
- It’s not too late to get vaccinated. Flu vaccination is always the best way to prevent flu and its potentially serious complications.
- Antiviral medications are an important adjunct to flu vaccine in the control of influenza. Almost all (>99%) of the influenza viruses tested this season are susceptible to the 4 FDA-approved influenza antiviral medications recommended for use in the U.S. this season.
U.S. Virologic Surveillance
Clinical Laboratories
The results of tests performed by clinical laboratories nationwide are summarized below. Data from clinical laboratories (the percentage of specimens tested that are positive for influenza) are used to monitor whether influenza activity is increasing or decreasing.
| Week 49 | Data Cumulative since September 29, 2019 (week 40) |
|
|---|---|---|
| No. of specimens tested | 30,510 | 265,670 |
| No. of positive specimens (%) | 3,436 (11.3%) | 15,027 (5.7%) |
| Positive specimens by type | ||
| Influenza A | 1,083 (31.5%) | 4,577 (30.5%) |
| Influenza B | 2,353 (68.5%) | 10,450 (69.5%) |

View Chart Data | View Full Screen
Public Health Laboratories
The results of tests performed by public health laboratories nationwide are summarized below. Data from public health laboratories are used to monitor the proportion of circulating viruses that belong to each influenza subtype/lineage.
| Week 49 | Data Cumulative since September 29, 2019 (week 40) |
|
|---|---|---|
| No. of specimens tested | 1,508 | 15,172 |
| No. of positive specimens | 631 | 4,556 |
| Positive specimens by type/subtype | ||
| Influenza A | 283 (44.8%) | 1,932 (42.4%) |
| (H1N1)pdm09 | 221 (83.7%) | 1,171 (64.7%) |
| H3N2 | 43 (16.3%) | 640 (35.3%) |
| Subtyping not performed | 19 | 121 |
| Influenza B | 348 (55.2%) | 2,624 (57.6%) |
| Yamagata lineage | 6 (2.5%) | 59 (3.0%) |
| Victoria lineage | 232 (97.5%) | 1,904 (97.0%) |
| Lineage not performed | 110 | 661 |
Nationally influenza B/Victoria viruses have been reported more frequently than other influenza viruses this season; followed by A(H1N1)pdm09 and A(H3N2) viruses. The predominant virus varies by region and the proportions of influenza B/Victoria and influenza A(H1N1)pmd09 viruses are increasing in some regions. Regional and state level data about circulating influenza viruses can be found on FluView Interactive. The predominant virus also varies by age group. Nationally, influenza B/Victoria viruses are the most commonly reported influenza viruses among children age 0-4 years (46% of reported viruses) and 5-24 years (59% of reported viruses), while A(H3N2) viruses are the most commonly reported influenza viruses among persons 65 years of age and older (47% of reported viruses). Among adults aged 25-64 years, approximately equal proportions of influenza A(H1N1)pdm09 and B/Victoria viruses (38% and 34%, respectively) have been reported. Additional age data can be found on FluView Interactive.
Additional virologic surveillance information for current and past seasons:
Surveillance Methods | FluView Interactive: National, Regional, and State Data or Age Data
<!–
Novel Influenza A Virus:
One additional human infection with a novel influenza A virus was reported by Ohio. This person was infected with an influenza A(H1N2) variant (A(H1N2)v) virus and reported exposure to swine at an agricultural fair during the week preceding illness onset. The patient is a child < 18 years of age, was not hospitalized, and continues to recover from illness.
A total of 14 variant viruses have been reported to CDC during 2018. One of these has been an influenza A(H3N2) variant (A(H3N2)v) virus (Indiana [1]), and 13 have been A(H1N2)v viruses (California [6], Michigan [3], and Ohio [4]).
Early identification and investigation of human infections with novel influenza A viruses are critical so that the risk of infection can be more fully understood and appropriate public health measures can be taken. Additional information on influenza in swine, variant influenza infection in humans, and strategies to interact safely with swine can be found at http://www.cdc.gov/flu/swineflu/index.htm.
Additional information regarding human infections with novel influenza A viruses can be found at http://gis.cdc.gov/grasp/fluview/Novel_Influenza.html.
–>
Influenza Virus Characterization
CDC performs genetic and antigenic characterization of U.S. viruses submitted from state and local health laboratories using Right Size Roadmap submission guidance. These data are used to compare how similar the currently circulating influenza viruses are to the reference viruses used for developing new influenza vaccines and to monitor evolutionary changes that continually occur in circulating influenza. CDC also tests susceptibility of influenza viruses to antiviral medications including the neuraminidase inhibitors (oseltamivir, zanamivir, and peramivir) and the PA endonuclease inhibitor baloxavir.
CDC genetically characterized 369 influenza viruses collected in the U.S. from September 29, 2019 to December 7, 2019.
| Virus Subtype or Lineage | Genetic Characterization | ||||
|---|---|---|---|---|---|
| Total No. of Subtype/Lineage Tested | Clade | Number (% of subtype/lineage tested) | Subclade | Number (% of subtype/lineage tested) | |
| A/H1 | 81 | ||||
| 6B.1A | 81 (100%) | ||||
| A/H3 | 132 | ||||
| 3C.2a | 132 (100%) | 2a1 | 132 (100%) | ||
| 2a2 | 0 | ||||
| 2a3 | 0 | ||||
| 2a4 | 0 | ||||
| 3C.3a | 0 | 3a | 0 | ||
| B/Victoria | 142 | ||||
| V1A | 142 (100%) | V1A | 0 | ||
| V1A.1 | 22 (15.5%) | ||||
| V1A.3 | 120 (84.5%) | ||||
| B/Yamagata | 14 | ||||
| Y3 | 14 (100%) | ||||
CDC antigenically characterizes a subset of influenza viruses by hemagglutination inhibition (HI) or neutralization based Focus Reduction assays (FRA). Antigenic drift is evaluated by comparing antigenic properties of cell-propagated reference viruses representing currently recommended vaccine components with those of cell-propagated circulating viruses. CDC antigenically characterized 61 influenza viruses collected in the U.S. from September 29, 2019 to December 7, 2019.
Influenza A Viruses
- A (H1N1)pdm09: Eighteen A(H1N1)pdm09 viruses were antigenically characterized by HI with ferret antisera, and all were antigenically similar (reacting at titers that were within 4-fold of the homologous virus titer) to cell-propagated A/Brisbane/02/2018-like reference viruses representing the A(H1N1)pdm09 component for the 2019-20 Northern Hemisphere influenza vaccines.
- A (H3N2): Seventeen A(H3N2) viruses were antigenically characterized by FRA with ferret antisera, and 12 (70.6%) were antigenically similar to cell-propagated A/Kansas/14/2017-like reference viruses representing the A(H3N2) component for the 2019-20 Northern Hemisphere influenza vaccines.
Influenza B Viruses
- B/Victoria: Sixteen B/Victoria lineage viruses, including viruses from both co-circulating sub-clades, were antigenically characterized by HI with ferret antisera, and 10 (62.5%) were antigenically similar to cell-propagated B/Colorado/06/2017-like reference viruses representing the B/Victoria component for the 2019-20 Northern Hemisphere influenza vaccines.
- B/Yamagata: Ten B/Yamagata lineage viruses were antigenically characterized by HI with ferret antisera, and all 10 (100%) were antigenically similar to cell-propagated B/Phuket/3073/2013-like reference viruses representing the B/Yamagata component for the 2019-20 Northern Hemisphere influenza vaccines.
CDC assesses susceptibility of influenza viruses to the antiviral medications oseltamivir, zanamivir, peramivir, and baloxavir using next generation sequence analysis supplemented by laboratory assays. Viruses collected in the U.S. since September 29, 2019 were tested for antiviral susceptibility as follows:
| Antiviral Medication | Total Viruses | A/H1 | A/H3 | B/Victoria | B/Yamagata | ||
|---|---|---|---|---|---|---|---|
| Neuraminidase Inhibitors | |||||||
| Oseltamivir | Viruses Tested | 415 | 81 | 130 | 190 | 14 | |
| Reduced Inhibition | (0.0%) | (0.0%) | (0.0%) | (0.0%) | (0.0%) | ||
| Highly Reduced Inhibition | 1 (0.2%) | 1 (1.2%) | (0.0%) | (0.0%) | (0.0%) | ||
| Peramivir | Viruses Tested | 415 | 81 | 130 | 190 | 14 | |
| Reduced Inhibition | (0.0%) | (0.0%) | (0.0%) | (0.0%) | (0.0%) | ||
| Highly Reduced Inhibition | 1 (0.2%) | 1 (1.2%) | (0.0%) | (0.0%) | (0.0%) | ||
| Zanamivir | Viruses Tested | 415 | 81 | 130 | 190 | 14 | |
| Reduced Inhibition | 1 (0.2%) | (0.0%) | (0.0%) | 1 (0.5%) | (0.0%) | ||
| Highly Reduced Inhibition | (0.0%) | (0.0%) | (0.0%) | (0.0%) | (0.0%) | ||
| PA Endonuclease Inhibitor | |||||||
| Baloxavir | Viruses Tested | 336 | 75 | 122 | 126 | 13 | |
| Reduced Susceptibility | (0.0%) | (0.0%) | (0.0%) | (0.0%) | (0.0%) | ||
<!–Influenza A Viruses
- A (H1N1)pdm09: Phylogenetic analysis of the HA genes from 63 A(H1N1)pdm09 viruses showed that all belonged to clade 6B.1. Fifty-seven A(H1N1)pdm09 viruses were antigenically characterized, and 57 (100%) were antigenically similar (analyzed using HI with ferret antisera) to A/Michigan/45/2015 (6B.1), a cell-propagated A/Michigan/45/2015-like reference virus representing the A(H1N1)pdm09 component for the 2018-2019 Northern Hemisphere influenza vaccines.
- A (H3N2): Phylogenetic analysis of the HA genes from 64 A(H3N2) viruses revealed extensive genetic diversity with multiple clades/subclades co-circulating. The HA genes of circulating viruses belonged to clade 3C.2a (n=24), subclade 3C.2a1 (n=35) or clade 3C.3a (n=5). Thirty influenza A(H3N2) viruses were antigenically characterized by FRA with ferret antisera, and 28 (93.3%) A(H3N2) viruses tested were well-inhibited (reacting at titers that were within fourfold of the homologous virus titer) by ferret antisera raised against A/Singapore/INFIMH-16-0019/2016 (3C.2a1), a cell-propagated A/Singapore/INFIMH-16-0019/2016 -like reference virus representing the A(H3N2) component of 2018-2019 Northern Hemisphere influenza vaccines.
Influenza B Viruses
- B/Victoria: Phylogenetic analysis of 10 B/Victoria-lineage viruses indicate that all HA genes belonged to genetic clade V1A, however genetic subclades which are antigenically distinct have emerged. The majority of recent B/Victoria-lineage viruses belonged to a subclade of viruses with a 6-nucleotide deletion (encoding amino acids 162 and 163) in the HA (V1A.1, previously abbreviated as V1A-2Del). In addition, a small number of B/Victoria-lineage viruses have a three amino acid deletion (162-164) in the HA protein (abbreviated as V1A-3Del). Nine (90%) B/Victoria lineage viruses were well-inhibited by ferret antisera raised against cell-propagated B/Colorado/06/2017-like (V1A.1) reference virus, representing the B/Victoria lineage component of 2018-2019 Northern Hemisphere influenza vaccines. One (10%) B/Victoria lineage virus reacted poorly (at titers that were 8-fold or greater reduced compared with the homologous virus titer) with ferret antisera raised against cell-propagated B/Colorado/06/2017-like reference virus, and belonged to clade V1A.
- B/Yamagata: Phylogenetic analysis of 33 influenza B/Yamagata-lineage viruses indicate that the HA genes belonged to clade Y3. A total of 32 influenza B/Yamagata-lineage viruses were antigenically characterized, and all were antigenically similar to cell-propagated B/Phuket/3073/2013 (Y3), the reference vaccine virus representing the influenza B/Yamagata-lineage component of the 2018-2019 Northern Hemisphere quadrivalent vaccines.
The majority of U.S. viruses submitted for characterization come from state and local public health laboratories. Due to Right Size Roadmap considerations, specimen submission guidance to laboratories is that, if available, 2 influenza A(H1N1)pdm09, 2 influenza A(H3N2), and 2 influenza B viruses be submitted every other week. Therefore, the numbers of each virus type/subtype characterized should be more balanced across subtypes/lineages but will not reflect the actual proportion of circulating viruses. In the figure below, the results of tests performed by public health labs are shown on the left and CDC sequence results (by genetic clade/subclade) are shown on the right.

View Chart Data | View Full Screen | View PowerPoint Presentation
- High – Puerto Rico and 11 states (Alabama, Arkansas, Georgia, Mississippi, Nebraska, New Mexico, South Carolina, Tennessee, Texas, Virginia, and Washington)
- Moderate – New York City and 11 states (Arizona, Colorado, Connecticut, Hawaii, Kentucky, Maryland, Minnesota, Nevada, New Jersey, Oklahoma, and Oregon)
- Low – District of Columbia and nine states (California, Florida, Illinois, Kansas, Massachusetts, New York, North Carolina, Pennsylvania, and Wisconsin)
- Minimal – 18 states (Alaska, Delaware, Idaho, Indiana, Iowa, Maine, Michigan, Missouri, Montana, New Hampshire, North Dakota, Ohio, Rhode Island, South Dakota, Utah, Vermont, West Virginia, and Wyoming)
- Data were insufficient to calculate an ILI activity level from the U.S. Virgin Islands and Louisiana.
- Widespread – 23 states (Alabama, Arizona, California, Connecticut, Georgia, Idaho, Indiana, Kentucky, Louisiana, Maryland, Massachusetts, Nebraska, Nevada, New Mexico, New York, North Carolina, Oregon, Pennsylvania, South Carolina, Tennessee, Texas, Virginia and Washington)
- Regional – Puerto Rico and 14 states (Arkansas, Colorado, Florida, Illinois, Michigan, Minnesota, Mississippi, Montana, New Jersey, Ohio, Oklahoma, Rhode Island, Utah and Wisconsin)
- Local – 12 states (Delaware, Hawaii, Iowa, Kansas, Maine, Missouri, New Hampshire, North Dakota, South Dakota, Vermont, West Virginia and Wyoming)
- Sporadic – the District of Columbia, the U.S. Virgin Islands and one state (Alaska)
- Guam did not report.
Antiviral Resistance:
During May 20-October 6, 2018, 156 specimens (61 influenza A(H1N1)pdm09, 51 influenza A(H3N2), and 44 influenza B viruses) collected in the United States were tested for susceptibility to the neuraminidase inhibitors (oseltamivir, zanamivir, and peramivir). All tested viruses were sensitive to all three recommended antiviral medications.
| Antiviral Medication | Total Viruses | A/H1 | A/H3 | B/Victoria | B/Yamagata | ||
|---|---|---|---|---|---|---|---|
| Neuraminidase Inhibitors | Oseltamivir | Viruses Tested | 2,547 | 1,183 | 969 | 215 | 180 |
| Reduced | 2 (0.1%) | 2 (0.2%) | 0 (0%) | 0 (0%) | 0 (0%) | ||
| Highly Reduced | 4 (0.2%) | 4 (0.3%) | 0 (0%) | 0 (0%) | 0 (0%) | ||
| Peramivir | Viruses Tested | 2,547 | 1,183 | 969 | 215 | 180 | |
| Reduced | 0 (0%) | 0 (0%) | 0 (0%) | 0 (0%) | 0 (0%) | ||
| Highly Reduced | 4 (0.2%) | 4 (0.3%) | 0 (0%) | 0 (0%) | 0 (0%) | ||
| Zanamivir | Viruses Tested | 2,547 | 1,183 | 969 | 215 | 180 | |
| Reduced | 0 (0%) | 0 (0%) | 0 (0%) | 0 (0%) | 0 (0%) | ||
| Highly Reduced | 0 (0%) | 0 (0%) | 0 (0%) | 0 (0%) | 0 (0%) | ||
| PA Cap-Dependent Endonuclease Inhibitor | Baloxavir Marboxil | Viruses Tested | 2,547 | 1,162 | 964 | 229 | 187 |
| Decreased Susceptibility | 0 (0%) | 0 (0%) | 0 (0%) | 0 (0%) | 0 (0%) | ||
While all of the recently circulating influenza viruses are susceptible to the neuraminidase inhibitor antiviral medications oseltamivir, zanamivir, and peramivir; rare sporadic instances of oseltamivir-resistant and peramivir-resistant influenza A(H1N1)pdm09 viruses and oseltamivir-resistant influenza A(H3N2) viruses have been detected worldwide. Antiviral treatment as early as possible is recommended for patients with confirmed or suspected influenza who have severe, complicated, or progressive illness; who require hospitalization; or who are at high risk for serious influenza-related complications. Additional information on recommendations for treatment and chemoprophylaxis of influenza virus infection with antiviral agents is available at http://www.cdc.gov/flu/antivirals/index.htm.
Outpatient Illness Surveillance
ILINet
Nationwide during week 49, 3.2% of patient visits reported through the U.S. Outpatient Influenza-like Illness Surveillance Network (ILINet) were due to influenza-like illness (ILI). This percentage is above the national baseline of 2.4%. The decrease in the percentage of patient visits for ILI during week 49 compared to week 48 may be influenced in part by a reduction in routine healthcare visits surrounding the Thanksgiving holiday (occurring during week 48) as has occurred during previous seasons.

View Chart Data | View Full Screen
On a regional level, the percentage of outpatient visits for ILI ranged from 1.8% to 5.7% during week 49. All regions reported a percentage of outpatient visits for ILI which is equal to or above their region-specific baselines.
ILI Activity Map
Data collected in ILINet are used to produce a measure of ILI activity* by state.
During week 49, the following ILI activity levels were experienced:
*Data collected in ILINet may disproportionally represent certain populations within a state, and therefore, may not accurately depict the full picture of influenza activity for the whole state. Differences in the data presented here by CDC and independently by some state health departments likely represent differing levels of data completeness with data presented by the state likely being the more complete.
Additional information about medically attended visits for ILI for current and past seasons:
Surveillance Methods | FluView Interactive: National, Regional, and State Data or ILI Activity Map
Geographic Spread of Influenza as Assessed by State and Territorial Epidemiologists
The influenza activity reported by state and territorial epidemiologists indicates geographic spread of influenza viruses but does not measure the severity of influenza activity.
During week 49 the following influenza activity was reported:
Additional geographic spread surveillance information for current and past seasons:
Surveillance Methods | FluView Interactive
Influenza-Associated Hospitalizations
The Influenza Hospitalization Surveillance Network (FluSurv-NET) conducts population-based surveillance for laboratory-confirmed influenza-related hospitalizations in select counties in the Emerging Infections Program (EIP) states and Influenza Hospitalization Surveillance Project (IHSP) states.
A total of 1,139 laboratory-confirmed influenza-associated hospitalizations were reported by FluSurv-NET sites between October 1, 2019 and December 7, 2019. The overall hospitalization rate was 3.9 per 100,000 population. The highest rate of hospitalization was among adults aged ≥65 (9.4 per 100,000 population), followed by children aged 0-4 (7.5 per 100,000 population) and adults aged 50-64 (4.1 per 100,000 population). Among 1,139 hospitalizations, 627 (55.0%) were associated with influenza A virus, 499 (43.8%) with influenza B virus, 6 (0.5%) with influenza A virus and influenza B virus co-infection, and 7 (0.6%) with influenza virus for which the type was not determined. Among those with influenza A subtype information, 103 (70.5%) were A(H1N1)pdm09 virus and 43 (29.5%) were A(H3N2).

View Full Screen
Additional hospitalization surveillance information for current and past seasons and additional age groups:
Surveillance Methods | FluView Interactive
<!–

FluSurv-NET data are preliminary and displayed as they become available. Therefore, figures are based on varying denominators as some variables represent information that may require more time to be collected. Data are refreshed and updated weekly. Asthma includes a medical diagnosis of asthma or reactive airway disease; Cardiovascular diseases include conditions such as coronary heart disease, cardiac valve disorders, congestive heart failure, and pulmonary hypertension; does not include isolated hypertension; Chronic lung diseases include conditions such as chronic obstructive pulmonary disease, bronchiolitis obliterans, chronic aspiration pneumonia, and interstitial lung disease; Immune suppression includes conditions such as immunoglobulin deficiency, leukemia, lymphoma, HIV/AIDS, and individuals taking immunosuppressive medications; Metabolic disorders include conditions such as diabetes mellitus; Neurologic diseases include conditions such as seizure disorders, cerebral palsy, and cognitive dysfunction; Neuromuscular diseases include conditions such as multiple sclerosis and muscular dystrophy; Obesity was assigned if indicated in patient’s medical chart or if body mass index (BMI) >30 kg/m2; Pregnancy percentage calculated using number of female cases aged between 15 and 44 years of age as the denominator; Renal diseases include conditions such as acute or chronic renal failure, nephrotic syndrome, glomerulonephritis, and impaired creatinine clearance; No known condition indicates that the case did not have any known high risk medical condition indicated in medical chart at the time of hospitalization.
–>
Pneumonia and Influenza (P&I) Mortality Surveillance
Based on National Center for Health Statistics (NCHS) mortality surveillance data available on December 12, 2019, 5.0% of the deaths occurring during the week ending November 30, 2019 (week 48) were due to P&I. This percentage is below the epidemic threshold of 6.5% for week 48.
View Chart Data | View Full Screen
Additional pneumonia and influenza mortality surveillance information for current and past seasons:
Surveillance Methods | FluView Interactive
Influenza-Associated Pediatric Mortality
Four influenza-associated pediatric deaths were reported to CDC during week 49. One death occurred during week 47 (the week ending November 23, 2019) and was associated with an influenza A virus for which no subtyping was performed. Three deaths occurred during week 48 (the week ending November 30, 2019). One death was associated with an influenza B/Victoria virus, one was associated with an influenza B virus with no lineage determined, and one was associated with an influenza A(H1N1)pdm09 virus.
A total of 10 influenza-associated pediatric deaths occurring during the 2019-2020 season have been reported to CDC. Six cases tested positive for influenza B; three of these cases had the lineage determined and all were B/Victoria viruses. Four cases tested positive for influenza A. Two of these cases had subtyping performed and both were A(H1N1)pdm09 viruses.
View Full Screen
Additional pediatric mortality surveillance information for current and past seasons:
Surveillance Methods | FluView Interactive
Additional National and International Influenza Surveillance Information
FluView Interactive: FluView includes enhanced web-based interactive applications that can provide dynamic visuals of the influenza data collected and analyzed by CDC. These FluView Interactive applications allow people to create customized, visual interpretations of influenza data, as well as make comparisons across flu seasons, regions, age groups and a variety of other demographics. To access these tools, visit http://www.cdc.gov/flu/weekly/fluviewinteractive.htm
National Institute for Occupational Safety and Health: Monthly surveillance data on the prevalence of health-related workplace absenteeism among full-time workers in the United States are available from NIOSH at https://www.cdc.gov/niosh/topics/absences/default.html
U.S. State and local influenza surveillance:Select a jurisdiction below to access the latest local influenza information
World Health Organization: Additional influenza surveillance information from participating WHO member nations is available through FluNet and the Global Epidemiology Reports.
WHO Collaborating Centers for Influenza located in Australia, China, Japan, the United Kingdom, and the United States (CDC in Atlanta, Georgia).
Europe: For the most recent influenza surveillance information from Europe, please see WHO/Europe and the European Centre for Disease Prevention and Control at http://www.flunewseurope.org/.
Public Health Agency of Canada: The most up-to-date influenza information from Canada is available at http://www.phac-aspc.gc.ca/fluwatch/
Public Health England: The most up-to-date influenza information from the United Kingdom is available at https://www.gov.uk/government/statistics/weekly-national-flu-reports
How CDC Uses Flu Forecasting
Saturday, December 7th, 2019https://www.cdc.gov/flu/weekly/flusight/index.html?deliveryName=USCDC_7_3-DM14949
How CDC Forecasts Seasonal Influenza in the U.S.
The timing and severity of influenza in the United States can vary widely from season to season. Flu forecasting aims to predict the characteristics of influenza seasons before disease activity occurs and is captured by the U.S. influenza surveillance system. Since the 2013-2014 flu season, the Influenza Division at CDC has worked with CDC’s Epidemic Prediction Initiative and external researchers to improve the science and usability of flu forecasting, including the coordination of flu forecasting challenges. Recently, these challenges have been extended to the state level.
This page includes information on current and past influenza forecasting efforts, including working with external researchers and the flu season characteristics being forecasted.
Working with External Researches to Predict Flu in the U.S.
Every influenza season since 2013–2014, CDC’s Influenza Division has engaged with members of the scientific community on real-world influenza forecasting challenges known as FluSight. Originally, 11 teams participated, but interest in FluSight has grown in the six years since FluSight’s inception. We anticipate that more than 20 teams will participate during the 2019-2020 flu season.
Each challenge usually runs from late October through mid-May. Teams independently develop their forecasting approaches using a variety of methods and data sources, and teams submit forecasts to CDC on a weekly basis. At the conclusion of each challenge, CDC determines how accurate each team’s forecasts were by scoring forecasts against actual flu activity, announcing an overall winner.
FluSight brings together multiple forecasts and researchers, making real-time forecasts available in one central location and providing structured and standardized assessments of forecast accuracy. Recently, funding was awarded to Carnegie Mellon University and University at Massachusetts Amherst to further improve the accuracy and communication of influenza forecasts at the national, regional, and state level.
What the Forecasts Aim to Predict
CDC and FluSight partners worked together to develop targets – or the outcome that a forecast is predicting (like season peak) – that would be meaningful to public health. Targets for the main FluSight Challenge at the national level are season onset, peak week, peak intensity, and short-term activity. These target definitions rely on the percent of visits to health-care providers that are for influenza-like illness from the CDC’s U.S. Outpatient ILI Surveillance Network (ILINet).
- Season onset: The first week when ILINet is at or above baseline and remains there for at least two more weeks
- Peak week: The week when ILINet is the highest for the whole season (it is possible to have more than one peak week in a given season if two weeks are “tied” for the highest value)
- Peak intensity: The highest value that ILINet reaches during the season
- Short-term ILI activity: The ILINet value one, two, three, and four weeks ahead of the date that they are available in FluView.
State-level forecasting efforts are recent, only having been available starting in the 2017-18 season. Some targets in these systems vary from the national-level.
Collaborating After Each Challenge to Understand Forecast Results and Prepare for Next Season
At the end of every forecasting season, CDC, FluSight partners, and stakeholders gather to review forecasting approaches, discuss the accuracy of forecasts from the past season, identity overall challenges and successes and plans for future seasons, such as the additions of new forecasting targets. These meetings improve the usefulness of forecasting by providing the opportunity for collaboration among forecasters and public health officials.
Types of Influenza Viruses
Saturday, December 7th, 2019CDC https://www.cdc.gov/flu/about/viruses/types.htm?deliveryName=USCDC_7_3-DM14949
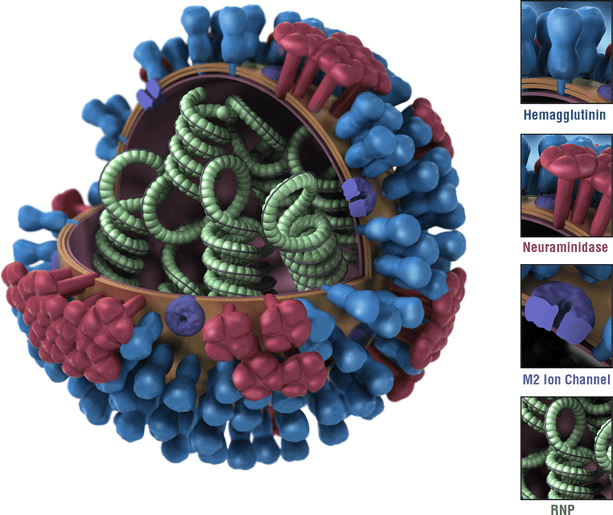

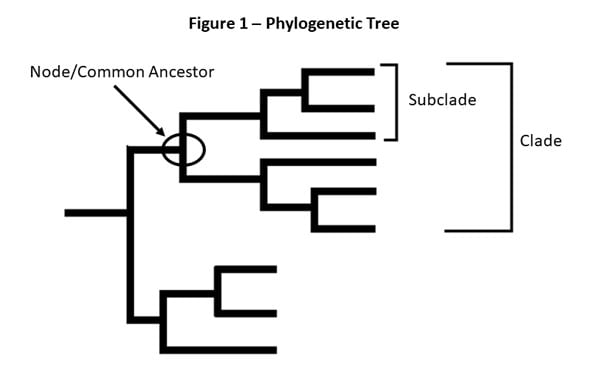 Figure 1 – This is a picture of a phylogenetic tree. In a phylogenetic tree, related viruses are grouped together on branches. Influenza viruses whose HA genes’ share the same genetic changes and who also share a common ancestor (node) are grouped into specific “clades” and “sub clades.” These clades and sub-clades are alternatively sometimes called “groups” and “sub-groups.”

Figure 3 – This image shows how influenza viruses are named. The name starts with the virus type, followed by the place the virus was isolated, followed by the virus strain number, the year isolated, and finally, the virus subtype.
There are four types of influenza viruses: A, B, C and D. Human influenza A and B viruses cause seasonal epidemics of disease (known as the flu season) almost every winter in the United States. Influenza A viruses are the only influenza viruses known to cause flu pandemics, i.e., global epidemics of flu disease. A pandemic can occur when a new and very different influenza A virus emerges that both infects people and has the ability to spread efficiently between people. Influenza type C infections generally cause mild illness and are not thought to cause human flu epidemics. Influenza D viruses primarily affect cattle and are not known to infect or cause illness in people.
Influenza A viruses are divided into subtypes based on two proteins on the surface of the virus: hemagglutinin (H) and neuraminidase (N). There are 18 different hemagglutinin subtypes and 11 different neuraminidase subtypes (H1 through H18 and N1 through N11, respectively). While there are potentially 198 different influenza A subtype combinations, only 131 subtypes have been detected in nature. Current subtypes of influenza A viruses that routinely circulate in people include: A(H1N1) and A(H3N2). Influenza A subtypes can be further broken down into different genetic “clades” and “sub-clades.” See the “Influenza Viruses” graphic below for a visual depiction of these classifications.
Clades and sub-clades can be alternatively called “groups” and “sub-groups,” respectively. An influenza clade or group is a further subdivision of influenza viruses (beyond subtypes or lineages) based on the similarity of their HA gene sequences. (See the Genome Sequencing and Genetic Characterization page for more information). Clades and subclades are shown on phylogenetic trees as groups of viruses that usually have similar genetic changes (i.e., nucleotide or amino acid changes) and have a single common ancestor represented as a node in the tree (see Figure 1). Dividing viruses into clades and subclades allows flu experts to track the proportion of viruses from different clades in circulation.
Note that clades and sub-clades that are genetically different from others are not necessarily antigenically different (i.e., viruses from a specific clade or sub-clade may not have changes that impact host immunity in comparison to other clades or sub-clades).
Currently circulating influenza A(H1N1) viruses are related to the pandemic 2009 H1N1 virus that emerged in the spring of 2009 and caused a flu pandemic (CDC 2009 H1N1 Flu website). This virus, scientifically called the “A(H1N1)pdm09 virus,” and more generally called “2009 H1N1,” has continued to circulate seasonally since then. These H1N1 viruses have undergone relatively small genetic changes and changes to their antigenic properties (i.e., the properties of the virus that affect immunity) over time.
Of all the influenza viruses that routinely circulate and cause illness in people, influenza A(H3N2) viruses tend to change more rapidly, both genetically and antigenically. Influenza A(H3N2) viruses have formed many separate, genetically different clades in recent years that continue to co-circulate.
Influenza B viruses are not divided into subtypes, but instead are further classified into two lineages: B/Yamagata and B/Victoria. Similar to influenza A viruses, influenza B viruses can then be further classified into specific clades and sub-clades. Influenza B viruses generally change more slowly in terms of their genetic and antigenic properties than influenza A viruses, especially influenza A(H3N2) viruses. Influenza surveillance data from recent years shows co-circulation of influenza B viruses from both lineages in the United States and around the world. However, the proportion of influenza B viruses from each lineage that circulate can vary by geographic location.
Naming Influenza Viruses
CDC follows an internationally accepted naming convention for influenza viruses. This convention was accepted by WHO in 1979 and published in February 1980 in the Bulletin of the World Health Organization, 58(4):585-591 (1980) (see A revision of the system of nomenclature for influenza viruses: a WHO Memorandum pdf icon[854 KB, 7 pages]external icon). The approach uses the following components:
- The antigenic type (e.g., A, B, C, D)
- The host of origin (e.g., swine, equine, chicken, etc.). For human-origin viruses, no host of origin designation is given. Note the following examples:
- (Duck example): avian influenza A(H1N1), A/duck/Alberta/35/76
- (Human example): seasonal influenza A(H3N2), A/Perth/16/2019
- Geographical origin (e.g., Denver, Taiwan, etc.)
- Strain number (e.g., 7, 15, etc.)
- Year of collection (e.g., 57, 2009, etc.)
- For influenza A viruses, the hemagglutinin and neuraminidase antigen description are provided in parentheses (e.g., influenza A(H1N1) virus, influenza A(H5N1) virus)
- The 2009 pandemic virus was assigned a distinct name: A(H1N1)pdm09 to distinguish it from the seasonal influenza A(H1N1) viruses that circulated prior to the pandemic.
- When humans are infected with influenza viruses that normally circulate in swine (pigs), these viruses are call variant viruses and are designated with a letter ‘v’ (e.g., an A(H3N2)v virus).
Influenza Vaccine Viruses
One influenza A(H1N1), one influenza A(H3N2), and one or two influenza B viruses (depending on the vaccine) are included in each season’s influenza vaccines. Getting a flu vaccine can protect against flu viruses that are like the viruses used to make vaccine. Information about this season’s vaccine can be found at Preventing Seasonal Flu with Vaccination. Seasonal flu vaccines do not protect against influenza C or D viruses. In addition, flu vaccines will NOT protect against infection and illness caused by other viruses that also can cause influenza-like symptoms. There are many other viruses besides influenza that can result in influenza-like illness (ILI) that spread during flu season.
Human H9N2 infections have been reported only in Hong Kong, China, Bangladesh, and Pakistan. Now it’s in India!
Tuesday, November 12th, 2019Potdar V, Hinge D, Satav A, Simões EF, Yadav PD, Chadha MS. Laboratory-confirmed avian influenza A(H9N2) virus infection, India, 2019. Emerg Infect Dis. 2019 Dec [date cited]. https://doi.org/10.3201/eid2512.190636
Abstract
“A 17-month-old boy in India with severe acute respiratory infection was laboratory confirmed to have avian influenza A(H9N2) virus infection. Complete genome analysis of the strain indicated a mixed lineage of G1 and H732. The strain also was found to be susceptible to adamantanes and neuraminidase inhibitors.”
 and neuraminidase gene (B) gene of influenza virus A/India/TCM 2581/2019(H9N2) from India (black circle) and reference strains. The numbers above the branches are the bootstrap probabilities (%) for each branch, determined by using the MEGA 7.0 (https://megasoftware.net). Human cases from other countries are in bold. Scale bars indicate substitutions per site.")
The case: “……The child, a resident of Melghat, had fever, cough, breathlessness, and difficulty feeding for 2 days since illness onset on January 31, 2019. His high intermittent grade fever had no diurnal variation and no association with rash or mucocutaneous lesions. Examination revealed a conscious, restless child with a respiratory rate of 48 breaths/min and lower chest wall in-drawing with intermittent absence of breathing for >20 seconds. He was fully immunized for his age, with bacillus Calmette–Guérin, diphtheria, hepatitis B, poliovirus, and measles vaccines. Both length and weight for age were less than −3 SD. History of travel with his parents to a local religious gathering 1 week before symptom onset was elicited. The father had similar symptoms on return from the gathering but could not undergo serologic testing because of his migrant work. No history of poultry exposure was elicited. The child received an antibacterial drug and antipyretics and recovered uneventfully.….”
President Donald J. Trump Is Working to Modernize and Improve Influenza Vaccines
Saturday, September 21st, 2019MODERNIZING INFLUENZA VACCINES: President Donald J. Trump is safeguarding public health by helping ensure Americans have access to effective influenza vaccines.
- Today, President Trump signed an executive order to modernize influenza vaccines and help protect more Americans through vaccination.
- At President Trump’s direction, the Administration will work to promote new technologies to improve vaccine manufacturing and effectiveness.
- This will reduce reliance on more time-consuming, egg-based vaccine production.
- Improving the speed of production will enable experts to better match vaccines to actively circulating viruses, an important piece of making the vaccines more effective.
- The Administration will advance the development of new, more effective vaccines.
- The Trump Administration will also work to increase Americans’ access to vaccines by reducing barriers to seasonal flu vaccine services.
- To help put these objectives into action, President Trump is establishing a task force to identify policy priorities and monitor progress.
PROTECTING LIVES THROUGH PREVENTION: Influenza vaccines are vitally important to disease prevention, yet current production methods need to be improved.
- Influenza vaccines are the best way to save lives, reduce the illness severity, and prevent influenza infections in the first place.
- During the 2017–2018 flu season, influenza vaccinations prevented up to 7.1 million illnesses, 3.7 million medical visits, and 109,000 hospitalizations.
- A Centers for Disease Control and Prevention study found that vaccines prevented more than 40,000 flu-associated deaths over a nine-year period.
- It is especially important to be able to rapidly produce well-matched influenza vaccines using scalable technologies in the event of a future influenza pandemic.
- Despite their important role in safeguarding the health of the American people, influenza vaccines are currently produced using more time-consuming, egg-based technology.
- More rapid non-egg-based production methods would give experts more time to select the most relevant strains.
PROMOTING PUBLIC HEALTH: Improving the influenza vaccine is part of President Trump’s longstanding effort to combat public health threats and promote quality care for all Americans.
- President Trump has released a National Biodefense Strategy and a Global Health Security Strategy to help combat biological threats and pandemics.
- President Trump has made it a priority to increase the quality and accessibility of care for American patients.
- This year, the President launched a kidney health initiative to help prevent kidney failure, improve treatment options, and expand access to life-saving transplants.
- The Trump Administration is working to encourage new, innovative approaches to treating childhood cancer.
- President Trump launched an initiative to end the HIV/AIDS epidemic in America over the next decade.
- The Administration is supporting research on new treatments for opioid addiction.
Rubbing hands with ethanol-based sanitizers may not be effective hand hygiene after all.
Friday, September 20th, 2019“……the researchers from the Kyoto Profectural University of Medicine found that ethanol-based disinfectants, or hand sanitizers, would have be in contact for at least 4 minutes with the influenza A virus before killing it, a much longer duration than typical use. After 2 minutes of use, the virus was still active...….”
Baloxavir showed broad-spectrum in vitro replication inhibition of 4 types of influenza viruses
Wednesday, July 10th, 2019Mishin VP, Patel MC, Chesnokov A, De La Cruz J, Nguyen HT, Lollis L, et al. Susceptibility of influenza A, B, C, and D viruses to baloxavir. Emerg Infect Dis. 2019 Oct [date cited]. https://doi.org/10.3201/eid2510.190607
“…….Baloxavir displayed broad antiviral activity against diverse influenza viruses, including all 4 types and animal-origin influenza A viruses with pandemic potential. Our findings suggest that baloxavir might offer the first therapeutic option against influenza C virus infections. Further studies are needed to provide comprehensive assessment of baloxavir susceptibility by using a large panel of representative influenza C viruses. Ongoing monitoring of baloxavir susceptibility of emerging avian and swine influenza A viruses with pandemic potential is needed to inform clinical management and public health preparedness efforts...…”

2018-2019 Influenza Season Week 20 ending May 18, 2019: Influenza activity remained low in United States and was similar to last week.
Sunday, May 26th, 2019CDC