U.S. trends in occurrence of nationally reportable vectorborne diseases during 2004–2016.
May 2nd, 2018Rosenberg R, Lindsey NP, Fischer M, et al. Vital Signs: Trends in Reported Vectorborne Disease Cases — United States and Territories, 2004–2016. MMWR Morb Mortal Wkly Rep. ePub: 1 May 2018. DOI: http://dx.doi.org/10.15585/mmwr.mm6717e1.
Key Points
•A total of 642,602 cases of 16 diseases caused by bacteria, viruses, or parasites transmitted through the bites of mosquitoes, ticks, or fleas were reported to CDC during 2004–2016. Indications are that cases were substantially underreported.
•Tickborne diseases more than doubled in 13 years and were 77% of all vectorborne disease reports. Lyme disease accounted for 82% of all tickborne cases, but spotted fever rickettsioses, babesiosis, and anaplasmosis/ehrlichiosis cases also increased.
•Tickborne disease cases predominated in the eastern continental United States and areas along the Pacific coast. Mosquitoborne dengue, chikungunya, and Zika viruses were almost exclusively transmitted in Puerto Rico, American Samoa, and the U.S. Virgin Islands, where they were periodically epidemic. West Nile virus, also occasionally epidemic, was widely distributed in the continental United States, where it is the major mosquitoborne disease.
•During 2004–2016, nine vectorborne human diseases were reported for the first time from the United States and U.S. territories. The discovery or introduction of novel vectorborne agents will be a continuing threat.
•Vectorborne diseases have been difficult to prevent and control. A Food and Drug Administration–-approved vaccine is available only for yellow fever virus. Many of the vectorborne diseases, including Lyme disease and West Nile virus, have animal reservoirs. Insecticide resistance is widespread and increasing.
•Preventing and responding to vectorborne disease outbreaks are high priorities for CDC and will require additional capacity at state and local levels for tracking, diagnosing, and reporting cases; controlling vectors; and preventing transmission.
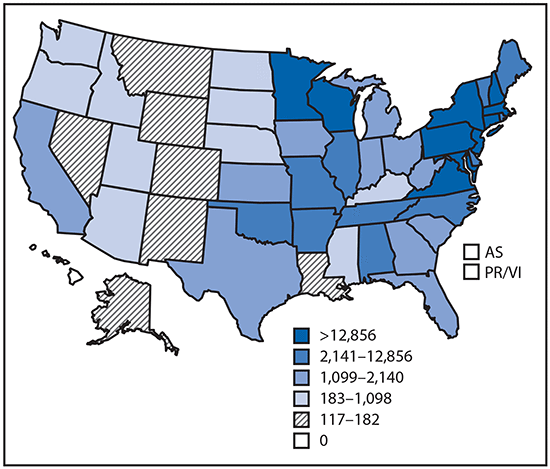
Reported cases* of tickborne disease — U.S. states and territories, 2004–2016
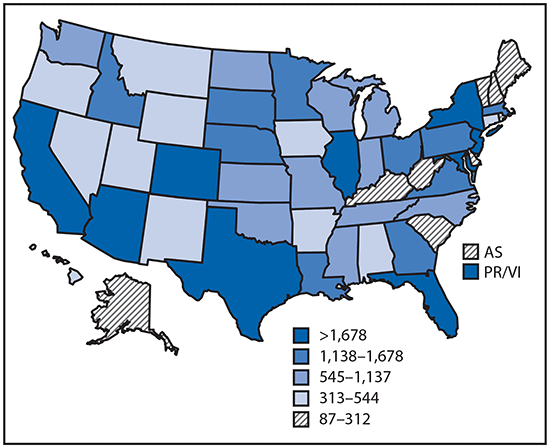
Reported cases* of mosquitoborne disease — U.S. states and territories, 2004–2016
Reported nationally notifiable mosquitoborne,* tickborne, and fleaborne† disease cases — U.S. states and territories, 2004–2016