Global & Disaster Medicine

Malaria in the United States, 2016
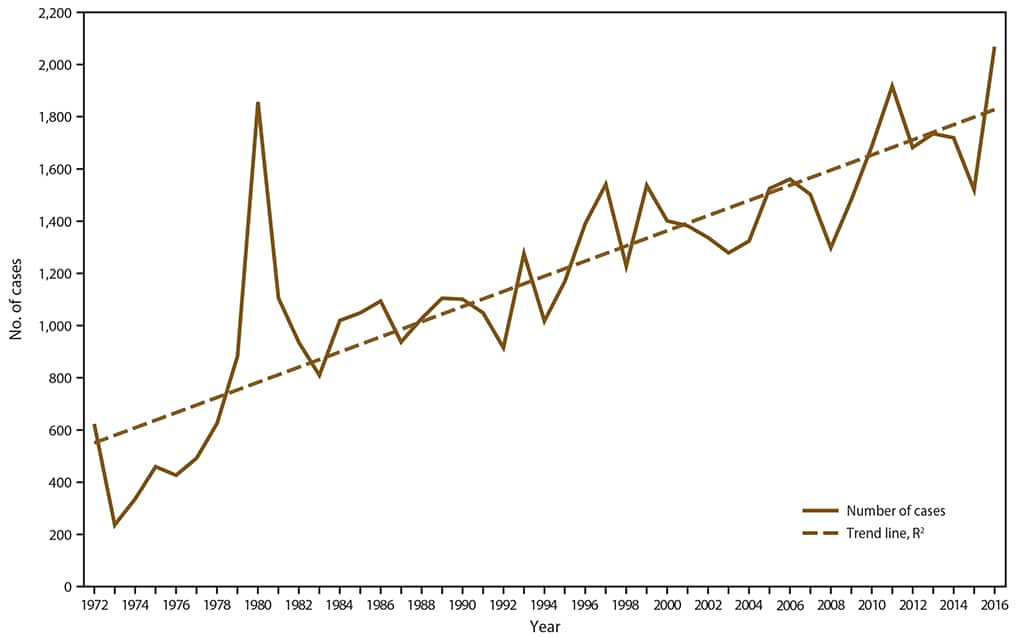
MMWR

“…….CDC received reports of 2,078 confirmed malaria cases with onset of symptoms in 2016, including two congenital cases, three cryptic cases, and one case acquired through blood transfusion. The number of malaria cases diagnosed in the United States has been increasing since the mid-1970s. …….”

Number of malaria cases* among U.S. military personnel, U.S. civilians, and non-U.S. residents — United States, 1972–2016

This figure is a line graph that shows the number of malaria cases among U.S. military personnel, U.S. civilians, and non-U.S. residents for the years 1972 through 2016. A solid line shows a gradually increasing upward trend in total number of cases, with the peak occurring in the current year. A dotted line shows an overall upward trend from 1972—2016.

Number* of malaria cases, by state — United States, 2016

This figure is a map of the United States that shows the number of malaria cases diagnosed in each state and territory in 2016. Fifteen jurisdictions reported >50 cases of malaria in 2016, accounting for 74.6% of the 2,078 cases reported: New York City (265), Maryland (182), Texas (170), California (125), Massachusetts (95), New Jersey (86), Pennsylvania (84), Florida (79), Virginia (75), New York state (not including New York City) (74), Georgia (69), Minnesota (66), Illinois (65), Ohio (63), and North Carolina (52).

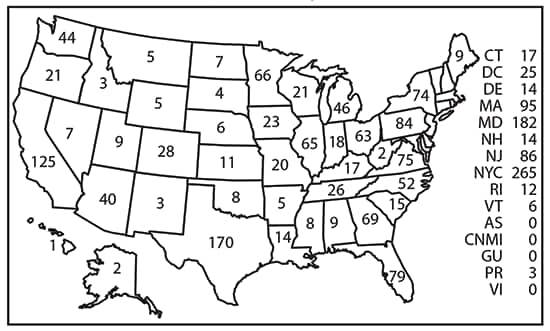
Abbreviations: AS = American Samoa; CT = Connecticut; CNMI = Commonwealth of the Northern Mariana Islands; DC = Washington, DC; DE = Delaware; GU = Guam; MA = Massachusetts; MD = Maryland; NH = New Hampshire; NJ = New Jersey; NYC = New York City; PR = Puerto Rico; RI = Rhode Island; VI = Virgin Islands; VT = Vermont.

* N = 2,078. New York state cases do not include those from New York City.


Comments are closed.

Categories

Recent Posts

Archives

Admin