Is there a risk for transportation of COVID-19 from Wuhan to other cities in China?
February 13th, 2020Du Z, Wang L, Chauchemez S, Xu X, Wang X, Cowling BJ, et al. Risk for transportation of 2019 novel coronavirus disease from Wuhan to other cities in China. Emerg Infect Dis. 2020 May [date cited]. https://doi.org/10.3201/eid2605.200146
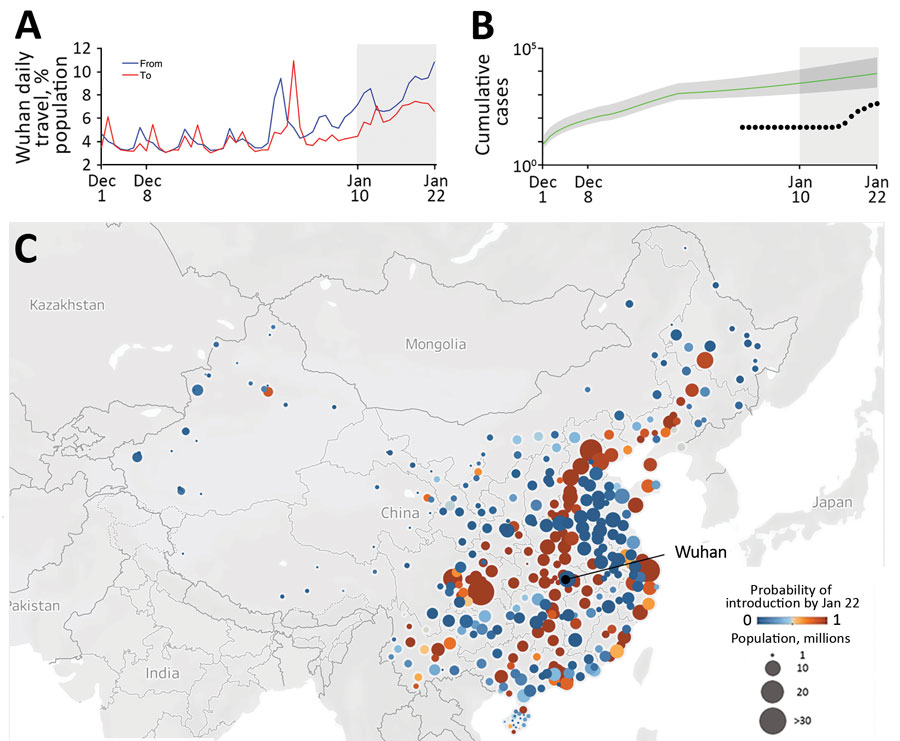
Abstract: “On January 23, 2020, China quarantined Wuhan to contain 2019 novel coronavirus disease (COVID-19). We estimated the probability of transportation of COVID-19 from Wuhan to 369 other cities in China before the quarantine. Expected COVID-19 risk is >50% in 130 (95% CI 89–190) cities and >99% in the 4 largest metropolitan areas.”

Risks for transportation of 2019 novel coronavirus disease (COVID-19) from Wuhan, China, before a quarantine was imposed on January 23, 2020. A) Daily travel volume to and from Wuhan, given as a percentage of the Wuhan population. Gray shading indicates the start of Spring Festival season on January 10, 2020, a peak travel period in China. B) Estimated and reported daily prevalence of COVID-19 in Wuhan. The green line and shading indicate model estimates of cumulative cases since December 1, 2019, with 95% credible interval bounds, assuming an epidemic doubling time of 7.31 days (95% credible interval 6.26–9.66 days). Black dots indicate cumulative confirmed case counts during January 1–22, 2020 (10). Gray shading at right indicates the start of Spring Festival season. C) Probability that >1 COVID-19 case infected in Wuhan traveled to cities in China by January 22, 2020. The 131 cities with a risk threshold >50% are indicated in shades of orange; 239 cities below that threshold are indicated in shades of blue. Map generated by using Mapbox (https://www.mapbox.com).


