Untreated chronic conditions can quickly become life-threatening in a refugee camp
December 16th, 2019CDC:
How Kerala Avoided a Chronic Disease Crisis
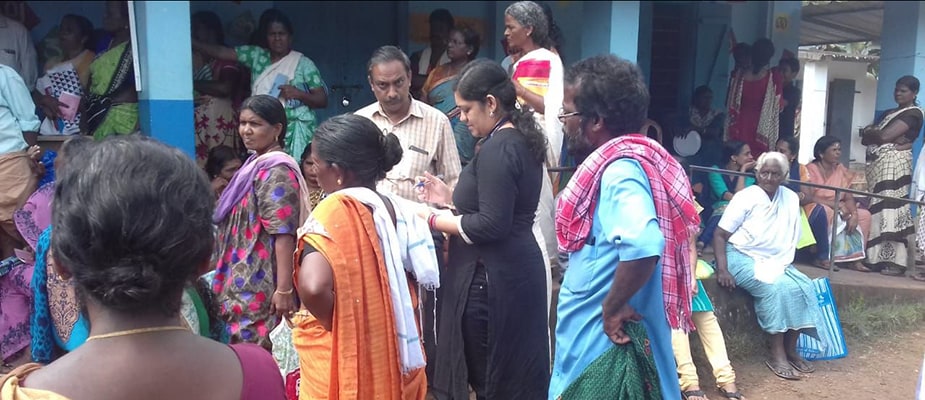
A field epidemiology resident connects with care providers and patients at a flood relief camp in Kumarakom, Kerala. Photo: Renjith Krishna
A river of mud and debris surged through the streets of Kerala in August 2018. The southwestern Indian state was hit with unusually high rainfall during monsoon season, overflowing dams and causing devastating floods and landslides that affected hundreds of villages and destroyed thousands of miles of roads and homes.
Over one million residents were evacuated and many moved to relief camps. For those with chronic conditions like hypertension (high blood pressure) and diabetes, life in a relief camp without access to medication or medical records can be dangerous.
“During an emergency we often consider potential complications from communicable diseases, but untreated chronic conditions can quickly become life-threatening,” explains Dr. Ganeshkumar, a medical scientist with the Indian Council of Medical Research-National Institute of Epidemiology (NIE).
Nearly 1 in 3 people impacted by the flood were estimated to have diagnosed hypertension, but due to emergency conditions, nearly 90% of these flood victims were living with uncontrolled blood pressure. Left untreated, high blood pressure could become a “silent killer” causing heart disease, stroke, or kidney failure with little warning.
Springing into Action
Within days of the floods, Kerala’s state health department teamed up with NIE to develop an action plan to address noncommunicable disease (NCD) risk factors like uncontrolled hypertension in the flood region.
NIE established a multi-step approach to respond to the burgeoning crisis. The team prepared guidelines for the treatment of high-risk NCD conditions based on the latest research and global best practices, increased local NCD medication supplies, and coordinated referral systems for people requiring emergency medical care. They then established reporting protocols throughout the state so they could actively monitor the crisis.
“Streamlining NCD service delivery by integrating into primary care is challenging during emergencies due to the competing priorities and the scattered displacement of patients,” explains Dr. Bipin Gopal, State NCD Nodal Officer in Kerala. “High-level planning is essential to ensure commitment and allotment of resources, but collaboration with stakeholders in the field is absolutely critical for interventions to be successful.”
Ready in an Emergency
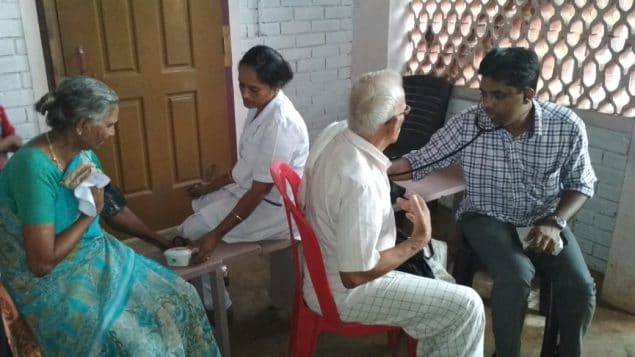
Local physicians screen for hypertension at a primary health center in Vanimal village in northern Kerala. Photo: Abishek S.
To help coordinate on-the-ground efforts, NIE deployed field epidemiology residents to the hardest hit districts in Kerala. Field epidemiologists, commonly referred to as disease detectives, are part of the global health workforce trained to guide the response to urgent public health problems by tracking, containing, and eliminating health threats.
Within a week after flooding began, the field epidemiology residents were collaborating with district medical officers and administrators to familiarize physicians in the relief camps and at primary care centers with the emergency treatment and referral guidelines. They provided support to increase public awareness about the danger of untreated NCDs and they trained health centers on the NCD emergency response monitoring system.
Chronic but Urgent
Since the 1980s, CDC has collaborated with countries to train a global workforce of field epidemiologists through the Field Epidemiology Training Program (FETP). FETP residents and graduates have responded to some of the world’s most urgent health events, including the Ebola virus outbreak in West Africa.
In 2018, CDC—in coordination with ministries of health, the World Health Organization, Resolve to Save Lives, and other global partners—launched an effort to strengthen NCD epidemiology within the training program, with a focus on cardiovascular disease and hypertension. Through intensive on-the-job training and mentorship, FETP NCD residents develop skills to quickly identify health risks, monitor health interventions, and use data to inform programs and policies.
Two of the epidemiologists who led the on-the-ground coordination in Kerala are part of the first FETP NCD cohort in India.
A Step Ahead
While Kerala is still recovering from the floods, health professionals in the region have provided over 100,000 NCD consultations. The quick action of NIE and the local field epidemiologist residents likely prevented scores of complications and deaths.
With chronic conditions requiring long-term care and sustained involvement from the health system, advocates of strengthening NCD prevention and control efforts have long asserted that health systems capable of addressing NCDs are more robust and better prepared to respond to all types of health threats.
All residents in India’s first FETP NCD cohort are now focusing on continuing to strengthen local health systems by supporting other districts on integrating hypertension and cardiovascular disease management into primary care.
“Field epidemiology training strengthens the national workforce and health system so that both can be responsive when an emergency occurs,” states Dr. Ganeshkumar. “We’ve seen that in action in Kerala.”
Ugandans knew they had to get ready for the worst when neighboring Democratic Republic of Congo (DRC) reported a new Ebola outbreak on August 1, 2018.
December 16th, 2019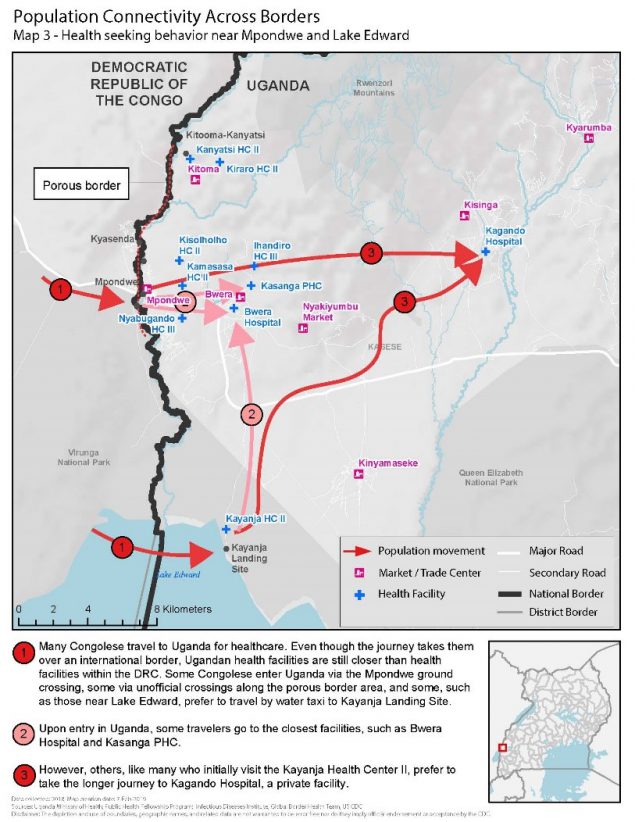
Ugandans knew they had to get ready for the worst when neighboring Democratic Republic of Congo (DRC) reported a new Ebola outbreak on August 1, 2018. Uganda shares more than 550 miles of border with DRC and sees thousands of people move between the two countries daily.
Understanding mobility patterns and connectivity between communities can inform preparedness and response efforts by identifying points of interest visited and routes traveled. Uganda’s Ministry of Health (MOH) activated the Public Health Emergency Operations Centre (PHEOC) and began preparedness activities. They wanted to be ready to rapidly detect, respond and stop further spread of Ebola if a case crossed the border. Since 2013, CDC-supported global health security investments and efforts in Uganda have dramatically helped the country reduce the time it takes to detect and respond to outbreaks. CDC has been supporting the MOH and its implementing partner, the Infectious Diseases Institute (IDI), to map routes traveled between DRC and Uganda, and points of interest within Uganda visited by Congolese, including health care facilities like Kagando Hospital.
Within the first week of the response, the MOH deployed a 14-person border health team to conduct point of entry assessments and characterize cross-border population movement in priority districts. The team used an adapted version of a CDC toolkit to hold community engagement activities to understand the behavior of Congolese seeking health care in Uganda. Results showed that Congolese would travel further into Uganda to reach Kagando Hospital rather than access closer government facilities. This information helped the District Task Force prioritized Kagando Hospital for evaluation and preparedness interventions. Similarly, local and national MOH level offices adjusted border health and surveillance preparedness initiatives to target the locations with the highest connectivity to the outbreak area in DRC. The MOH and IDI continue to map population movement along the shared borders with DRC and Rwanda. The results are used to inform preparedness interventions, including health care worker vaccinations, targeted community surveillance training, and strengthened infection and prevention control measures.
With support from CDC and other Global Health Security partners, Uganda is better prepared to respond to outbreaks at the source. This preparedness paid off when several travel-related Ebola cases were identified and quickly contained in Uganda in June 2019.
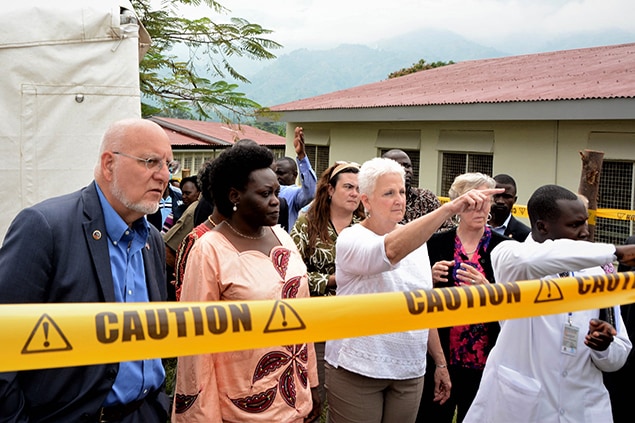
CDC Director Robert Redfield,the Minister of State for Health Sarah Opendi, and the US Ambassador to Uganda, Deborah Malac learn about Uganda Preparedness activities in 2018. Photo credit: Irene Nabusoba
On April 11, 2019, the Uganda MOH, CDC, and other partners held a nationwide Ebola outbreak simulation exercise. The three scenarios were: arrival of an ill traveler at Entebbe International Airport, detection of an ill person referred to Kagando Hospital in Kasese District, and identification of an ill traveler at a border crossing in Kasese. All three scenarios involved the PHEOC in the capital, Kampala.
Stopping Ebola requires early identification of cases, effective isolation of people ill with Ebola, and contact tracing of people exposed to Ebola patients so they can be vaccinated and isolated if they develop symptoms. The exercise evaluated the operational capabilities and identified strengths, weaknesses, and opportunities for improvement of Uganda’s emergency management systems at the border, in communities, health facilities, districts, and at the national level. Key capacities assessed included: Ebola alert management systems at key points of entry; isolation, transportation, and management of people with a suspected case of Ebola; laboratory sample collection, packaging, and dispatch; and initial management of people confirmed to have Ebola. The exercise also looked at community engagement in case of an Ebola event, knowledge and skills of village health teams, capacity of health facilities to handle cases, and general logistics and coordination at the district and national levels.
“Our aim with the simulation was to build full capabilities for full-fledged, real-time deployment and response. This made a world of a difference when Ebola crossed the border,” said CDC Uganda Division of Global Health Protection program director, Jaco Homsy.
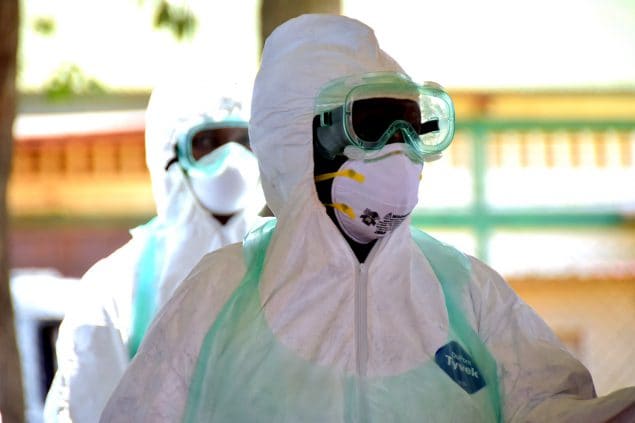
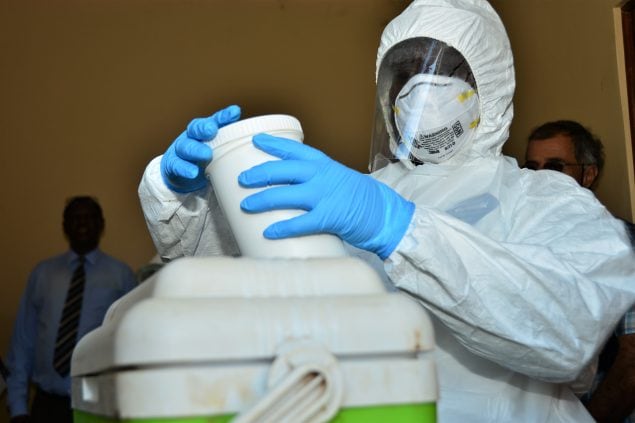
Responders wearing appropriate personal protective equipment during the simulation exercise. Photo credit: Irene Nabusoba
Two months after the simulation exercise, on June 11, 2019, the Uganda Minister of Health confirmed the first case of Ebola in the country—introduced by travelers from neighboring DRC. As it turned out, the simulation at Kagando Hospital in Kasese District helped medical staff quickly recognize Ebola symptoms in a patient who arrived at their hospital. A blood sample from the patient tested positive at a local laboratory. The MOH immediately formed a rapid response team that works with district health teams and local leaders to investigate and respond to other suspected Ebola cases. The team included 16 Field Epidemiology Training Program (FETP) fellows and alumni. FETP is a CDC-supported epidemiology-training program that provides epidemiologists with the skills to become true disease detectives. The team had an important role identifying a total of three Ebola confirmed cases in Uganda and tracking down more than 100 contacts of these cases.
For more than 10 years CDC has supported and collaborated with the Uganda Virus Research Institute’s (UVRI) viral hemorrhagic fever (VHF) laboratory. This established regional reference center for Ebola virus testing has tested, in real time, specimens from suspected Ebola cases and other VHF infections. Since the Ebola outbreak started in DRC, UVRI confirmed the three imported cases in Uganda. As of July 11, 2019 UVRI has tested almost 800 specimens suspected for Ebola, including close to 500 specimens from high-risk districts. In addition, healthcare and frontline workers have been vaccinated in 14 out of 30 high-risk districts, and this effort is ongoing.
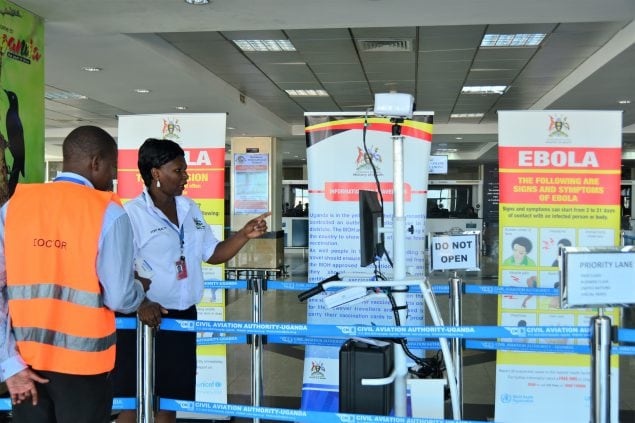
Port health staff looking at a “sick” person standing in line at the airport during the simulation exercise. Photo credit: Irene Nabusoba
Leocadia Kwagonza is a FETP graduate who now works for Uganda’s MOH leading the data management team for the current Ebola response. She has handled more than 10 previous outbreaks, but noted how Uganda’s preparedness and community efforts have made a difference.
“Many of the other outbreaks including some viral hemorrhagic fevers are difficult to identify at first, making it challenging to determine how to best respond. However, for this Ebola response, we had been prepared for a long time and the response structures are very well known even in the [Kasese] district. This was different because we were in anticipation mode,” said Kwagonza. “The community-led response in this current Ebola outbreak also made it easier especially in owning and taking up the interventions. There is always a community component, but this one has been awesome. There is a lot to learn from this experience not only for Uganda but for other countries as well.”
CDC, the Uganda government and other partners have collaborated to build global health security capacity for full-fledged, real time deployment and response. These efforts show how Uganda can put preparedness into action.
The simulation exercise tested Uganda’s capacity to safely transport samples of a dangerous pathogen. Photo credit: Irene Nabusoba
CDC: Preventing waterborne outbreaks in refugee camps
December 16th, 2019Hundreds of thousands of ethnic Rohingyas crossed the border into Cox’s Bazar, Bangladesh to escape violence in Rakhine State in Myanmar. More than 900,000 forcibly displaced Myanmar nationals live in refugee camps in Bangladesh. Because conditions are crowded and the area is prone to flooding, the risk of Acute Watery Diarrhea (AWD) and other waterborne disease outbreaks had to be reduced during the 2018 monsoon season. Humanitarian partners distributed household water treatment products throughout the camps and combined this with messages to promote good hygiene. However, a recent water, sanitation and hygiene (WASH) survey estimated that only 13% of households treat household water. Of the 182 households that reported to treat water using chlorine tablets, only 53 (21%) had detectable chlorine in their stored water, an indicator of whether water was treated and was protected from recontamination during storage in households. Bucket chlorination, where an attendant sitting by the well directly chlorinates each bucket of water as it is collected was also implemented, but only at a small number of wells. Because of low levels of household water treatment in the camps, the water, sanitation, and hygiene (WASH) team recommended to scale-up bucket chlorination to ensure households were using chlorinated water during the monsoon season.

The WASH team within CDC’s Emergency Response and Recovery Branch (ERRB) worked with UNICEF and non-governmental partners to increase bucket chlorination from June to September 2018. In July, ERRB WASH specialists measured chlorine levels in one camp to provide a snapshot of current levels of chlorine in the water. After this, the WASH team started a program to monitor bucket chlorination, using mobile phone surveys to ensure chlorinators were present and that chlorine was in water in nearby households. In addition, they piloted guidelines to help identify which drinking water wells should receive bucket chlorination first. Finally, the WASH team provided guidance to implementing partners on how to scale-up and improve bucket chlorination based on assessment and monitoring results.
In addition, CDC supported the WASH Sector in Cox’s Bazar and UNICEF by training local staff on how to conduct water quality testing and drafting guidance on water quality monitoring, including a system to monitor E. coli levels in wells through the dry and monsoon seasons.
The Rohingya face extremely challenging circumstances as they seek refuge in makeshift camps. The 2019 UN World Water Day theme is “leaving no one behind” and CDC seeks to assist partners in providing safe, treated drinking water to the world’s most vulnerable communities.
Weekly U.S. Influenza Surveillance Report: Key Updates for Week 49, ending December 7, 2019
December 13th, 2019Viruses
11.3% of respiratory specimens tested by clinical laboratories were positive for influenza viruses. This is higher than the previous week.
Nationally, B/Victoria viruses are most common followed by A(H1N1)pdm09 and A(H3N2) viruses. The predominant virus varies by region and age group.
Genetic and antigenic characterization and antiviral susceptibility of viruses collected in the U.S. this season are now being reported.
Illness
3.2% of visits to health care providers were for influenza-like illness (ILI). ILI has been at or above the national baseline of 2.4% for five weeks. All regions were at or above their baselines.
The number of jurisdictions experiencing high ILI activity decreased to 12 this week compared to 13 last week. In addition, 12 jurisdictions had moderate activity compared to 15 last week.
The number of jurisdictions reporting regional or widespread activity increased to 38 this week from 30 last week.
Severe Disease
The overall hospitalization rate for the season is 3.9 per 100,000. This is similar to what has been seen at this time during other recent seasons.
5.0% of deaths were attributed to pneumonia and influenza (P&I). This is below the epidemic threshold of 6.5%.
Four new influenza-associated pediatric deaths occurring during the 2019-2020 season were reported to CDC this week. The total for the season is 10.
All data are preliminary and may change as more reports are received.
A description of the CDC influenza surveillance system, including methodology and detailed descriptions of each data component is available on the surveillance methods page.
Additional information on the current and previous influenza seasons for each surveillance component are available on FluView Interactive.
Key Points
- The 2019-2020 season is underway; all regions of the country are seeing elevated levels of flu-like illness.
- Activity is being caused mostly by influenza B/Victoria viruses, which is unusual for this time of year. A/H1N1 viruses are the next most common and are increasing in proportion relative to other influenza viruses in some regions.
- CDC estimates that so far this season there have been at least 2.6 million flu illnesses, 23,000 hospitalizations and 1,300 deaths from flu.
- It’s not too late to get vaccinated. Flu vaccination is always the best way to prevent flu and its potentially serious complications.
- Antiviral medications are an important adjunct to flu vaccine in the control of influenza. Almost all (>99%) of the influenza viruses tested this season are susceptible to the 4 FDA-approved influenza antiviral medications recommended for use in the U.S. this season.
U.S. Virologic Surveillance
Clinical Laboratories
The results of tests performed by clinical laboratories nationwide are summarized below. Data from clinical laboratories (the percentage of specimens tested that are positive for influenza) are used to monitor whether influenza activity is increasing or decreasing.
| Week 49 | Data Cumulative since September 29, 2019 (week 40) |
|
|---|---|---|
| No. of specimens tested | 30,510 | 265,670 |
| No. of positive specimens (%) | 3,436 (11.3%) | 15,027 (5.7%) |
| Positive specimens by type | ||
| Influenza A | 1,083 (31.5%) | 4,577 (30.5%) |
| Influenza B | 2,353 (68.5%) | 10,450 (69.5%) |

View Chart Data | View Full Screen
Public Health Laboratories
The results of tests performed by public health laboratories nationwide are summarized below. Data from public health laboratories are used to monitor the proportion of circulating viruses that belong to each influenza subtype/lineage.
| Week 49 | Data Cumulative since September 29, 2019 (week 40) |
|
|---|---|---|
| No. of specimens tested | 1,508 | 15,172 |
| No. of positive specimens | 631 | 4,556 |
| Positive specimens by type/subtype | ||
| Influenza A | 283 (44.8%) | 1,932 (42.4%) |
| (H1N1)pdm09 | 221 (83.7%) | 1,171 (64.7%) |
| H3N2 | 43 (16.3%) | 640 (35.3%) |
| Subtyping not performed | 19 | 121 |
| Influenza B | 348 (55.2%) | 2,624 (57.6%) |
| Yamagata lineage | 6 (2.5%) | 59 (3.0%) |
| Victoria lineage | 232 (97.5%) | 1,904 (97.0%) |
| Lineage not performed | 110 | 661 |
Nationally influenza B/Victoria viruses have been reported more frequently than other influenza viruses this season; followed by A(H1N1)pdm09 and A(H3N2) viruses. The predominant virus varies by region and the proportions of influenza B/Victoria and influenza A(H1N1)pmd09 viruses are increasing in some regions. Regional and state level data about circulating influenza viruses can be found on FluView Interactive. The predominant virus also varies by age group. Nationally, influenza B/Victoria viruses are the most commonly reported influenza viruses among children age 0-4 years (46% of reported viruses) and 5-24 years (59% of reported viruses), while A(H3N2) viruses are the most commonly reported influenza viruses among persons 65 years of age and older (47% of reported viruses). Among adults aged 25-64 years, approximately equal proportions of influenza A(H1N1)pdm09 and B/Victoria viruses (38% and 34%, respectively) have been reported. Additional age data can be found on FluView Interactive.
Additional virologic surveillance information for current and past seasons:
Surveillance Methods | FluView Interactive: National, Regional, and State Data or Age Data
<!–
Novel Influenza A Virus:
One additional human infection with a novel influenza A virus was reported by Ohio. This person was infected with an influenza A(H1N2) variant (A(H1N2)v) virus and reported exposure to swine at an agricultural fair during the week preceding illness onset. The patient is a child < 18 years of age, was not hospitalized, and continues to recover from illness.
A total of 14 variant viruses have been reported to CDC during 2018. One of these has been an influenza A(H3N2) variant (A(H3N2)v) virus (Indiana [1]), and 13 have been A(H1N2)v viruses (California [6], Michigan [3], and Ohio [4]).
Early identification and investigation of human infections with novel influenza A viruses are critical so that the risk of infection can be more fully understood and appropriate public health measures can be taken. Additional information on influenza in swine, variant influenza infection in humans, and strategies to interact safely with swine can be found at http://www.cdc.gov/flu/swineflu/index.htm.
Additional information regarding human infections with novel influenza A viruses can be found at http://gis.cdc.gov/grasp/fluview/Novel_Influenza.html.
–>
Influenza Virus Characterization
CDC performs genetic and antigenic characterization of U.S. viruses submitted from state and local health laboratories using Right Size Roadmap submission guidance. These data are used to compare how similar the currently circulating influenza viruses are to the reference viruses used for developing new influenza vaccines and to monitor evolutionary changes that continually occur in circulating influenza. CDC also tests susceptibility of influenza viruses to antiviral medications including the neuraminidase inhibitors (oseltamivir, zanamivir, and peramivir) and the PA endonuclease inhibitor baloxavir.
CDC genetically characterized 369 influenza viruses collected in the U.S. from September 29, 2019 to December 7, 2019.
| Virus Subtype or Lineage | Genetic Characterization | ||||
|---|---|---|---|---|---|
| Total No. of Subtype/Lineage Tested | Clade | Number (% of subtype/lineage tested) | Subclade | Number (% of subtype/lineage tested) | |
| A/H1 | 81 | ||||
| 6B.1A | 81 (100%) | ||||
| A/H3 | 132 | ||||
| 3C.2a | 132 (100%) | 2a1 | 132 (100%) | ||
| 2a2 | 0 | ||||
| 2a3 | 0 | ||||
| 2a4 | 0 | ||||
| 3C.3a | 0 | 3a | 0 | ||
| B/Victoria | 142 | ||||
| V1A | 142 (100%) | V1A | 0 | ||
| V1A.1 | 22 (15.5%) | ||||
| V1A.3 | 120 (84.5%) | ||||
| B/Yamagata | 14 | ||||
| Y3 | 14 (100%) | ||||
CDC antigenically characterizes a subset of influenza viruses by hemagglutination inhibition (HI) or neutralization based Focus Reduction assays (FRA). Antigenic drift is evaluated by comparing antigenic properties of cell-propagated reference viruses representing currently recommended vaccine components with those of cell-propagated circulating viruses. CDC antigenically characterized 61 influenza viruses collected in the U.S. from September 29, 2019 to December 7, 2019.
Influenza A Viruses
- A (H1N1)pdm09: Eighteen A(H1N1)pdm09 viruses were antigenically characterized by HI with ferret antisera, and all were antigenically similar (reacting at titers that were within 4-fold of the homologous virus titer) to cell-propagated A/Brisbane/02/2018-like reference viruses representing the A(H1N1)pdm09 component for the 2019-20 Northern Hemisphere influenza vaccines.
- A (H3N2): Seventeen A(H3N2) viruses were antigenically characterized by FRA with ferret antisera, and 12 (70.6%) were antigenically similar to cell-propagated A/Kansas/14/2017-like reference viruses representing the A(H3N2) component for the 2019-20 Northern Hemisphere influenza vaccines.
Influenza B Viruses
- B/Victoria: Sixteen B/Victoria lineage viruses, including viruses from both co-circulating sub-clades, were antigenically characterized by HI with ferret antisera, and 10 (62.5%) were antigenically similar to cell-propagated B/Colorado/06/2017-like reference viruses representing the B/Victoria component for the 2019-20 Northern Hemisphere influenza vaccines.
- B/Yamagata: Ten B/Yamagata lineage viruses were antigenically characterized by HI with ferret antisera, and all 10 (100%) were antigenically similar to cell-propagated B/Phuket/3073/2013-like reference viruses representing the B/Yamagata component for the 2019-20 Northern Hemisphere influenza vaccines.
CDC assesses susceptibility of influenza viruses to the antiviral medications oseltamivir, zanamivir, peramivir, and baloxavir using next generation sequence analysis supplemented by laboratory assays. Viruses collected in the U.S. since September 29, 2019 were tested for antiviral susceptibility as follows:
| Antiviral Medication | Total Viruses | A/H1 | A/H3 | B/Victoria | B/Yamagata | ||
|---|---|---|---|---|---|---|---|
| Neuraminidase Inhibitors | |||||||
| Oseltamivir | Viruses Tested | 415 | 81 | 130 | 190 | 14 | |
| Reduced Inhibition | (0.0%) | (0.0%) | (0.0%) | (0.0%) | (0.0%) | ||
| Highly Reduced Inhibition | 1 (0.2%) | 1 (1.2%) | (0.0%) | (0.0%) | (0.0%) | ||
| Peramivir | Viruses Tested | 415 | 81 | 130 | 190 | 14 | |
| Reduced Inhibition | (0.0%) | (0.0%) | (0.0%) | (0.0%) | (0.0%) | ||
| Highly Reduced Inhibition | 1 (0.2%) | 1 (1.2%) | (0.0%) | (0.0%) | (0.0%) | ||
| Zanamivir | Viruses Tested | 415 | 81 | 130 | 190 | 14 | |
| Reduced Inhibition | 1 (0.2%) | (0.0%) | (0.0%) | 1 (0.5%) | (0.0%) | ||
| Highly Reduced Inhibition | (0.0%) | (0.0%) | (0.0%) | (0.0%) | (0.0%) | ||
| PA Endonuclease Inhibitor | |||||||
| Baloxavir | Viruses Tested | 336 | 75 | 122 | 126 | 13 | |
| Reduced Susceptibility | (0.0%) | (0.0%) | (0.0%) | (0.0%) | (0.0%) | ||
<!–Influenza A Viruses
- A (H1N1)pdm09: Phylogenetic analysis of the HA genes from 63 A(H1N1)pdm09 viruses showed that all belonged to clade 6B.1. Fifty-seven A(H1N1)pdm09 viruses were antigenically characterized, and 57 (100%) were antigenically similar (analyzed using HI with ferret antisera) to A/Michigan/45/2015 (6B.1), a cell-propagated A/Michigan/45/2015-like reference virus representing the A(H1N1)pdm09 component for the 2018-2019 Northern Hemisphere influenza vaccines.
- A (H3N2): Phylogenetic analysis of the HA genes from 64 A(H3N2) viruses revealed extensive genetic diversity with multiple clades/subclades co-circulating. The HA genes of circulating viruses belonged to clade 3C.2a (n=24), subclade 3C.2a1 (n=35) or clade 3C.3a (n=5). Thirty influenza A(H3N2) viruses were antigenically characterized by FRA with ferret antisera, and 28 (93.3%) A(H3N2) viruses tested were well-inhibited (reacting at titers that were within fourfold of the homologous virus titer) by ferret antisera raised against A/Singapore/INFIMH-16-0019/2016 (3C.2a1), a cell-propagated A/Singapore/INFIMH-16-0019/2016 -like reference virus representing the A(H3N2) component of 2018-2019 Northern Hemisphere influenza vaccines.
Influenza B Viruses
- B/Victoria: Phylogenetic analysis of 10 B/Victoria-lineage viruses indicate that all HA genes belonged to genetic clade V1A, however genetic subclades which are antigenically distinct have emerged. The majority of recent B/Victoria-lineage viruses belonged to a subclade of viruses with a 6-nucleotide deletion (encoding amino acids 162 and 163) in the HA (V1A.1, previously abbreviated as V1A-2Del). In addition, a small number of B/Victoria-lineage viruses have a three amino acid deletion (162-164) in the HA protein (abbreviated as V1A-3Del). Nine (90%) B/Victoria lineage viruses were well-inhibited by ferret antisera raised against cell-propagated B/Colorado/06/2017-like (V1A.1) reference virus, representing the B/Victoria lineage component of 2018-2019 Northern Hemisphere influenza vaccines. One (10%) B/Victoria lineage virus reacted poorly (at titers that were 8-fold or greater reduced compared with the homologous virus titer) with ferret antisera raised against cell-propagated B/Colorado/06/2017-like reference virus, and belonged to clade V1A.
- B/Yamagata: Phylogenetic analysis of 33 influenza B/Yamagata-lineage viruses indicate that the HA genes belonged to clade Y3. A total of 32 influenza B/Yamagata-lineage viruses were antigenically characterized, and all were antigenically similar to cell-propagated B/Phuket/3073/2013 (Y3), the reference vaccine virus representing the influenza B/Yamagata-lineage component of the 2018-2019 Northern Hemisphere quadrivalent vaccines.
The majority of U.S. viruses submitted for characterization come from state and local public health laboratories. Due to Right Size Roadmap considerations, specimen submission guidance to laboratories is that, if available, 2 influenza A(H1N1)pdm09, 2 influenza A(H3N2), and 2 influenza B viruses be submitted every other week. Therefore, the numbers of each virus type/subtype characterized should be more balanced across subtypes/lineages but will not reflect the actual proportion of circulating viruses. In the figure below, the results of tests performed by public health labs are shown on the left and CDC sequence results (by genetic clade/subclade) are shown on the right.

View Chart Data | View Full Screen | View PowerPoint Presentation
- High – Puerto Rico and 11 states (Alabama, Arkansas, Georgia, Mississippi, Nebraska, New Mexico, South Carolina, Tennessee, Texas, Virginia, and Washington)
- Moderate – New York City and 11 states (Arizona, Colorado, Connecticut, Hawaii, Kentucky, Maryland, Minnesota, Nevada, New Jersey, Oklahoma, and Oregon)
- Low – District of Columbia and nine states (California, Florida, Illinois, Kansas, Massachusetts, New York, North Carolina, Pennsylvania, and Wisconsin)
- Minimal – 18 states (Alaska, Delaware, Idaho, Indiana, Iowa, Maine, Michigan, Missouri, Montana, New Hampshire, North Dakota, Ohio, Rhode Island, South Dakota, Utah, Vermont, West Virginia, and Wyoming)
- Data were insufficient to calculate an ILI activity level from the U.S. Virgin Islands and Louisiana.
- Widespread – 23 states (Alabama, Arizona, California, Connecticut, Georgia, Idaho, Indiana, Kentucky, Louisiana, Maryland, Massachusetts, Nebraska, Nevada, New Mexico, New York, North Carolina, Oregon, Pennsylvania, South Carolina, Tennessee, Texas, Virginia and Washington)
- Regional – Puerto Rico and 14 states (Arkansas, Colorado, Florida, Illinois, Michigan, Minnesota, Mississippi, Montana, New Jersey, Ohio, Oklahoma, Rhode Island, Utah and Wisconsin)
- Local – 12 states (Delaware, Hawaii, Iowa, Kansas, Maine, Missouri, New Hampshire, North Dakota, South Dakota, Vermont, West Virginia and Wyoming)
- Sporadic – the District of Columbia, the U.S. Virgin Islands and one state (Alaska)
- Guam did not report.
Antiviral Resistance:
During May 20-October 6, 2018, 156 specimens (61 influenza A(H1N1)pdm09, 51 influenza A(H3N2), and 44 influenza B viruses) collected in the United States were tested for susceptibility to the neuraminidase inhibitors (oseltamivir, zanamivir, and peramivir). All tested viruses were sensitive to all three recommended antiviral medications.
| Antiviral Medication | Total Viruses | A/H1 | A/H3 | B/Victoria | B/Yamagata | ||
|---|---|---|---|---|---|---|---|
| Neuraminidase Inhibitors | Oseltamivir | Viruses Tested | 2,547 | 1,183 | 969 | 215 | 180 |
| Reduced | 2 (0.1%) | 2 (0.2%) | 0 (0%) | 0 (0%) | 0 (0%) | ||
| Highly Reduced | 4 (0.2%) | 4 (0.3%) | 0 (0%) | 0 (0%) | 0 (0%) | ||
| Peramivir | Viruses Tested | 2,547 | 1,183 | 969 | 215 | 180 | |
| Reduced | 0 (0%) | 0 (0%) | 0 (0%) | 0 (0%) | 0 (0%) | ||
| Highly Reduced | 4 (0.2%) | 4 (0.3%) | 0 (0%) | 0 (0%) | 0 (0%) | ||
| Zanamivir | Viruses Tested | 2,547 | 1,183 | 969 | 215 | 180 | |
| Reduced | 0 (0%) | 0 (0%) | 0 (0%) | 0 (0%) | 0 (0%) | ||
| Highly Reduced | 0 (0%) | 0 (0%) | 0 (0%) | 0 (0%) | 0 (0%) | ||
| PA Cap-Dependent Endonuclease Inhibitor | Baloxavir Marboxil | Viruses Tested | 2,547 | 1,162 | 964 | 229 | 187 |
| Decreased Susceptibility | 0 (0%) | 0 (0%) | 0 (0%) | 0 (0%) | 0 (0%) | ||
While all of the recently circulating influenza viruses are susceptible to the neuraminidase inhibitor antiviral medications oseltamivir, zanamivir, and peramivir; rare sporadic instances of oseltamivir-resistant and peramivir-resistant influenza A(H1N1)pdm09 viruses and oseltamivir-resistant influenza A(H3N2) viruses have been detected worldwide. Antiviral treatment as early as possible is recommended for patients with confirmed or suspected influenza who have severe, complicated, or progressive illness; who require hospitalization; or who are at high risk for serious influenza-related complications. Additional information on recommendations for treatment and chemoprophylaxis of influenza virus infection with antiviral agents is available at http://www.cdc.gov/flu/antivirals/index.htm.
Outpatient Illness Surveillance
ILINet
Nationwide during week 49, 3.2% of patient visits reported through the U.S. Outpatient Influenza-like Illness Surveillance Network (ILINet) were due to influenza-like illness (ILI). This percentage is above the national baseline of 2.4%. The decrease in the percentage of patient visits for ILI during week 49 compared to week 48 may be influenced in part by a reduction in routine healthcare visits surrounding the Thanksgiving holiday (occurring during week 48) as has occurred during previous seasons.

View Chart Data | View Full Screen
On a regional level, the percentage of outpatient visits for ILI ranged from 1.8% to 5.7% during week 49. All regions reported a percentage of outpatient visits for ILI which is equal to or above their region-specific baselines.
ILI Activity Map
Data collected in ILINet are used to produce a measure of ILI activity* by state.
During week 49, the following ILI activity levels were experienced:
*Data collected in ILINet may disproportionally represent certain populations within a state, and therefore, may not accurately depict the full picture of influenza activity for the whole state. Differences in the data presented here by CDC and independently by some state health departments likely represent differing levels of data completeness with data presented by the state likely being the more complete.
Additional information about medically attended visits for ILI for current and past seasons:
Surveillance Methods | FluView Interactive: National, Regional, and State Data or ILI Activity Map
Geographic Spread of Influenza as Assessed by State and Territorial Epidemiologists
The influenza activity reported by state and territorial epidemiologists indicates geographic spread of influenza viruses but does not measure the severity of influenza activity.
During week 49 the following influenza activity was reported:
Additional geographic spread surveillance information for current and past seasons:
Surveillance Methods | FluView Interactive
Influenza-Associated Hospitalizations
The Influenza Hospitalization Surveillance Network (FluSurv-NET) conducts population-based surveillance for laboratory-confirmed influenza-related hospitalizations in select counties in the Emerging Infections Program (EIP) states and Influenza Hospitalization Surveillance Project (IHSP) states.
A total of 1,139 laboratory-confirmed influenza-associated hospitalizations were reported by FluSurv-NET sites between October 1, 2019 and December 7, 2019. The overall hospitalization rate was 3.9 per 100,000 population. The highest rate of hospitalization was among adults aged ≥65 (9.4 per 100,000 population), followed by children aged 0-4 (7.5 per 100,000 population) and adults aged 50-64 (4.1 per 100,000 population). Among 1,139 hospitalizations, 627 (55.0%) were associated with influenza A virus, 499 (43.8%) with influenza B virus, 6 (0.5%) with influenza A virus and influenza B virus co-infection, and 7 (0.6%) with influenza virus for which the type was not determined. Among those with influenza A subtype information, 103 (70.5%) were A(H1N1)pdm09 virus and 43 (29.5%) were A(H3N2).
View Full Screen
Additional hospitalization surveillance information for current and past seasons and additional age groups:
Surveillance Methods | FluView Interactive
<!–
FluSurv-NET data are preliminary and displayed as they become available. Therefore, figures are based on varying denominators as some variables represent information that may require more time to be collected. Data are refreshed and updated weekly. Asthma includes a medical diagnosis of asthma or reactive airway disease; Cardiovascular diseases include conditions such as coronary heart disease, cardiac valve disorders, congestive heart failure, and pulmonary hypertension; does not include isolated hypertension; Chronic lung diseases include conditions such as chronic obstructive pulmonary disease, bronchiolitis obliterans, chronic aspiration pneumonia, and interstitial lung disease; Immune suppression includes conditions such as immunoglobulin deficiency, leukemia, lymphoma, HIV/AIDS, and individuals taking immunosuppressive medications; Metabolic disorders include conditions such as diabetes mellitus; Neurologic diseases include conditions such as seizure disorders, cerebral palsy, and cognitive dysfunction; Neuromuscular diseases include conditions such as multiple sclerosis and muscular dystrophy; Obesity was assigned if indicated in patient’s medical chart or if body mass index (BMI) >30 kg/m2; Pregnancy percentage calculated using number of female cases aged between 15 and 44 years of age as the denominator; Renal diseases include conditions such as acute or chronic renal failure, nephrotic syndrome, glomerulonephritis, and impaired creatinine clearance; No known condition indicates that the case did not have any known high risk medical condition indicated in medical chart at the time of hospitalization.
–>
Pneumonia and Influenza (P&I) Mortality Surveillance
Based on National Center for Health Statistics (NCHS) mortality surveillance data available on December 12, 2019, 5.0% of the deaths occurring during the week ending November 30, 2019 (week 48) were due to P&I. This percentage is below the epidemic threshold of 6.5% for week 48.
View Chart Data | View Full Screen
Additional pneumonia and influenza mortality surveillance information for current and past seasons:
Surveillance Methods | FluView Interactive
Influenza-Associated Pediatric Mortality
Four influenza-associated pediatric deaths were reported to CDC during week 49. One death occurred during week 47 (the week ending November 23, 2019) and was associated with an influenza A virus for which no subtyping was performed. Three deaths occurred during week 48 (the week ending November 30, 2019). One death was associated with an influenza B/Victoria virus, one was associated with an influenza B virus with no lineage determined, and one was associated with an influenza A(H1N1)pdm09 virus.
A total of 10 influenza-associated pediatric deaths occurring during the 2019-2020 season have been reported to CDC. Six cases tested positive for influenza B; three of these cases had the lineage determined and all were B/Victoria viruses. Four cases tested positive for influenza A. Two of these cases had subtyping performed and both were A(H1N1)pdm09 viruses.
View Full Screen
Additional pediatric mortality surveillance information for current and past seasons:
Surveillance Methods | FluView Interactive
Additional National and International Influenza Surveillance Information
FluView Interactive: FluView includes enhanced web-based interactive applications that can provide dynamic visuals of the influenza data collected and analyzed by CDC. These FluView Interactive applications allow people to create customized, visual interpretations of influenza data, as well as make comparisons across flu seasons, regions, age groups and a variety of other demographics. To access these tools, visit http://www.cdc.gov/flu/weekly/fluviewinteractive.htm
National Institute for Occupational Safety and Health: Monthly surveillance data on the prevalence of health-related workplace absenteeism among full-time workers in the United States are available from NIOSH at https://www.cdc.gov/niosh/topics/absences/default.html
U.S. State and local influenza surveillance:Select a jurisdiction below to access the latest local influenza information
World Health Organization: Additional influenza surveillance information from participating WHO member nations is available through FluNet and the Global Epidemiology Reports.
WHO Collaborating Centers for Influenza located in Australia, China, Japan, the United Kingdom, and the United States (CDC in Atlanta, Georgia).
Europe: For the most recent influenza surveillance information from Europe, please see WHO/Europe and the European Centre for Disease Prevention and Control at http://www.flunewseurope.org/.
Public Health Agency of Canada: The most up-to-date influenza information from Canada is available at http://www.phac-aspc.gc.ca/fluwatch/
Public Health England: The most up-to-date influenza information from the United Kingdom is available at https://www.gov.uk/government/statistics/weekly-national-flu-reports
White Island: SAS soldiers recover six bodies while divers hunt for missing two Kiwi tour guides
December 13th, 2019“……
- New Zealand Defence Force have recovered six of the eight bodies of the White Island volcano victims Friday
- Two bodies could not be found because they are under water but police say they will continue the search
- Divers have been sent out to search the waters after one of the bodies was spotted in the ocean on Tuesday
- Mission started at first light despite increased chance volcano would erupt again, with high alert being issued
- Six Australians and two New Zealanders were believed to be on island when the deadly eruption happened
- Relieved families were seen hugging, crying and clapping when told bodies had been removed from island….”
WHO and its consultants
December 13th, 2019“…..But Tedros appears to have embraced change, of a sort. Halfway through his five-year term, his reform — known as “the transformation” — is still in progress. And while he has offered WHO staff opportunities to engage in the process, the agency is also crawling with outside consultants, current and former WHO staffers told Vox.
“The one thing that WHO staff didn’t want,” a senior official who was involved in the reform process, “is a McKinsey type of reform,” using the well-known firm as a shorthand for what they’ve seen consultants bring to WHO and other health agencies over the years: “musical chairs,” “cost cutting,” and “debunked management fads.”
In addition to McKinsey, WHO confirmed they’ve worked with five other consultancies during the transformation: BCG, Deloitte, Preva Group, Seek Development, and most recently, Deliver Associates, which has a multi-year contract worth $3.85 million. The total value of the consultant contracts is about $12 million, at least a quarter of which has been paid for directly by the Bill and Melinda Gates Foundation, one of the most powerful players in global health…..”


