CDC: 2015-2016 Influenza Season Week 1 ending January 9, 2016
January 18th, 2016Background:
The Centers for Disease Control and Prevention’s (CDC) Influenza Division collects, compiles, and analyzes information on influenza activity year-round in the United States and produces FluView, a weekly influenza surveillance report, and FluView Interactive. The U.S. influenza surveillance system provides information in five categories collected from nine data sources. This is the first report of the 2015-2016 influenza season, which began on October 4, 2015.
The five categories and nine data components of CDC influenza surveillance are:
- Viral Surveillance:U.S. World Health Organization (WHO) collaborating laboratories, the National Respiratory and Enteric Virus Surveillance System (NREVSS), and human infection with novel influenza A virus case reporting;
- Mortality:National Center for Health Statistics (NCHS) Mortality Surveillance System, 122 Cities Mortality Reporting System and influenza-associated pediatric deaths;
- Hospitalizations:Influenza Hospitalization Network (FluSurv-NET) including the Emerging Infections Program (EIP) and three additional states;
- Outpatient Illness Surveillance:U.S. Outpatient Influenza-like Illness Surveillance Network (ILINet);
- Geographic Spread of Influenza:State and territorial epidemiologists’ reports.
An overview of the CDC influenza surveillance system, including methodology and detailed descriptions of each data component, is available at: http://www.cdc.gov/flu/weekly/overview.htm.
–>
Synopsis:
During week 1 (January 3-9, 2016), laboratory data indicated that influenza activity increased slightly in the United States.
- Viral Surveillance: The most frequently identified influenza virus type reported by public health laboratories during week 1 was influenza A, with influenza A (H1N1)pdm09 viruses predominating. The percentage of respiratory specimens testing positive for influenza in clinical laboratories was low.
<!–
- Novel Influenza A Virus: One human infection with a novel influenza A virus was reported.
–>
- Pneumonia and Influenza Mortality: The proportion of deaths attributed to pneumonia and influenza (P&I) was below their system-specific epidemic threshold in both the NCHS Mortality Surveillance System and the 122 Cities Mortality Reporting System.
- Influenza-associated Pediatric Deaths: One influenza-associated pediatric death was reported.
- Influenza-associated Hospitalizations: A cumulative rate for the season of 1.5 laboratory-confirmed influenza-associated hospitalizations per 100,000 population was reported.
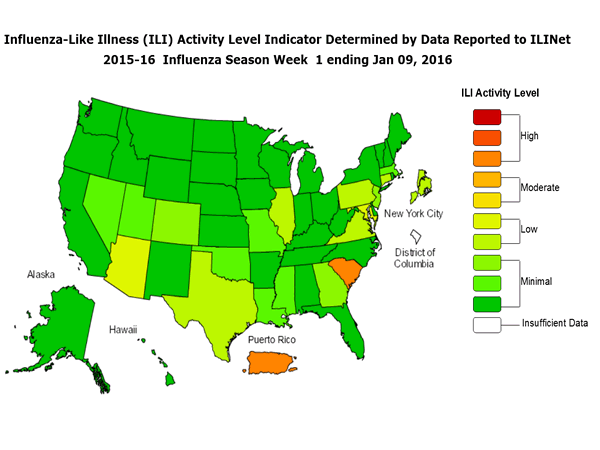
- Outpatient Illness Surveillance: The proportion of outpatient visits for influenza-like illness (ILI) was 2.0%, which is below the national baseline of 2.1%. Four of 10 regions reported ILI at or above region-specific baseline levels. Puerto Rico and one state experienced high ILI activity; New York City and seven states experienced low ILI activity; 42 states experienced minimal ILI activity; and the District of Columbia had insufficient data.
- Geographic Spread of Influenza: The geographic spread of influenza in Guam, Puerto Rico, and nine states were reported as regional; 11 states reported local activity; the U.S. Virgin Islands and 28 states reported sporadic activity; and the District of Columbia and two states reported no influenza activity.