Archive for January, 2018
Cape Town’s Water is Running Out
Wednesday, January 31st, 2018
Cape Town—a cosmopolitan city of 3.7 million people on South Africa’s western coast—is on the verge of running out of water. According to the city’s mayor, if current consumption patterns continue then drinking water taps will be turned off in April and people will have to start procuring water from one of 200 collection points throughout the city.
With key reservoirs standing at precariously low levels, the city forecasts that this so-called Day Zero will happen on April 12, 2018, though the exact date will depend on the weather and on consumption patterns in the coming months. The rainy season normally runs from May to September.
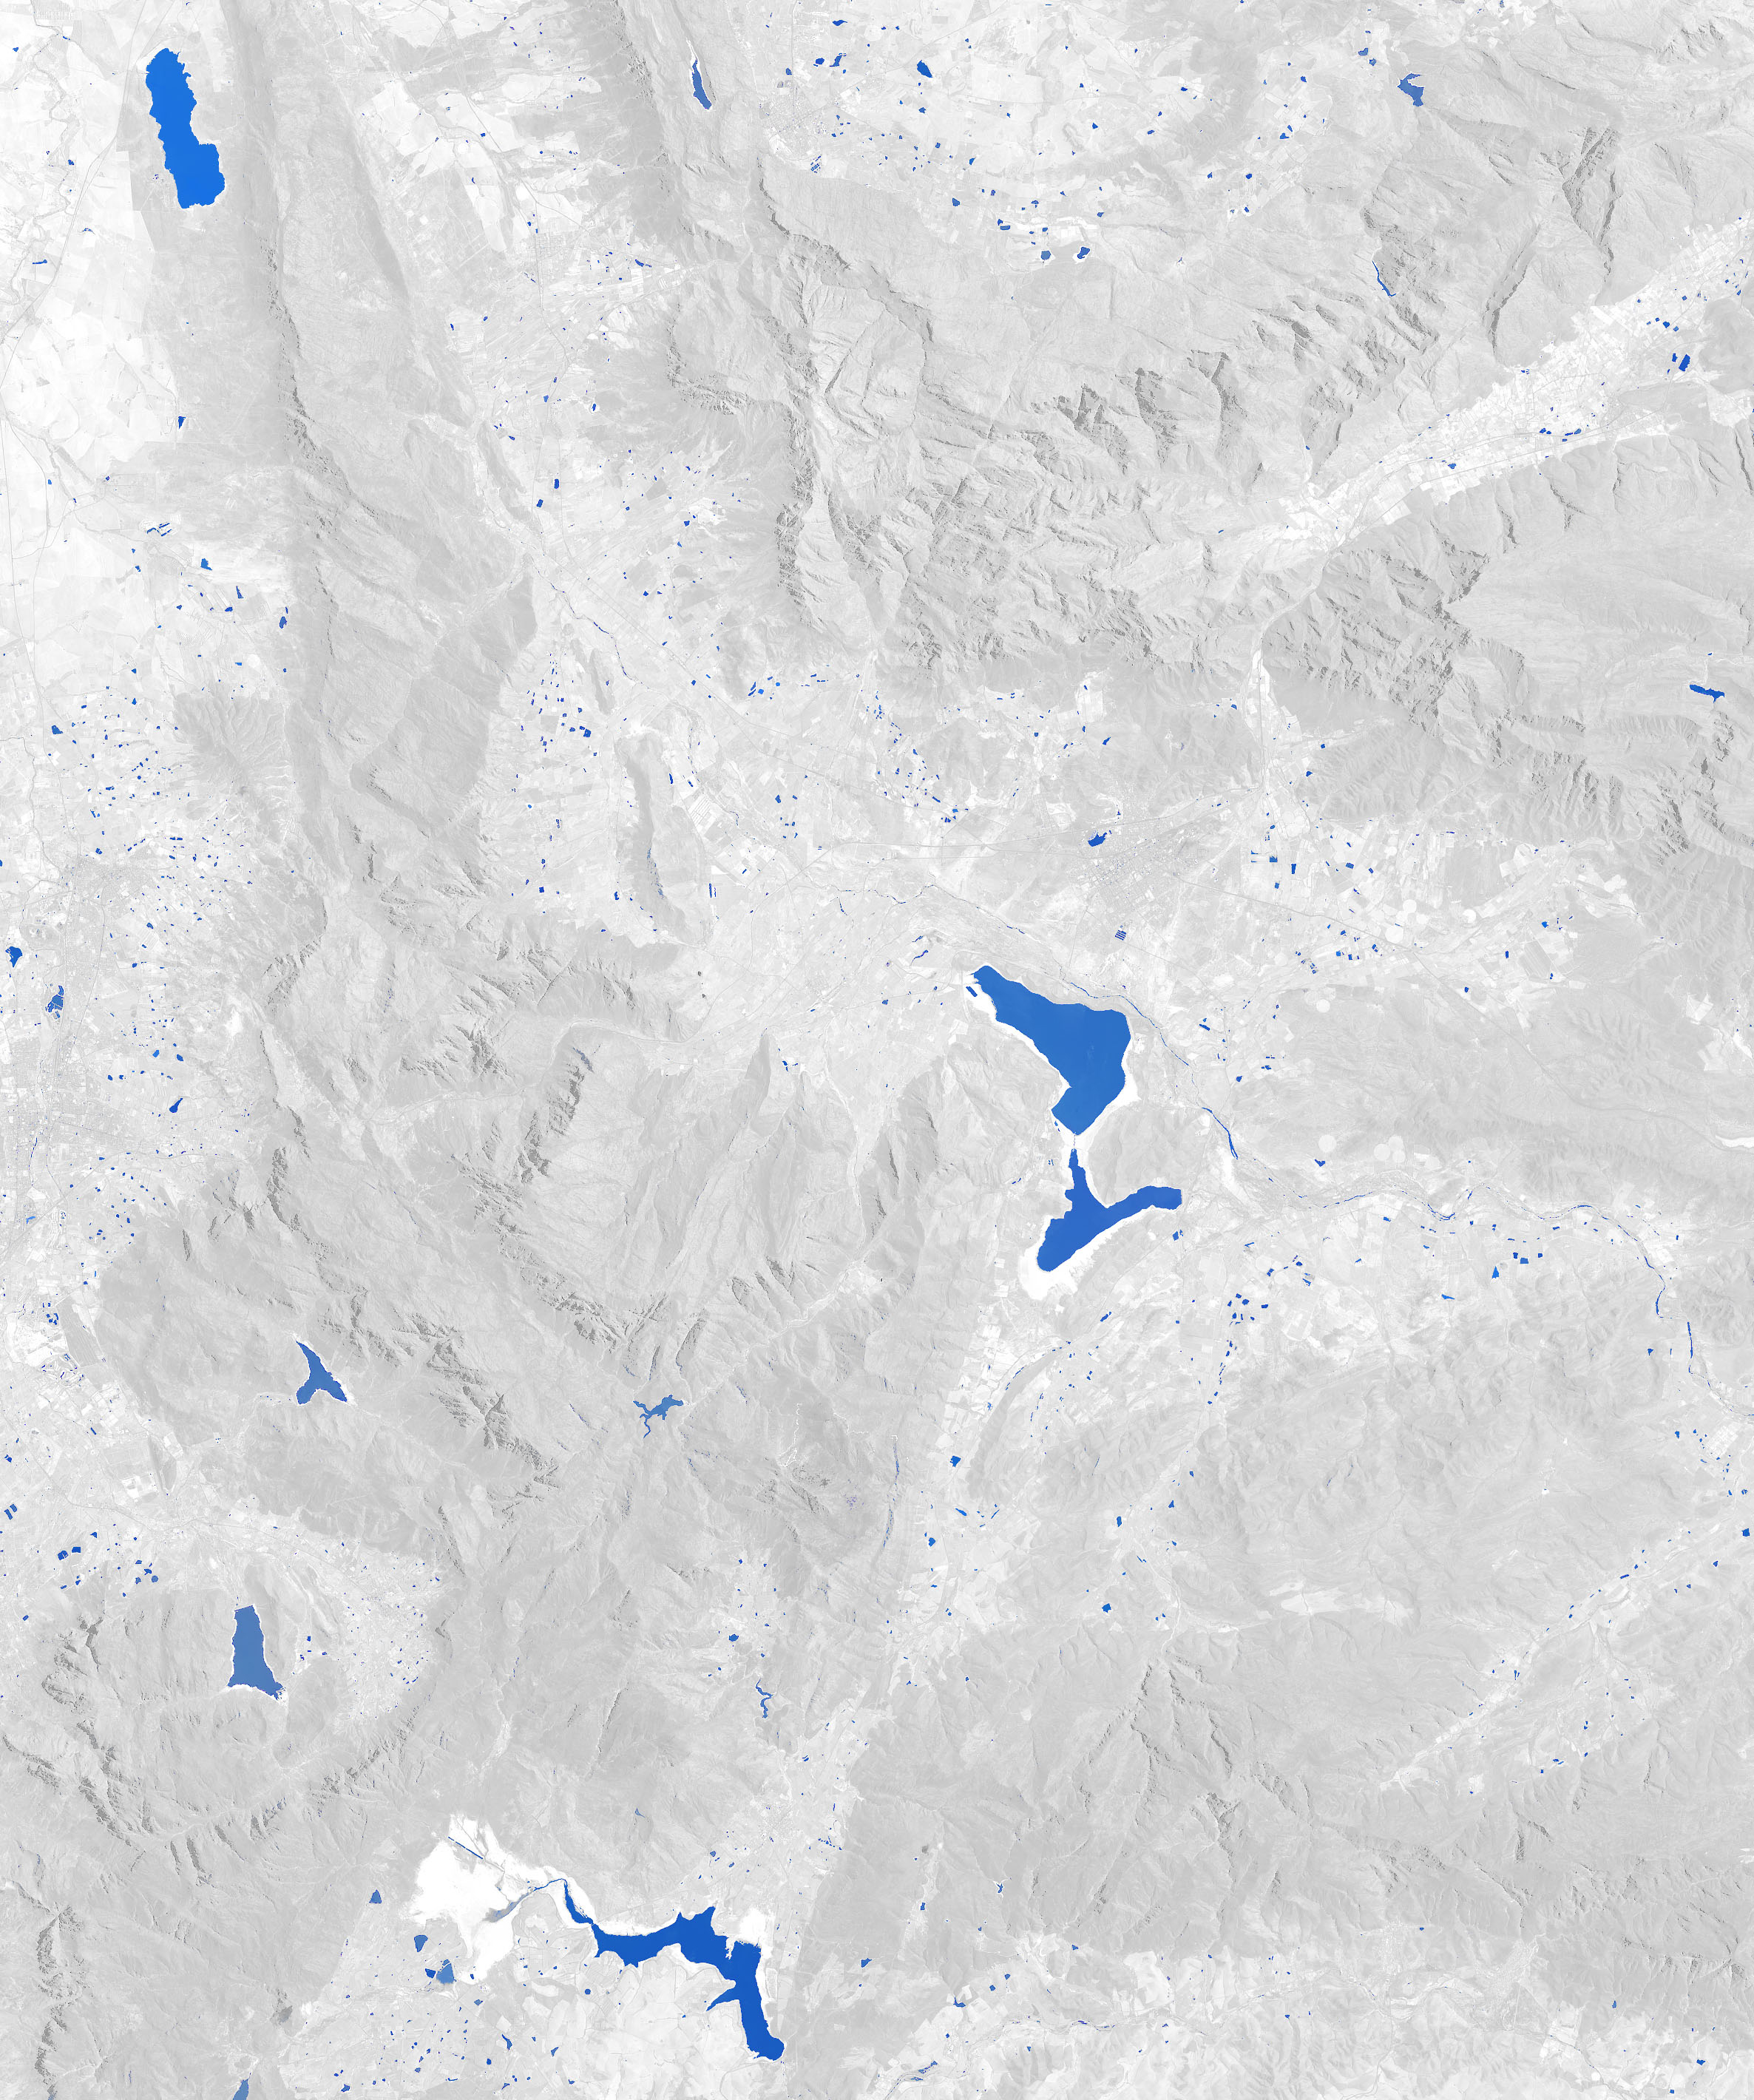
Cape Town’s six major reservoirs can collectively store 898,000 megaliters (230 billion gallons) of water, but they held just 26 percent of that amount as of January 29, 2018. Theewaterskloof Dam—the largest reservoir and the source of roughly half of the city’s water—is in the worst condition, with the water level at just 13 percent of capacity.
In practical terms, the amount of available water is even less than this number suggests because the last 10 percent of water in a reservoir is difficult to use. According to Cape Town’s disaster plan, Day Zero will happen when the system’s stored water drops to 13.5 percent of capacity. At that point, the water that remains will go to hospitals and certain settlements that rely on communal taps. Most people in the city will be left without tap water for drinking, bathing, or other uses.
The animated image at the top of the page shows how dramatically Theewaterskloof has been depleted between January 2014 and January 2018. The extent of the reservoir is shown with blue; non-water areas have been masked with gray in order to make it easier to distinguish how the reservoir has changed. Theewaterskloof was near full capacity in 2014. During the preceding year, the weather station at Cape Town airport tallied 682 millimeters (27 inches) of rain (515 mm is normal), making it one of the wettest years in decades. However, rains faltered in 2015, with just 325 mm falling. The next year, with 221 mm, was even worse. In 2017, the station recorded just 157 mm of rain.
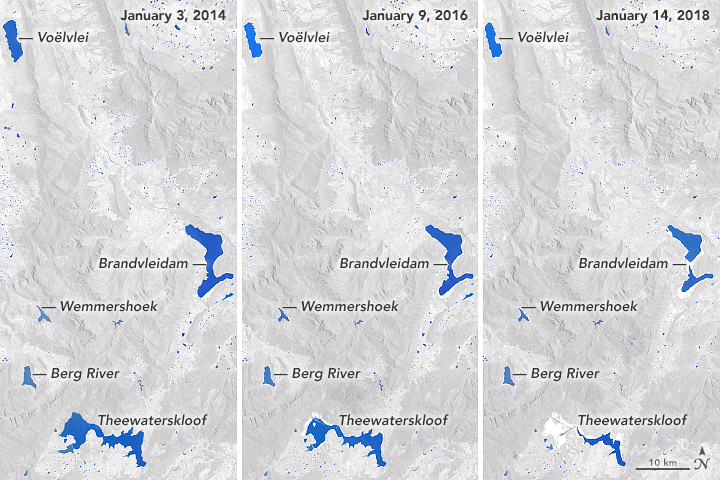
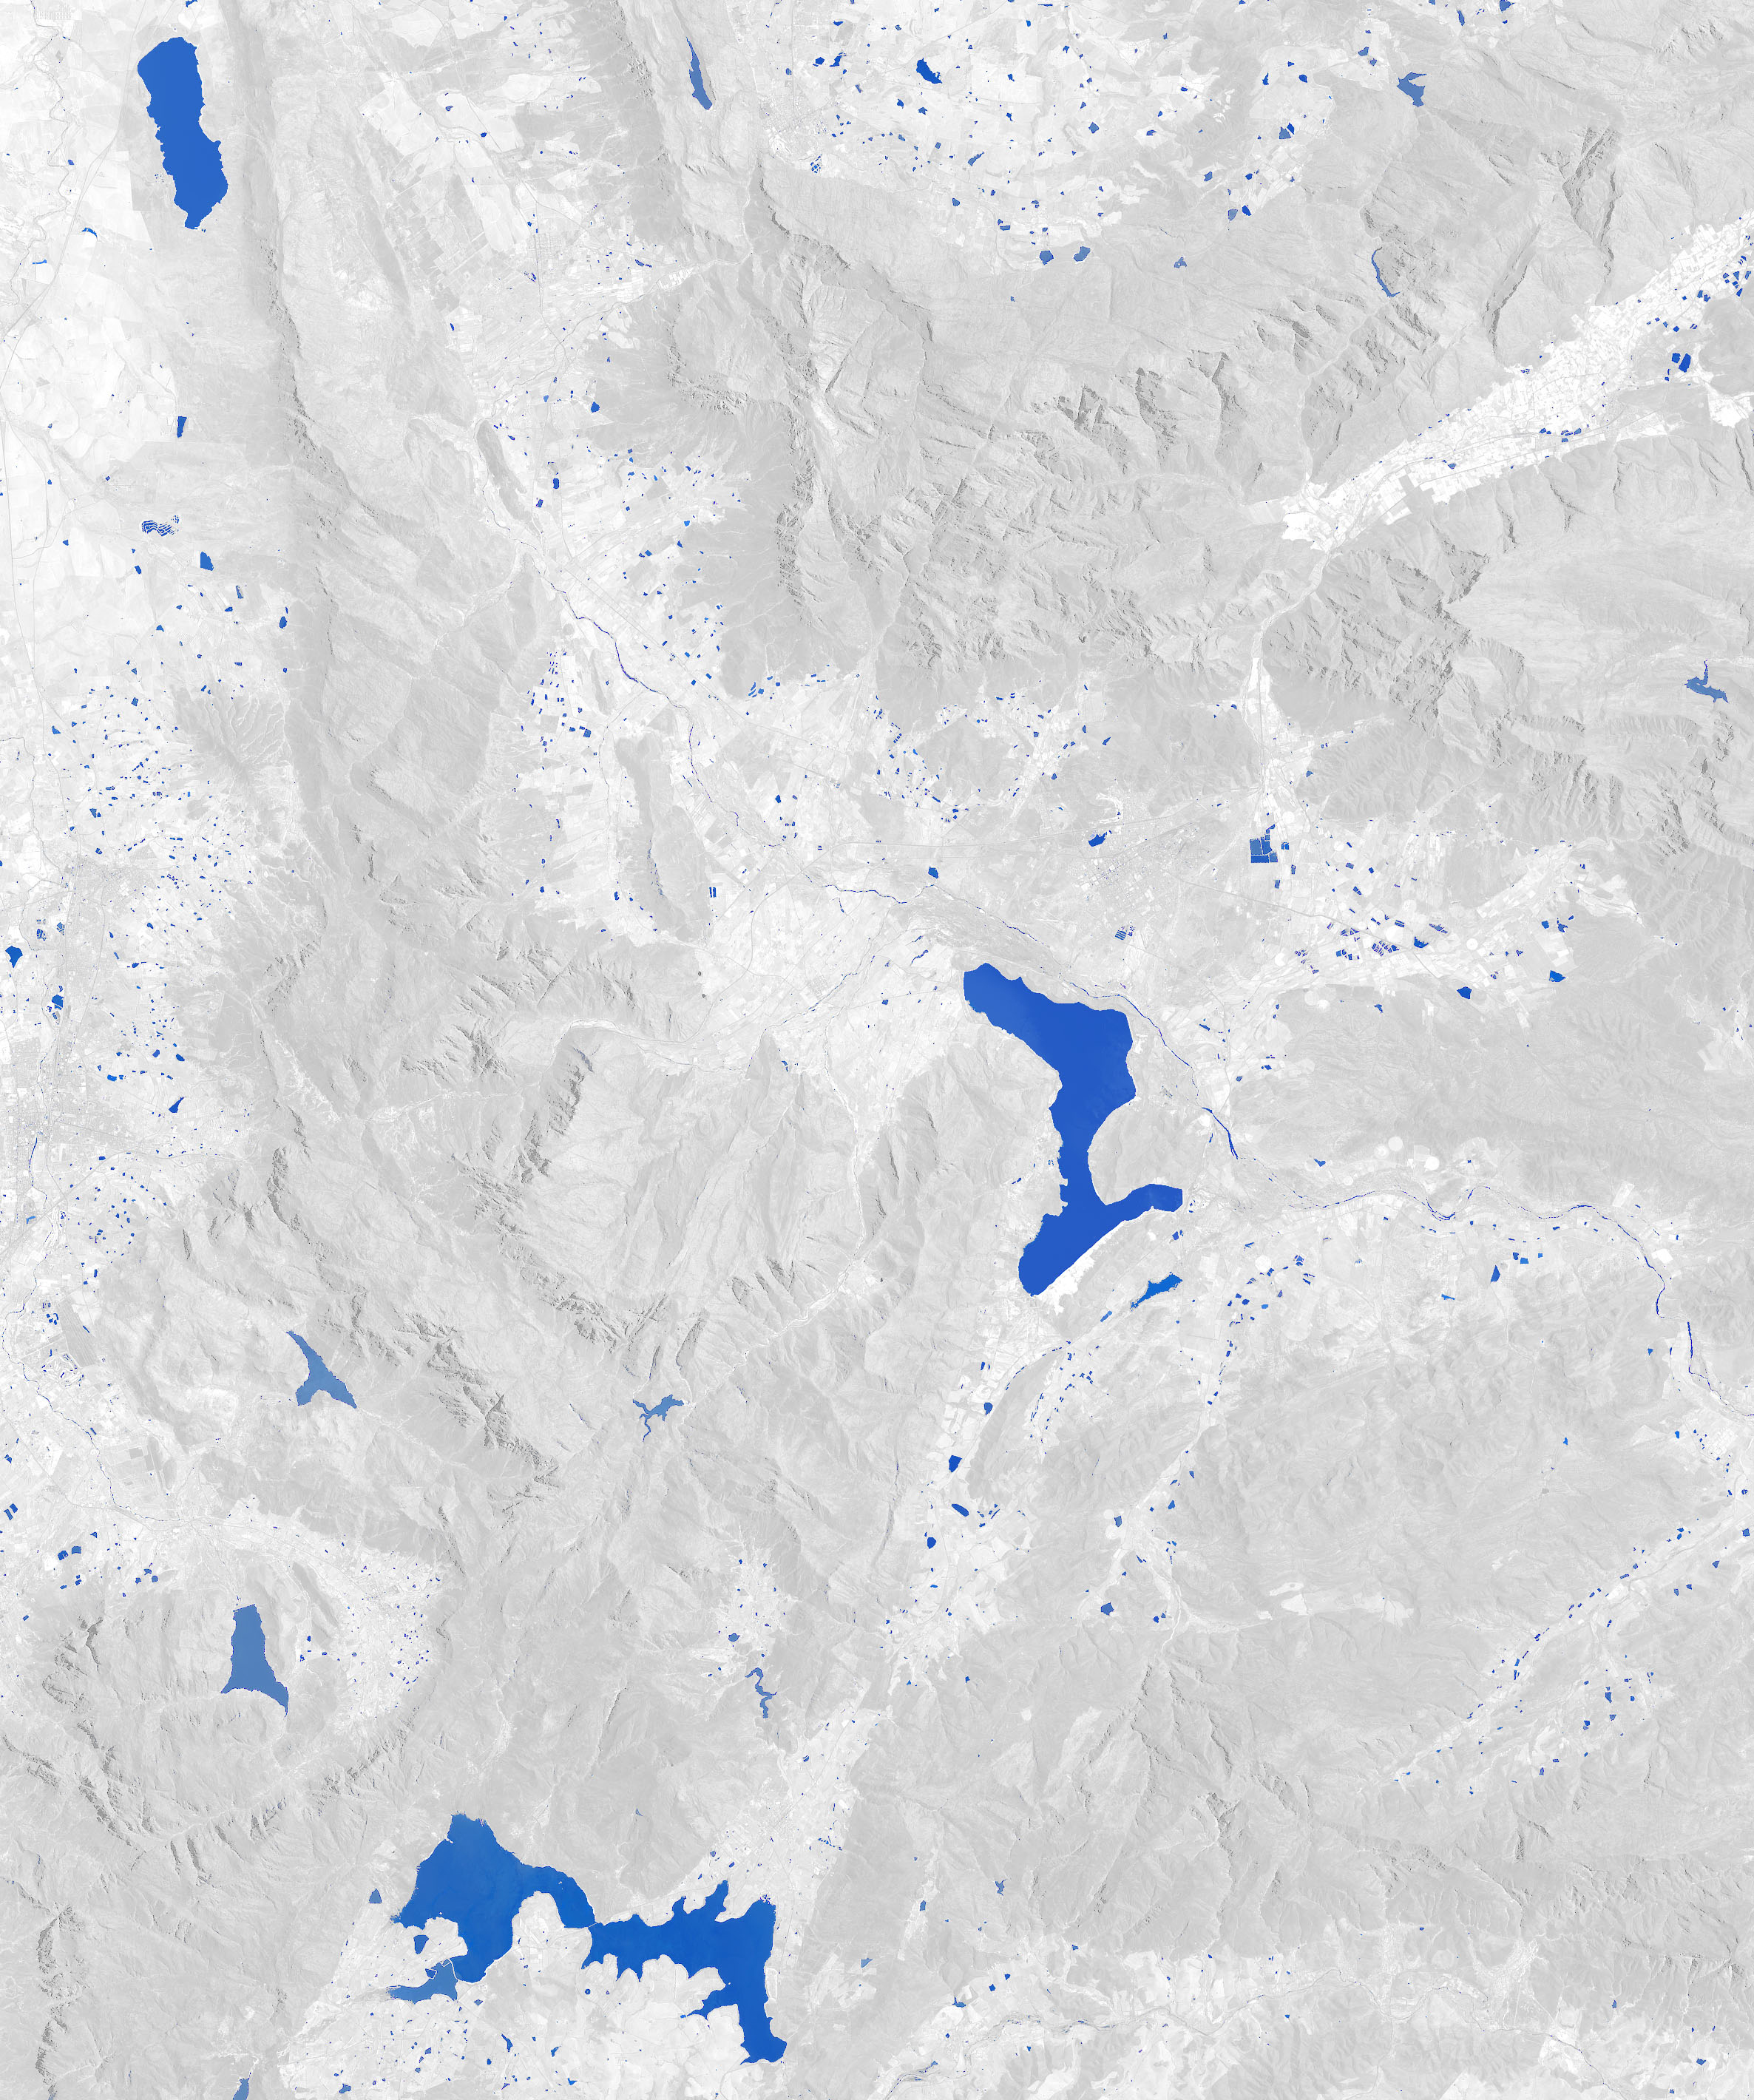
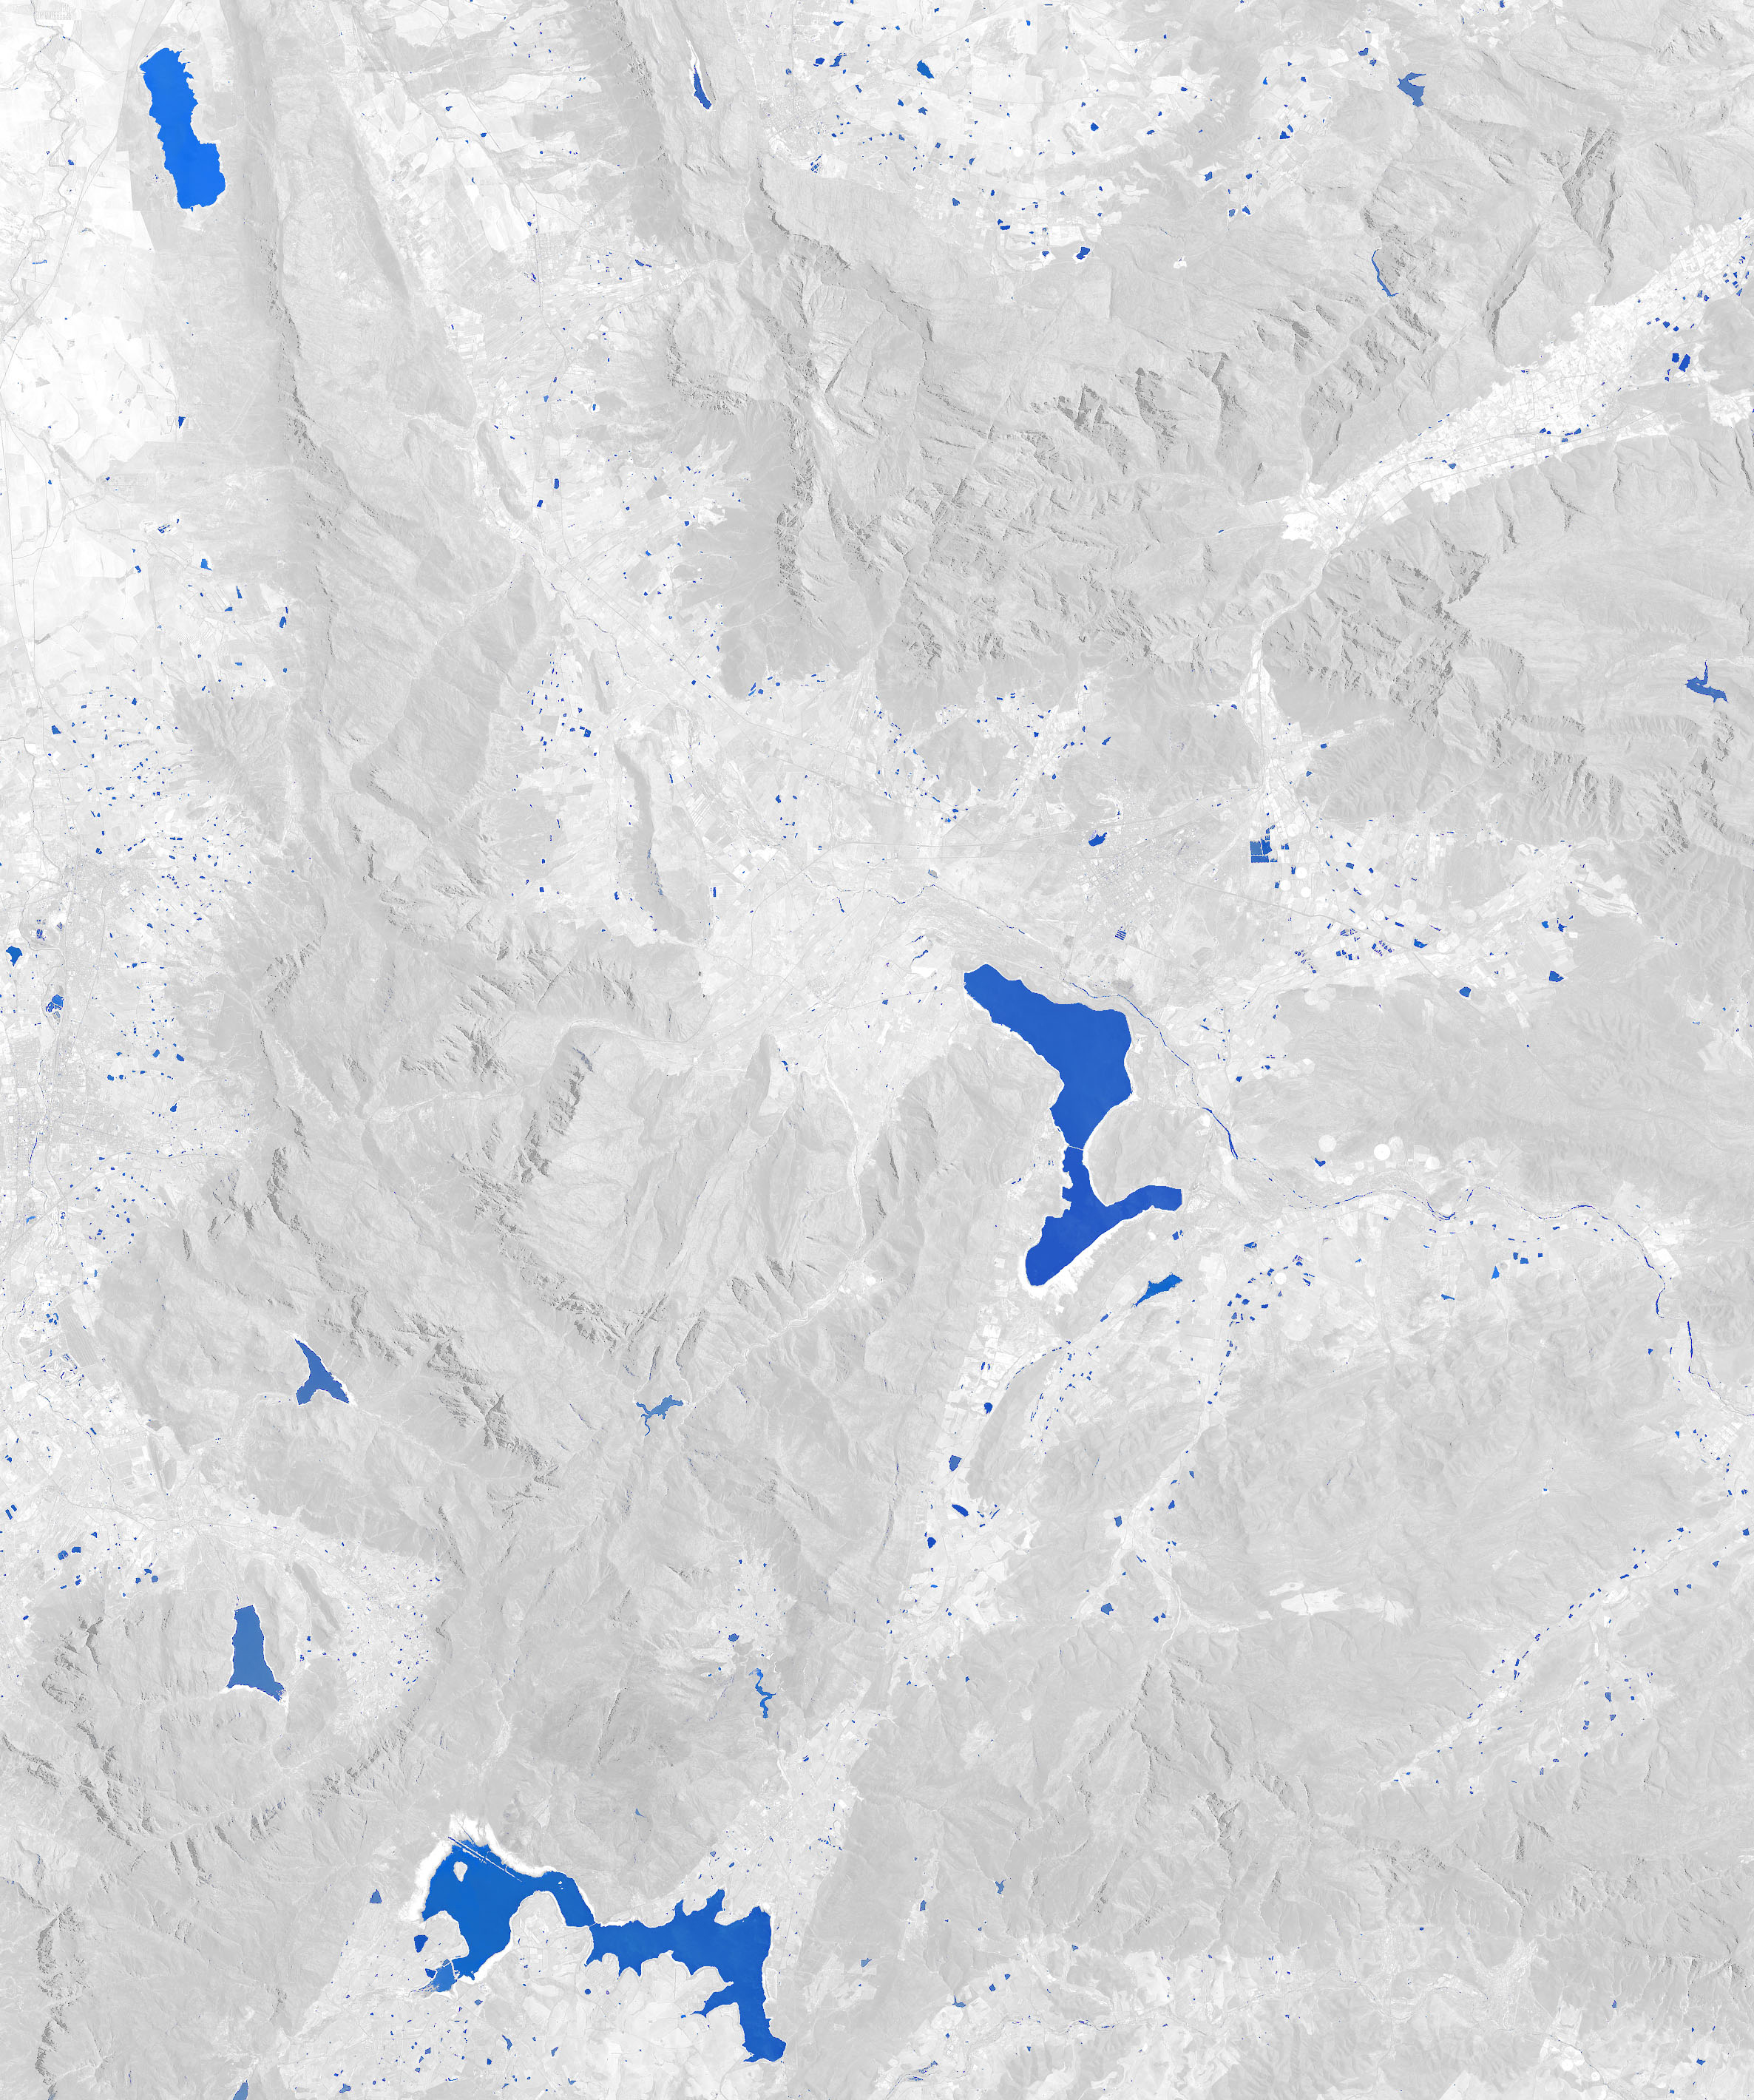
This trio of images shows how the three successive dry years took a toll on Cape Town’s water system. Voëlvlei, the second largest reservoir, has dropped to 18 percent of capacity. Some of the smaller reservoirs like the Berg River and Wemmershoek are still relatively full, but they store only a small fraction of the city’s water. One of the largest reservoirs in the area—Brandvlei—does not supply water to Cape Town; its water is used by farmers for irrigation.
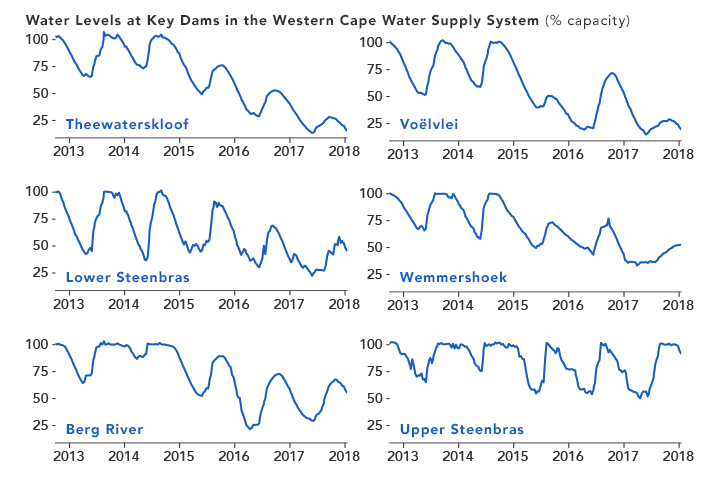
The line chart below details how water levels in the six key reservoirs have changed since 2013. Though the reservoirs are replenished each winter as the rains arrive, the trend at almost all of them has been downward. The one exception is Upper Steenbras, which holds about 4 percent of the city’s water and has been kept full because it is also used to generate electricity during peak demand. Also, the city is likely drawing down the largest reservoirs first to minimize how much water is lost to evaporation.
Piotr Wolski, a hydrologist at the Climate Systems Analysis Group at the University of Cape Town, has analyzed rainfall records dating back to 1923 to get a sense of the severity of the current drought compared to historical norms. His conclusion is that back-to-back years of such weak rainfall (like 2016-17) typically happens about once just every 1,000 years.
Population growth and a lack of new infrastructure has exacerbated the current water shortage. Between 1995 and 2018, the Cape Town’s population swelled by roughly 80 percent. During the same period, dam storage increased by just 15 percent.
The city did recently accelerate development of a plan to increase capacity at Voëlvlei Dam by diverting winter rainfall from the Berg River. The project had been scheduled for completion in 2024, but planners are now targeting 2019. The city is also working to build a series of desalination plants and to drill new groundwater wells that could produce additional water.
In the meantime, Cape Town authorities have put tight restrictions on residential water usage. New guidelines ban all use of drinking water for non-essential purposes, while urging people to use less than 50 liters (13 gallons) of water per person per day.
While many people are preparing for the water turn off in April, some observers see signs that Day Zero could still be averted. Kevin Winter, a hydrologist at the University the Cape Town, notes that by the end of January farmers will no longer be drawing from the system, meaning the water that remains may last a little longer. Overall, the agricultural sector uses about half of the water in the system.
-
References
- City of Cape Town (2018) Dam Levels. Accessed January 29, 2018.
- City of Cape Town (2018) Day Zero. Accessed January 29, 2018.
- Daily Maverick (2018, January 22) From the Inside: The Countdown to Day Zero. Accessed January 29, 2018.
- Ground Up (2017) Cape Town’s water crisis. Accessed January 29, 2018.
- Muller, M. (2017) Understanding Cape Town’s Water Crisis. Civil Engineering. Accessed January 29, 2018.
- National Integrated Water Information System (2018) Surface Water Storage. Accessed January 29, 2018.
- South African Weather Service (2017, January 26) Seasonal forecasts under the current drought conditions in the Western Cape. Accessed January 29, 2018.
- University of Cape Town (2018) The Big Six Monitor. Accessed January 29, 2018.
- University of Cape Town (2018, January 23) Five signs that Day Zero may be averted. Accessed January 29, 2018.
- Water Shedding Western Cape Why is everyone so worked up if Steenbras dam is full? Accessed January 29, 2018.
- Weather Underground (2018, January 19) It’s True: Cape Town’s Water Supply Is Three Months Away from a Shutdown. Accessed January 29, 2018.
- Western Cape Government (2017, October 30) The Cape Water Crisis — FAQs and honest answers. Accessed January 29, 2018.
NASA Earth Observatory images by Joshua Stevens, using Landsat data from the U.S. Geological Survey and water level data from South Africa’s Department of Water and Sanitation. Story by Adam Voiland.
- Instrument(s):
- Landsat 8 – OLI
- In situ Measurement
If water levels keep falling, Cape Town will declare Day Zero in less than three months. Taps in homes and businesses will be turned off until the rains come. The city’s four million residents will have to line up for water rations at 200 collection points.
Wednesday, January 31st, 2018India: A gender gap of as many as 63 million girls (21 million “unwanted” girls in India between 0 and 25 years);
Tuesday, January 30th, 2018- “Deeply-ingrained preference for boys has led to a massive gender gap in India
- Study finds that many couples who give birth to a girl will try again for a boy.”

Democratic People’s Republic of Korea (DPRK) Red Cross Society & The Arrival of H1N1 in North Korea
Tuesday, January 30th, 2018“On 19 January 2018 the Vice Minister of Public Health (MoPH) officially informed the World Health Organization (WHO) Country Office in Pyongyang of an outbreak of Influenza A (H1N1) stating that between 1 December 2017 and 16 January 2018 there was a total of 126,574 suspected influenza cases – individuals presenting with influenza-like illness. Of these, 81,640 cases were confirmed as Influenza A (H1N1) and as per the Ministry communication there had been four deaths – three children and one adult. According to the Ministry, 24.5 per cent of suspected influenza cases (numbering 31,010) were among children aged 0-7 years, 22.8 per cent (n= 28,858) were among children 8-16 years and the rest 52.7 per cent (n= 66,706), were among those who were above 17 years. The outbreak has become generalized throughout the country with 28.7 per cent of cases in the capital city – Pyongyang. The government has requested support for influenza vaccination targeting high-risk individuals with the MoPH specifically requesting 30,000 Oseltamivir tablets for healthcare workers. WHO has so far dispatched 5,000 tablets with 30,000 in the pipeline to distribute to frontline healthcare workers and vulnerable groups. There is a request to strengthen the nonpharmaceutical aspect of the operation with an emphasis on public health including surveillance and preventive activities with all agencies (WHO, UNICEF) requested to support with conducting an effective communication programme…..”
WHO’s first release of surveillance data on antibiotic resistance reveals high levels of resistance to a number of serious bacterial infections in both high- and low-income countries.
Tuesday, January 30th, 2018High levels of antibiotic resistance found worldwide, new data shows
29 January 2018 | BANGKOK – WHO’s first release of surveillance data on antibiotic resistance reveals high levels of resistance to a number of serious bacterial infections in both high- and low-income countries.
WHO’s new Global Antimicrobial Surveillance System (GLASS) reveals widespread occurrence of antibiotic resistance among 500 000 people with suspected bacterial infections across 22 countries.
The most commonly reported resistant bacteria were Escherichia coli, Klebsiella pneumoniae, Staphylococcus aureus, and Streptococcus pneumoniae, followed by Salmonella spp. The system does not include data on resistance of Mycobacterium tuberculosis, which causes tuberculosis (TB), as WHO has been tracking it since 1994 and providing annual updates in the Global tuberculosis report.
Among patients with suspected bloodstream infection, the proportion that had bacteria resistant to at least one of the most commonly used antibiotics ranged tremendously between different countries – from zero to 82%. Resistance to penicillin – the medicine used for decades worldwide to treat pneumonia – ranged from zero to 51% among reporting countries. And between 8% to 65% of E. coli associated with urinary tract infections presented resistance to ciprofloxacin, an antibiotic commonly used to treat this condition.
“The report confirms the serious situation of antibiotic resistance worldwide,” says Dr Marc Sprenger, director of WHO’s Antimicrobial Resistance Secretariat.
“Some of the world’s most common – and potentially most dangerous – infections are proving drug-resistant,” adds Sprenger. “And most worrying of all, pathogens don’t respect national borders. That’s why WHO is encouraging all countries to set up good surveillance systems for detecting drug resistance that can provide data to this global system.”
To date, 52 countries (25 high-income, 20 middle-income and 7 low-income countries) are enrolled in WHO’s Global Antimicrobial Surveillance System. For the first report, 40 countries provided information about their national surveillance systems and 22 countries also provided data on levels of antibiotic resistance.
“The report is a vital first step towards improving our understanding of the extent of antimicrobial resistance. Surveillance is in its infancy, but it is vital to develop it if we are to anticipate and tackle one of the biggest threats to global public health,” says Dr Carmem Pessoa-Silva, who coordinates the new surveillance system at WHO.
Data presented in this first GLASS report vary widely in quality and completeness. Some countries face major challenges in building their national surveillance systems, including a lack of personnel, funds and infrastructure.
However, WHO is supporting more countries to set up national antimicrobial resistance surveillance systems that can produce reliable, meaningful data. GLASS is helping to standardize the way that countries collect data and enable a more complete picture about antimicrobial resistance patterns and trends.
Solid drug resistance surveillance programmes in TB, HIV and malaria have been functioning for many years and have helped estimate disease burden, plan diagnostic and treatment services, monitor the effectiveness of control interventions, and design effective treatment regimens to address and prevent future resistance. GLASS is expected to perform a similar function for common bacterial pathogens.
The rollout of GLASS is already making a difference in many countries. For example, Kenya has enhanced the development of its national antimicrobial resistance system; Tunisia started to aggregate data on antimicrobial resistance at national level; the Republic of Korea completely revised its national surveillance system to align with the GLASS methodology, providing data of very high quality and completeness; and countries such as Afghanistan or Cambodia that face major structural challenges have enrolled in the system and are using the GLASS framework as an opportunity for strengthening their AMR surveillance capacities. In general, national participation in GLASS is seen as a sign of growing political commitment to support global efforts to control antimicrobial resistance.
Note to editors
The need for a global surveillance system was highlighted by WHO in 2014 in the Antimicrobial resistance global report on surveillance.
In October 2015, WHO launched the Global Antimicrobial Surveillance System (GLASS) working closely with WHO Collaborating Centres and existing antimicrobial resistance surveillance networks and based on the experience of other WHO surveillance programmes. For example, TB drug resistance surveillance has been implemented in 188 countries over the past 24 years. HIV drug resistance surveillance started in 2005 and by 2017, over 50 countries had reported data on pretreatment and acquired resistance using standardized survey methods.
Any country, at any stage of the development of its national antimicrobial resistance surveillance system, can enrol in GLASS. Countries are encouraged to implement the surveillance standards and indicators gradually, based on their national priorities and available resources.
GLASS will eventually incorporate information from other surveillance systems related to antimicrobial resistance in humans, such as in the food chain, monitoring of antimicrobial consumption, targeted surveillance projects, and other related data.
All data produced by GLASS is available free online and will be updated regularly.
Dr Tedros Adhanom Ghebreyesus, WHO’s Director-General, has underscored his aim to make antimicrobial resistance one of WHO’s top priorities by bringing together experts working on this issue under a newly created strategic initiatives cluster.
Media contact:
Christian Lindmeier
Telephone: +41 22 791 1948
Mobile: +41 79 500 6552
Email: lindmeierch@who.int
1/29/1922: At the Knickerbocker Theatre in Washington, D.C., the accumulated snow on the theater’s roof collapses the building and tons of steel and concrete fell down on top of the theatergoers cusing the deaths of 108 and injuring another 133.
Tuesday, January 30th, 2018Obesity rates in sub-Saharan Africa are shooting up faster than in just about anywhere else in the world, causing a public health crisis that is catching Africa, and the world, by surprise.
Monday, January 29th, 2018Obesity and overweight
Key facts
- Worldwide obesity has nearly tripled since 1975.
- In 2016, more than 1.9 billion adults, 18 years and older, were overweight. Of these over 650 million were obese.
- 39% of adults aged 18 years and over were overweight in 2016, and 13% were obese.
- Most of the world’s population live in countries where overweight and obesity kills more people than underweight.
- 41 million children under the age of 5 were overweight or obese in 2016.
- Over 340 million children and adolescents aged 5-19 were overweight or obese in 2016.
- Obesity is preventable.
What are overweight and obesity?
Overweight and obesity are defined as abnormal or excessive fat accumulation that may impair health.
Body mass index (BMI) is a simple index of weight-for-height that is commonly used to classify overweight and obesity in adults. It is defined as a person’s weight in kilograms divided by the square of his height in meters (kg/m2).
Adults
For adults, WHO defines overweight and obesity as follows:
- overweight is a BMI greater than or equal to 25; and
- obesity is a BMI greater than or equal to 30.
BMI provides the most useful population-level measure of overweight and obesity as it is the same for both sexes and for all ages of adults. However, it should be considered a rough guide because it may not correspond to the same degree of fatness in different individuals.
For children, age needs to be considered when defining overweight and obesity.
Children under 5 years of age
For children under 5 years of age:
- overweight is weight-for-height greater than 2 standard deviations above WHO Child Growth Standards median; and
- obesity is weight-for-height greater than 3 standard deviations above the WHO Child Growth Standards median.
Children aged between 5–19 years
Overweight and obesity are defined as follows for children aged between 5–19 years:
- overweight is BMI-for-age greater than 1 standard deviation above the WHO Growth Reference median; and
- obesity is greater than 2 standard deviations above the WHO Growth Reference median.
Facts about overweight and obesity
Some recent WHO global estimates follow.
- In 2016, more than 1.9 billion adults aged 18 years and older were overweight. Of these over 650 million adults were obese.
- In 2016, 39% of adults aged 18 years and over (39% of men and 40% of women) were overweight.
- Overall, about 13% of the world’s adult population (11% of men and 15% of women) were obese in 2016.
- The worldwide prevalence of obesity nearly tripled between 1975 and 2016.
In 2016, an estimated 41 million children under the age of 5 years were overweight or obese. Once considered a high-income country problem, overweight and obesity are now on the rise in low- and middle-income countries, particularly in urban settings. In Africa, the number of overweight children under 5 has increased by nearly 50 per cent since 2000. Nearly half of the children under 5 who were overweight or obese in 2016 lived in Asia.
Over 340 million children and adolescents aged 5-19 were overweight or obese in 2016.
The prevalence of overweight and obesity among children and adolescents aged 5-19 has risen dramatically from just 4% in 1975 to just over 18% in 2016. The rise has occurred similarly among both boys and girls: in 2016 18% of girls and 19% of boys were overweight.
While just under 1% of children and adolescents aged 5-19 were obese in 1975, more 124 million children and adolescents (6% of girls and 8% of boys) were obese in 2016.
Overweight and obesity are linked to more deaths worldwide than underweight. Globally there are more people who are obese than underweight – this occurs in every region except parts of sub-Saharan Africa and Asia.
What causes obesity and overweight?
The fundamental cause of obesity and overweight is an energy imbalance between calories consumed and calories expended. Globally, there has been:
- an increased intake of energy-dense foods that are high in fat; and
- an increase in physical inactivity due to the increasingly sedentary nature of many forms of work, changing modes of transportation, and increasing urbanization.
Changes in dietary and physical activity patterns are often the result of environmental and societal changes associated with development and lack of supportive policies in sectors such as health, agriculture, transport, urban planning, environment, food processing, distribution, marketing, and education.
What are common health consequences of overweight and obesity?
Raised BMI is a major risk factor for noncommunicable diseases such as:
- cardiovascular diseases (mainly heart disease and stroke), which were the leading cause of death in 2012;
- diabetes;
- musculoskeletal disorders (especially osteoarthritis – a highly disabling degenerative disease of the joints);
- some cancers (including endometrial, breast, ovarian, prostate, liver, gallbladder, kidney, and colon).
The risk for these noncommunicable diseases increases, with increases in BMI.
Childhood obesity is associated with a higher chance of obesity, premature death and disability in adulthood. But in addition to increased future risks, obese children experience breathing difficulties, increased risk of fractures, hypertension, early markers of cardiovascular disease, insulin resistance and psychological effects.
Facing a double burden of disease
Many low- and middle-income countries are now facing a “double burden” of disease.
- While these countries continue to deal with the problems of infectious diseases and undernutrition, they are also experiencing a rapid upsurge in noncommunicable disease risk factors such as obesity and overweight, particularly in urban settings.
- It is not uncommon to find undernutrition and obesity co-existing within the same country, the same community and the same household.
Children in low- and middle-income countries are more vulnerable to inadequate pre-natal, infant, and young child nutrition. At the same time, these children are exposed to high-fat, high-sugar, high-salt, energy-dense, and micronutrient-poor foods, which tend to be lower in cost but also lower in nutrient quality. These dietary patterns, in conjunction with lower levels of physical activity, result in sharp increases in childhood obesity while undernutrition issues remain unsolved.
How can overweight and obesity be reduced?
Overweight and obesity, as well as their related noncommunicable diseases, are largely preventable. Supportive environments and communities are fundamental in shaping people’s choices, by making the choice of healthier foods and regular physical activity the easiest choice (the choice that is the most accessible, available and affordable), and therefore preventing overweight and obesity.
At the individual level, people can:
- limit energy intake from total fats and sugars;
- increase consumption of fruit and vegetables, as well as legumes, whole grains and nuts; and
- engage in regular physical activity (60 minutes a day for children and 150 minutes spread through the week for adults).
Individual responsibility can only have its full effect where people have access to a healthy lifestyle. Therefore, at the societal level it is important to support individuals in following the recommendations above, through sustained implementation of evidence based and population based policies that make regular physical activity and healthier dietary choices available, affordable and easily accessible to everyone, particularly to the poorest individuals. An example of such a policy is a tax on sugar sweetened beverages.
The food industry can play a significant role in promoting healthy diets by:
- reducing the fat, sugar and salt content of processed foods;
- ensuring that healthy and nutritious choices are available and affordable to all consumers;
- restricting marketing of foods high in sugars, salt and fats, especially those foods aimed at children and teenagers; and
- ensuring the availability of healthy food choices and supporting regular physical activity practice in the workplace.
WHO response
Adopted by the World Health Assembly in 2004, the “WHO Global Strategy on Diet, Physical Activity and Health” describes the actions needed to support healthy diets and regular physical activity. The Strategy calls upon all stakeholders to take action at global, regional and local levels to improve diets and physical activity patterns at the population level.
The Political Declaration of the High Level Meeting of the United Nations General Assembly on the Prevention and Control of Noncommunicable Diseases of September 2011, recognizes the critical importance of reducing unhealthy diet and physical inactivity. The political declaration commits to advancing the implementation of the “WHO Global Strategy on Diet, Physical Activity and Health“, including, where appropriate, through the introduction of policies and actions aimed at promoting healthy diets and increasing physical activity in the entire population.
WHO has also developed the “Global Action Plan for the Prevention and Control of Noncommunicable Diseases 2013-2020” which aims to achieve the commitments of the UN Political Declaration on Noncommunicable diseases (NCDs) which was endorsed by Heads of State and Government in September 2011. The “Global Action Plan” will contribute to progress on 9 global NCD targets to be attained by 2025, including a 25% relative reduction in premature mortality from NCDs by 2025 and a halt in the rise of global obesity to match the rates of 2010.
The World Health Assembly welcomed the report of the Commission on Ending Childhood Obesity (2016) and its 6 recommendations to address the obesogenic environment and critical periods in the life course to tackle childhood obesity. The implementation plan to guide countries in taking action to implement the recommendations of the Commission was welcomed by the World Health Assembly in 2017.
Rest in Peace: At 11:38 a.m. EST, on January 28, 1986, the space shuttle Challenger lifts off from Cape Canaveral, Florida, and Christa McAuliffe is on her way to becoming the first ordinary U.S. civilian to travel into space.
Sunday, January 28th, 2018 M
M
World Leprosy Day: Sunday, January 28, 2018 (the number of newly diagnosed leprosy patients has remained above 200,000 per year for the last decade)
Sunday, January 28th, 2018Zero Leprosy : Document
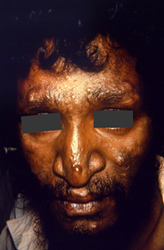 CDC: The face of this male patient exhibited some of the pathologic characteristic associated with a case of nodular lepromatous, or multibacillary (MB), Hansen’s disease. Of note is the presence of cutaneous nodules upon the forehead, nose, cheeks, lips, and chin. The eyebrows are diminished as well.
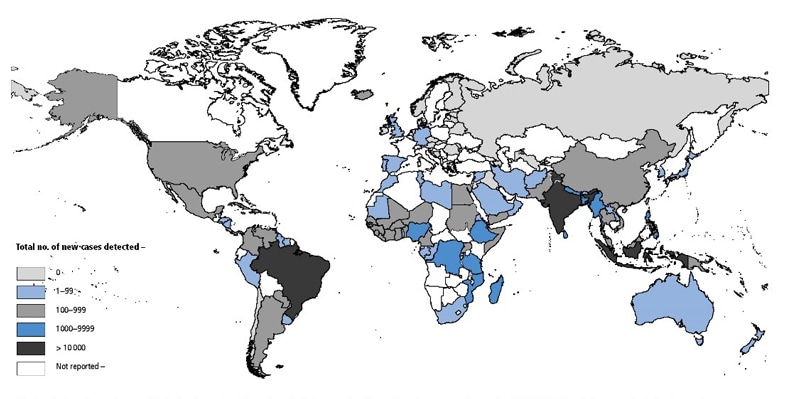
Geographical Distribution of New Cases of Hansen’s Disease Reported to WHO in 2015