2015-2016 Influenza Season Week 6 ending February 13, 2016
February 20th, 2016
Background:
The Centers for Disease Control and Prevention’s (CDC) Influenza Division collects, compiles, and analyzes information on influenza activity year-round in the United States and produces FluView, a weekly influenza surveillance report, and FluView Interactive. The U.S. influenza surveillance system provides information in five categories collected from nine data sources. This is the first report of the 2015-2016 influenza season, which began on October 4, 2015.
The five categories and nine data components of CDC influenza surveillance are:
- Viral Surveillance:U.S. World Health Organization (WHO) collaborating laboratories, the National Respiratory and Enteric Virus Surveillance System (NREVSS), and human infection with novel influenza A virus case reporting;
- Mortality:National Center for Health Statistics (NCHS) Mortality Surveillance System, 122 Cities Mortality Reporting System and influenza-associated pediatric deaths;
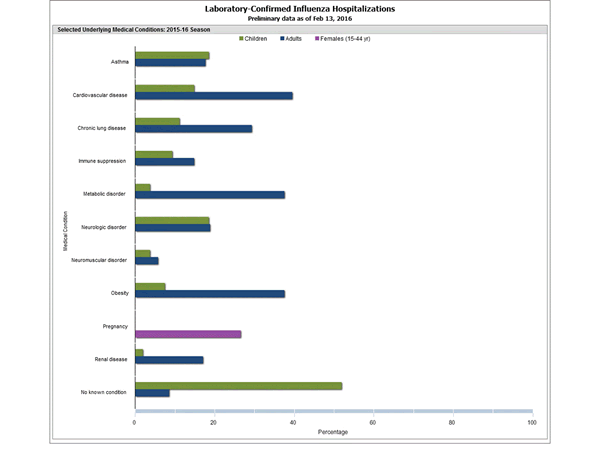
- Hospitalizations:Influenza Hospitalization Network (FluSurv-NET) including the Emerging Infections Program (EIP) and three additional states;
- Outpatient Illness Surveillance:U.S. Outpatient Influenza-like Illness Surveillance Network (ILINet);
- Geographic Spread of Influenza:State and territorial epidemiologists’ reports.
An overview of the CDC influenza surveillance system, including methodology and detailed descriptions of each data component, is available at: http://www.cdc.gov/flu/weekly/overview.htm.
–>
Synopsis:
During week 6 (February 7-13, 2016), influenza activity increased in the United States.
- Viral Surveillance: The most frequently identified influenza virus type reported by public health laboratories during week 6 was influenza A, with influenza A (H1N1)pdm09 viruses predominating. The percentage of respiratory specimens testing positive for influenza in clinical laboratories increased.
<!–
- Novel Influenza A Virus: One human infection with a novel influenza A virus was reported.
–>
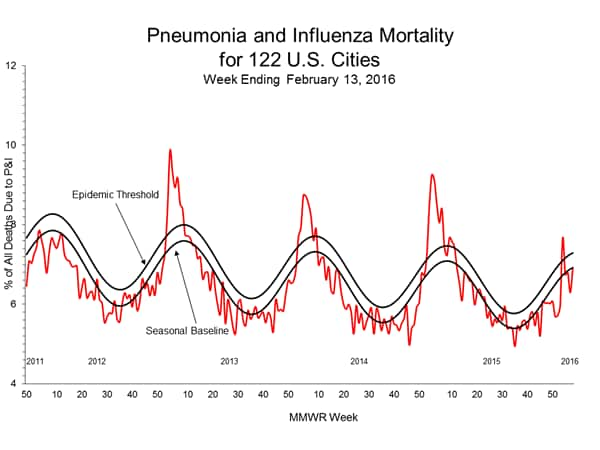
- Pneumonia and Influenza Mortality: The proportion of deaths attributed to pneumonia and influenza (P&I) was below their system-specific epidemic threshold in both the NCHS Mortality Surveillance System and the 122 Cities Mortality Reporting System.
- Influenza-associated Pediatric Deaths: Two influenza-associated pediatric deaths were reported.
- Influenza-associated Hospitalizations: A cumulative rate for the season of 4.1 laboratory-confirmed influenza-associated hospitalizations per 100,000 population was reported.
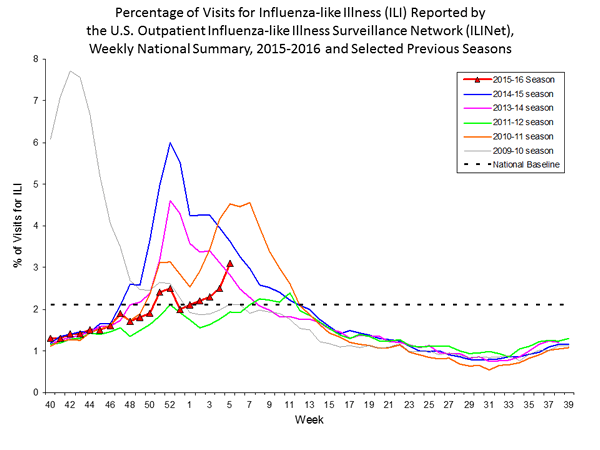
- Outpatient Illness Surveillance: The proportion of outpatient visits for influenza-like illness (ILI) was 3.1%, which is above the national baseline of 2.1%. Nine of 10 regions reported ILI at or above region-specific baseline levels. Puerto Rico and two states experienced high ILI activity; New York City and 11 states experienced moderate ILI activity; 6 states experienced low ILI activity; 30 states experienced minimal ILI activity; and the District of Columbia and one state had insufficient data.
- Geographic Spread of Influenza: The geographic spread of influenza in Puerto Rico and 12 states was reported as widespread; 20 states reported regional activity; the District of Columbia, Guam, and 15 states reported local activity; and the U.S. Virgin Islands and three states reported sporadic activity.
Region and state-specific data are available at http://www.cdc.gov/flu/weekly/nchs.htm.
122 Cities Mortality Reporting System:
During week 6, 6.9% of all deaths reported through the 122 Cities Mortality Reporting System were due to P&I. This percentage was below the epidemic threshold of 7.3% for week 6.
 Additional data can be found at: http://gis.cdc.gov/GRASP/Fluview/PedFluDeath.html.
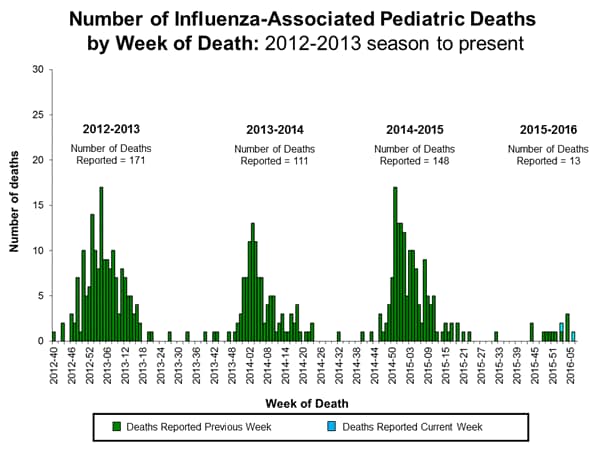
Additional FluSurv-NET data can be found at: http://gis.cdc.gov/GRASP/Fluview/FluHospRates.html and http://gis.cdc.gov/grasp/fluview/FluHospChars.html.
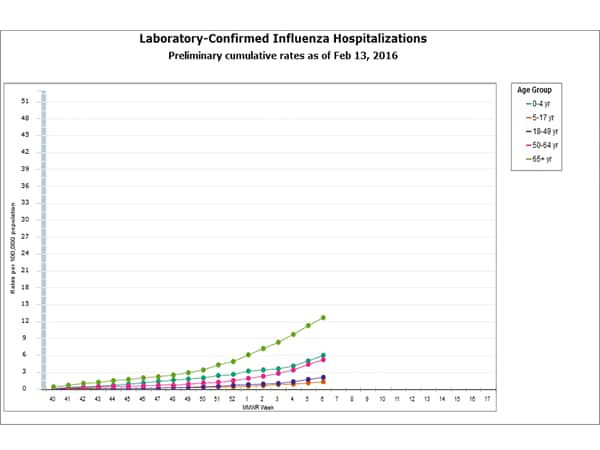
Data from the Influenza Hospitalization Surveillance Network (FluSurv-NET), a population-based surveillance for influenza related hospitalizations in children and adults in 13 U.S. states. Cumulative incidence rates are calculated using the National Center for Health Statistics’ (NCHS) population estimates for the counties included in the surveillance catchment area.
Additional data are available at http://gis.cdc.gov/grasp/fluview/fluportaldashboard.html.