Archive for March, 2017
Haiti: The United Nations’ strategy to fight the cholera epidemic (the “New Approach” )has failed to gain traction. A trust fund created to help finance the strategy has only about $2 million and only 6 of the 193 member states — Britain, Chile, France, India, Liechtenstein and South Korea — have donated.
Monday, March 20th, 2017“…..Cholera, a waterborne bacterial scourge that can cause acute diarrhea and fatal dehydration if not treated quickly, has killed nearly 10,000 people and sickened nearly 800,000 in Haiti, the Western Hemisphere’s poorest country, since it was introduced there in 2010 by infected Nepalese members of a United Nations peacekeeping force. This year, as of late February, nearly 2,000 new cases had been reported, amounting to hundreds a week……”
OHIO: Six out of 10 on Key Indicators Related to Preventing, Detecting, Diagnosing and Responding to Outbreaks
Sunday, March 19th, 2017Ready or Not? examines the nation’s ability to respond to public health emergencies, tracks progress and vulnerabilities, and includes a review of state and federal public health preparedness policies. Some key Ohio findings include:
| No. | Indicator | Ohio | Number of States Receiving Points |
|---|---|---|---|
| A “Y” means the state received a point for that indicator | |||
| 1 | Public Health Funding Commitment: State increased or maintained funding for public health from FY 2014 to FY 2015 and FY 2015 to FY 2016. |
Y | 26 |
| 2 | National Health Security Preparedness Index: State met or exceeded the overall national average score (6.7) of the National Health Security Preparedness IndexTM, as of 2016. | 30 + D.C. | |
| 3 | Public Health Accreditation: State had at least one accredited public health department. | Y | 43 + D.C. |
| 4 | Flu Vaccination Rate: State vaccinated at least half of their population (ages 6 months and older) for the seasonal flu from Fall 2015 to Spring 2016. | 10 | |
| 5 | Climate Change Readiness: State received a grade of C or above in States at Risk: America’s Preparedness Report Card. | 32 + D.C. | |
| 6 | Food Safety: State increased the speed of DNA fingerprinting using pulsed-field gel electrophoresis (PFGE) testing for all reported cases of E. coli. | Y | 45 + D.C. |
| 7 | Reducing Healthcare-Associated Infections (HAIs): State implemented all four recommended activities to build capacity for HAI prevention. | Y | 35 + D.C. |
| 8 | Public Health Laboratories: State public health laboratory provided biosafety training and/or provided information about biosafety training courses for sentinel clinical labs (from July 1, 2015 to June 30, 2016). | 44 | |
| 9 | Public Health Laboratories: State public health laboratories reported having a biosafety professional on staff (from July 1, 2015 to June 30, 2016). | Y | 47 + D.C. |
| 10 | Emergency Healthcare Access: State has a formal access program or a program in progress for getting private sector healthcare staff and supplies into restricted areas during a disaster. | Y | 10 |
| Total | 6 | ||
2016-2017 Influenza Season Week 10 ending March 11, 2017
Sunday, March 19th, 2017Synopsis:
During week 10 (March 5-11, 2017), influenza activity decreased, but remained elevated in the United States.
- Viral Surveillance: The most frequently identified influenza virus subtype reported by public health laboratories during week 10 was influenza A (H3). The percentage of respiratory specimens testing positive for influenza in clinical laboratories decreased.
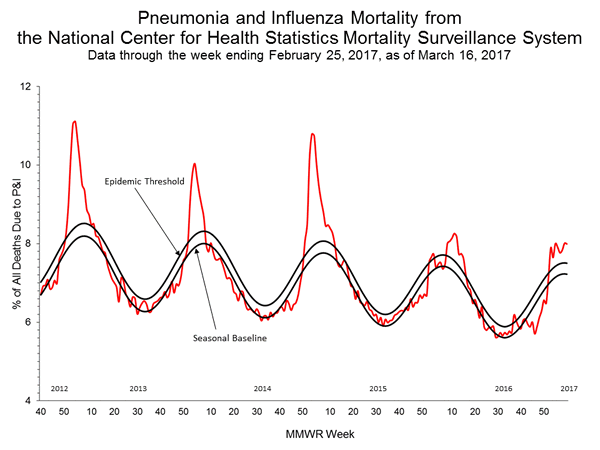
- Pneumonia and Influenza Mortality: The proportion of deaths attributed to pneumonia and influenza (P&I) was above the system-specific epidemic threshold in the National Center for Health Statistics (NCHS) Mortality Surveillance System.
- Influenza-associated Pediatric Deaths: Five influenza-associated pediatric deaths were reported.
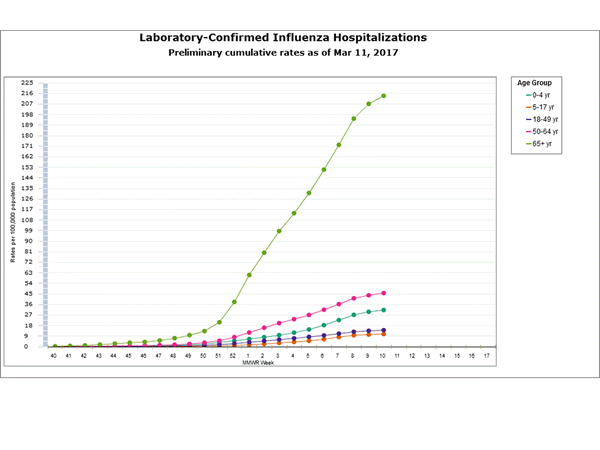
- Influenza-associated Hospitalizations: A cumulative rate for the season of 46.9 laboratory-confirmed influenza-associated hospitalizations per 100,000 population was reported.
- Outpatient Illness Surveillance: The proportion of outpatient visits for influenza-like illness (ILI) was 3.7%, which is above the national baseline of 2.2%. Seven of ten regions reported ILI at or above their region-specific baseline levels. 18 states experienced high ILI activity; seven states experienced moderate ILI activity; five states experienced low ILI activity; New York City, Puerto Rico, and 20 states experienced minimal ILI activity; and the District of Columbia had insufficient data.
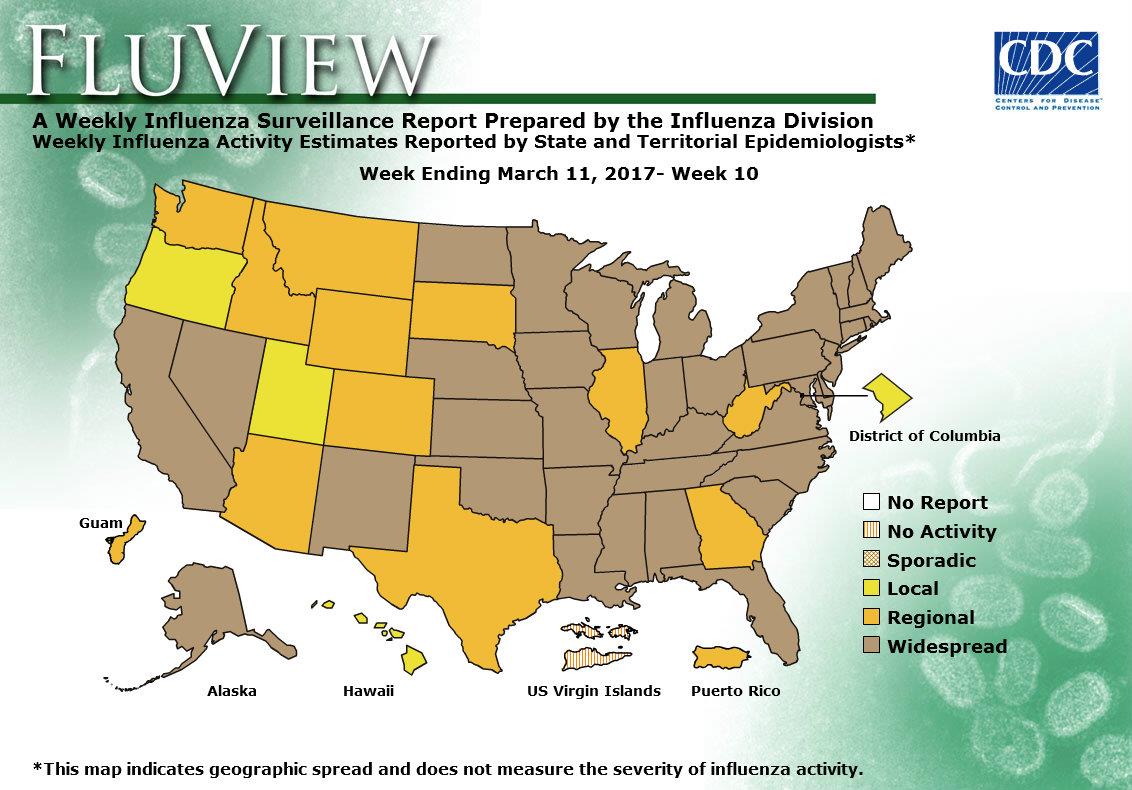
- Geographic Spread of Influenza: The geographic spread of influenza in 36 states was reported as widespread; Guam, Puerto Rico and 11 states reported regional activity; the District of Columbia and three states reported local activity; and the U.S. Virgin Islands reported no activity.


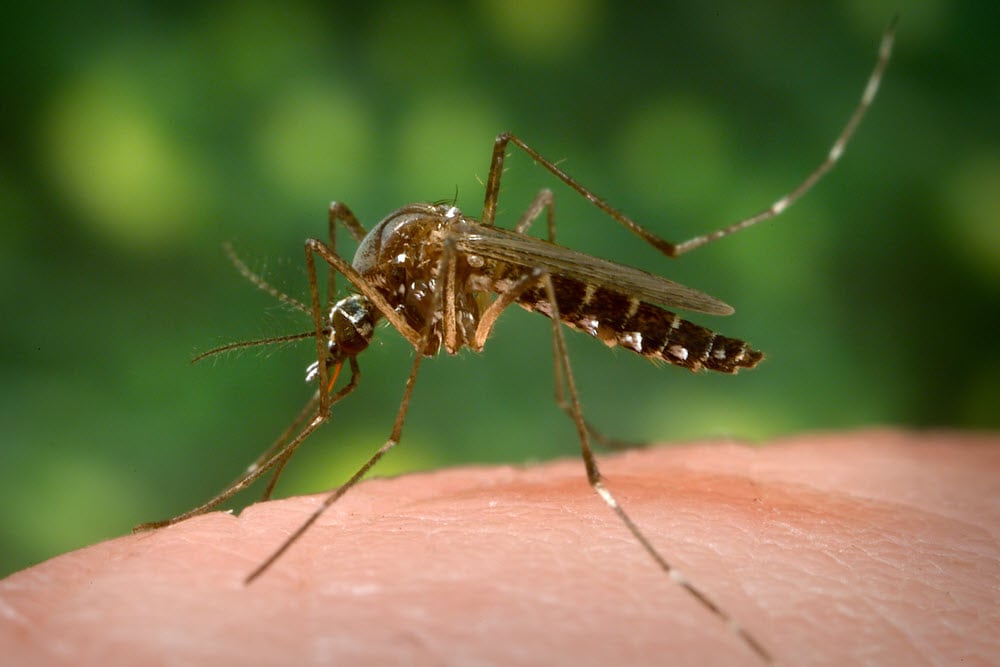
“….As we have seen with dengue, chikungunya, and Zika, A. aegypti–mediated arbovirus epidemics can move rapidly through populations with little preexisting immunity and spread more broadly owing to human travel. Although it is highly unlikely that we will see yellow fever outbreaks in the continental United States, where mosquito density is low and risk of exposure is limited, it is possible that travel-related cases of yellow fever could occur, with brief periods of local transmission in warmer regions such as the Gulf Coast states, where A. aegypti mosquitoes are prevalent…..”
Sunday, March 19th, 2017
“….The clinical illness manifests in three stages: infection, remission, and intoxication.
- During the infection stage, patients present after a 3-to-6-day incubation period with a nonspecific febrile illness that is difficult to distinguish from other flulike diseases.
- High fevers associated with bradycardia, leukopenia, and transaminase elevations may provide a clue to the diagnosis, and patients will be viremic during this period.
- This initial stage is followed by a period of remission, when clinical improvement occurs and most patients fully recover.
- However, 15 to 20% of patients have progression to the intoxication stage, in which symptoms recur after 24 to 48 hours. This stage is characterized by high fevers, hemorrhagic manifestations, severe hepatic dysfunction and jaundice (hence the name “yellow fever”), renal failure, cardiovascular abnormalities, central nervous system dysfunction, and shock. ……
- Case-fatality rates range from 20 to 60% in patients in whom severe disease develops, and
- [T]reatment is supportive, since no antiviral therapies are currently available…..”

March 18, 1925: The Tri-State Tornado, the worst tornado in U.S. history, passes through eastern Missouri, southern Illinois, and southern Indiana, killing 695 people, injuring some 13,000 people, and causing $17 million in property damage.
Saturday, March 18th, 2017March 18, 1937: Nearly 300 students in Texas are killed by an explosion of natural gas at The Consolidated School of New London, Texas.
Saturday, March 18th, 2017https://www.youtube.com/watch?v=KSW0gLsFz7w
Off the Yemen coast: At least 42 refugees have been killed and dozens injured after the boat they were traveling on was fired upon. At least 24 of the injured were being treated at nearby hospitals but dozens more were unaccounted for.
Saturday, March 18th, 2017Steven Johnson: How the “ghost map” helped end a killer disease
Saturday, March 18th, 20170:11If you haven’t ordered yet, I generally find the rigatoni with the spicy tomato sauce goes best with diseases of the small intestine.
0:21(Laughter)
0:23So, sorry — it just feels like I should be doing stand-up up here because of the setting. No, what I want to do is take you back to 1854 in London for the next few minutes, and tell the story — in brief — of this outbreak, which in many ways, I think, helped create the world that we live in today, and particularly the kind of city that we live in today. This period in 1854, in the middle part of the 19th century, in London’s history, is incredibly interesting for a number of reasons. But I think the most important one is thatLondon was this city of 2.5 million people, and it was the largest city on the face of the planet at that point. But it was also the largest city that had ever been built.
1:06And so the Victorians were trying to live through and simultaneously invent a whole new scale of living:this scale of living that we, you know, now call “metropolitan living.” And it was in many ways, at this point in the mid-1850s, a complete disaster. They were basically a city living with a modern kind of industrial metropolis with an Elizabethan public infrastructure. So people, for instance, just to gross you out for a second, had cesspools of human waste in their basement. Like, a foot to two feet deep. And they would just kind of throw the buckets down there and hope that it would somehow go away, and of course it never really would go away. And all of this stuff, basically, had accumulated to the point where the city was incredibly offensive to just walk around in.
1:57It was an amazingly smelly city. Not just because of the cesspools, but also the sheer number of livestock in the city would shock people. Not just the horses, but people had cows in their attics that they would use for milk, that they would hoist up there and keep them in the attic until literally their milk ran out and they died, and then they would drag them off to the bone boilers down the street. So, you would just walk around London at this point and just be overwhelmed with this stench. And what ended up happening is that an entire emerging public health system became convinced that it was the smell that was killing everybody, that was creating these diseases that would wipe through the city every three or four years.And cholera was really the great killer of this period.
2:41It arrived in London in 1832, and every four or five years another epidemic would take 10,000, 20,000 people in London and throughout the U.K. And so the authorities became convinced that this smell was this problem. We had to get rid of the smell. And so, in fact, they concocted a couple of early, you know,founding public-health interventions in the system of the city, one of which was called the “Nuisances Act,” which they got everybody as far as they could to empty out their cesspools and just pour all that waste into the river. Because if we get it out of the streets, it’ll smell much better, and — oh right, we drink from the river. So what ended up happening, actually, is they ended up increasing the outbreaks of cholera because, as we now know, cholera is actually in the water. It’s a waterborne disease, not something that’s in the air. It’s not something you smell or inhale; it’s something you ingest.
3:36And so one of the founding moments of public health in the 19th century effectively poisoned the water supply of London much more effectively than any modern day bioterrorist could have ever dreamed of doing. So this was the state of London in 1854, and in the middle of all this carnage and offensive conditions, and in the midst of all this scientific confusion about what was actually killing people, it was a very talented classic 19th century multi-disciplinarian named John Snow, who was a local doctor in Soho in London, who had been arguing for about four or five years that cholera was, in fact, a waterborne disease, and had basically convinced nobody of this. The public health authorities had largely ignored what he had to say. And he’d made the case in a number of papers and done a number of studies, but nothing had really stuck. And part of — what’s so interesting about this story to me is that in some ways, it’s a great case study in how cultural change happens, how a good idea eventually comes to win out over much worse ideas. And Snow labored for a long time with this great insight that everybody ignored.
4:46And then on one day, August 28th of 1854, a young child, a five-month-old girl whose first name we don’t know, we know her only as Baby Lewis, somehow contracted cholera, came down with cholera at 40 Broad Street. You can’t really see it in this map, but this is the map that becomes the central focus in the second half of my book. It’s in the middle of Soho, in this working class neighborhood, this little girl becomes sick and it turns out that the cesspool, that they still continue to have, despite the Nuisances Act, bordered on an extremely popular water pump, local watering hole that was well known for the best water in all of Soho, that all the residents from Soho and the surrounding neighborhoods would go to.
5:31And so this little girl inadvertently ended up contaminating the water in this popular pump, and one of the most terrifying outbreaks in the history of England erupted about two or three days later. Literally, 10 percent of the neighborhood died in seven days, and much more would have died if people hadn’t fledafter the initial outbreak kicked in. So it was this incredibly terrifying event. You had these scenes of entire families dying over the course of 48 hours of cholera, alone in their one-room apartments, in their little flats. Just an extraordinary, terrifying scene. Snow lived near there, heard about the outbreak, and in this amazing act of courage went directly into the belly of the beast because he thought an outbreak that concentrated could actually potentially end up convincing people that, in fact, the real menace of cholera was in the water supply and not in the air. He suspected an outbreak that concentrated would probably involve a single point source. One single thing that everybody was going to because it didn’t have the traditional slower path of infections that you might expect.
6:42And so he went right in there and started interviewing people. He eventually enlisted the help of this amazing other figure, who’s kind of the other protagonist of the book — this guy, Henry Whitehead, who was a local minister, who was not at all a man of science, but was incredibly socially connected; he knew everybody in the neighborhood. And he managed to track down, Whitehead did, many of the cases of people who had drunk water from the pump, or who hadn’t drunk water from the pump. And eventually Snow made a map of the outbreak. He found increasingly that people who drank from the pump were getting sick. People who hadn’t drunk from the pump were not getting sick. And he thought about representing that as a kind of a table of statistics of people living in different neighborhoods, people who hadn’t, you know, percentages of people who hadn’t, but eventually he hit upon the idea that what he needed was something that you could see. Something that would take in a sense a higher-level view of all this activity that had been happening in the neighborhood.
7:33And so he created this map, which basically ended up representing all the deaths in the neighborhoodsas black bars at each address. And you can see in this map, the pump right at the center of it and you can see that one of the residences down the way had about 15 people dead. And the map is actually a little bit bigger. As you get further and further away from the pump, the deaths begin to grow less and less frequent. And so you can see this something poisonous emanating out of this pump that you could see in a glance. And so, with the help of this map, and with the help of more evangelizing that he did over the next few years and that Whitehead did, eventually, actually, the authorities slowly started to come around. It took much longer than sometimes we like to think in this story, but by 1866, when the next big cholera outbreak came to London, the authorities had been convinced — in part because of this story, in part because of this map — that in fact the water was the problem.
8:30And they had already started building the sewers in London, and they immediately went to this outbreakand they told everybody to start boiling their water. And that was the last time that London has seen a cholera outbreak since. So, part of this story, I think — well, it’s a terrifying story, it’s a very dark story and it’s a story that continues on in many of the developing cities of the world. It’s also a story really that is fundamentally optimistic, which is to say that it’s possible to solve these problems if we listen to reason, if we listen to the kind of wisdom of these kinds of maps, if we listen to people like Snow and Whitehead, if we listen to the locals who understand what’s going on in these kinds of situations. And what it ended up doing is making the idea of large-scale metropolitan living a sustainable one.
9:14When people were looking at 10 percent of their neighborhoods dying in the space of seven days, there was a widespread consensus that this couldn’t go on, that people weren’t meant to live in cities of 2.5 million people. But because of what Snow did, because of this map, because of the whole series of reforms that happened in the wake of this map, we now take for granted that cities have 10 million people, cities like this one are in fact sustainable things. We don’t worry that New York City is going to collapse in on itself quite the way that, you know, Rome did, and be 10 percent of its size in 100 years or 200 years. And so that in a way is the ultimate legacy of this map. It’s a map of deaths that ended up creating a whole new way of life, the life that we’re enjoying here today. Thank you very much.
“…On March 8, Islamic State militants fired more than 40 rockets carrying chemical warheads at this northern Iraqi town of mud-wall compounds and dusty date palms on, according to district head Hussein Adil, killing a young child and wounding over 800 civilians. After the attack, which may have been carried out with a mixture of chlorine and mustard gas, nearly half of the town’s 30,000 residents, mostly ethnic Turkmen Shiites, fled in terror…”
Saturday, March 18th, 2017“…..Hussein said he was the first on the scene. “There was a smell like bad gas or rotten eggs and the girl’s skin was coated in an oily film,” said the 29-year-old teacher from his home in Taza, where he was recovering from the effects of the gas.
Hussein picked Fatimah up and rushed her to the nearby hospital. “I wanted to rescue her,” he said.
But her condition deteriorated, and she died in a hospital bed. Photos show her torso swaddled in bandages and her exposed skin blistered and discolored. Hussein later became sick himself and his throat and eyes burned. His skin blistered from where he had clutched the girl to his chest.
These signs and symptoms were consistent with mustard gas poisoning, according to Nanem Saboh Mohamed, a doctor at Taza hospital where many of those affected by Saturday’s attacks were treated…..”


