NASA: Sometime between July 10 and July 12, an iceberg about the size of Delaware split off from Antarctica’s Larsen C ice shelf.
July 13th, 2017Sometime between July 10 and July 12, an iceberg about the size of Delaware split off from Antarctica’s Larsen C ice shelf. Now that nearly 5,800 square kilometers (2,200 square miles) of ice has broken away, the Larsen C shelf area has shrunk by approximately 10 percent.
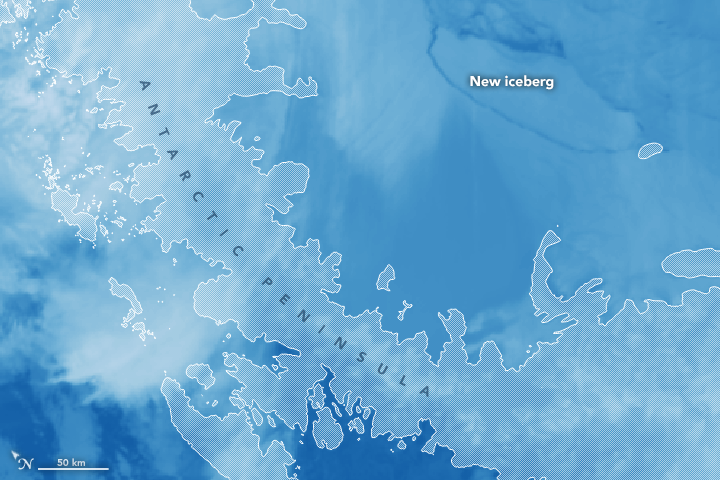
Scientists have been tracking the stability of this ice shelf for several years. The Moderate Resolution Imaging Spectroradiometer (MODIS) on NASA’s Aqua satellite captured an image (above) of the new iceberg on July 12, 2017. The false-color view uses MODIS band 31, which measures infrared signals known as “brightness temperature.” This measurement is useful for distinguishing the relative warmth or coolness of a landscape. Dark blue depicts where the surface is the warmest—most notably between the new iceberg and the ice shelf, but also in areas of open ocean or where water is topped by thin sea ice. Lighter blue colors show intact or thicker ice (cooler surfaces).

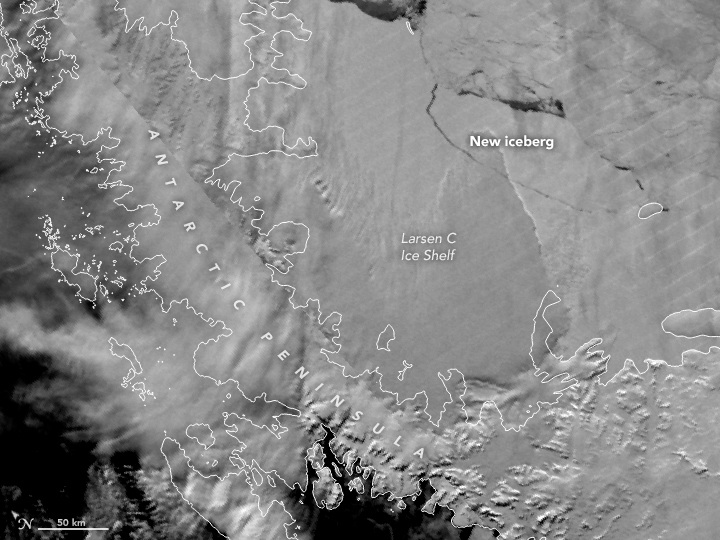
The calving event was confirmed by the Visible Infrared Imaging Radiometer Suite (VIIRS) on the Suomi NPP satellite. The day-night band (DNB) of VIIRS captured this image on July 12, 2017.
The final rupture was first reported by Project MIDAS, an Antarctic research project based in the United Kingdom. Adrian Luckman of Swansea University and MIDAS explains the significance of the calving event in a post here.
Larsen C, a floating platform of glacial ice on the east side of the Antarctic Peninsula, is the fourth-largest ice shelf on the coast of Antarctica. In 2014, a crack that had been slowly growing in the ice shelf for decades suddenly turned northward and accelerated, creating today’s iceberg.
“The interesting thing is what happens next…how the remaining ice shelf responds,” said Kelly Brunt, a glaciologist from NASA’s Goddard Space Flight Center and the University of Maryland. “Will the ice shelf weaken, or possibly collapse like its neighbors Larsen A and B? Will the glaciers behind the ice shelf accelerate and have a direct contribution to sea level rise? Or is this just a normal calving event?”
Scientists have monitored the progression of the rift over the past year using data from the European Space Agency’s Sentinel satellites (which can image with radar during the long Antarctic night) and thermal imagery from Landsat 8 and the MODIS instruments on NASA’s Terra and Aqua satellites.
In the coming months and years, researchers will monitor the response of Larsen C and the glaciers that flow into it with satellite imagery, airborne surveys, automated geophysical instruments on the ice, and field work.
“We don’t currently know what changed in 2014 that allowed this rift to push through the suture zone and propagate into the main body of the ice shelf,” said Dan McGrath, a glaciologist at Colorado State University who has been studying Larsen C since 2008.
McGrath said the growth of the crack is not directly linked to climate change. “The Antarctic Peninsula has been one of the fastest warming places on the planet throughout the latter half of the 20th century. This warming has driven really profound environmental changes, including the collapse of Larsen A and B,” McGrath said. “But with the rift on Larsen C, we haven’t made a direct connection with the warming climate. Still, there are definitely mechanisms by which this rift could be linked to climate change, most notably through warmer ocean waters eating away at the base of the shelf.”
The U.S. National Ice Center will monitor the trajectory of the new iceberg, which is likely to be named A-68. The currents around Antarctica generally dictate the path that the icebergs follow. In this case, the new berg is likely to follow a similar path to the icebergs produced by the collapse of Larsen B: north along the coast of the peninsula, then northeast into the South Atlantic.
-
References and Related Reading
- NASA Earth Observatory (2017, June 29) A Crack of Light in the Polar Dark.
- NASA Ice (2017, July 12) Massive Iceberg Breaks Off from Antarctica. Accessed July 12, 2017.
- Project MIDAS (2017, July 12) Larsen C calves trillion ton iceberg. Accessed July 12, 2017.
NASA Earth Observatory images by Joshua Stevens, using MODIS and VIIRS data from LANCE/EOSDIS Rapid Response. Story by Maria-Jose Viñas, adapted for Earth Observatory by Kathryn Hansen.
- Instrument(s):
- Aqua – MODIS
- Suomi NPP – VIIRS


