NASA: Soil Moisture Satellite Observes Harvey’s Wrath
September 1st, 2017
Hurricane Harvey has dropped record-breaking amounts of rainfall, particularly around Houston, Texas, since making landfall on August 25, 2017. Yesterday, we showed satellite-based estimates of rainfall, while today’s image shows the storm’s consequences from a different but complementary perspective.
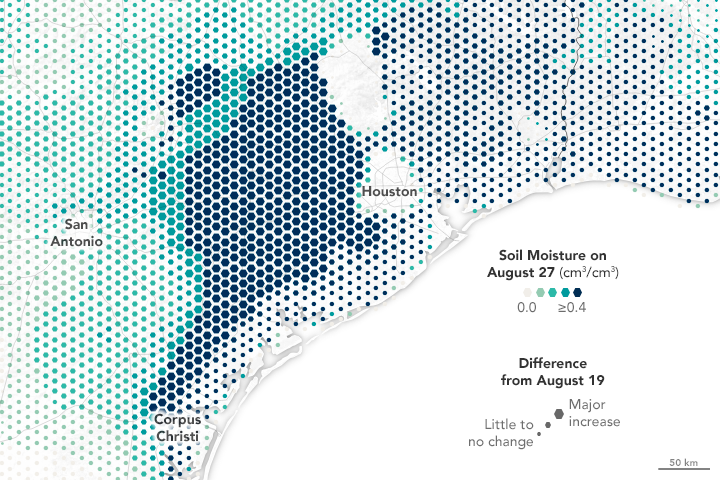
The map above depicts soil conditions around south Texas on August 27 compared to values observed on August 19. Colors on the map represent the amount of surface soil moisture, with the darkest colors representing soil that is saturated or nearly so. The size of each hexagon represents how much the level of soil moisture changed from the days before Harvey to the middle of the event (the most recent date for which we have data). Note that data are sparse in Houston itself, as much of that area is covered by impervious surfaces (roads, buildings, and infrastructure).

