Pneumonic Plague in Johannesburg, South Africa, 1904
December 21st, 2017Volume 24, Number 1—January 2018
Historical Review
Evans CM, Egan JR, Hall I. Pneumonic Plague in Johannesburg, South Africa, 1904. Emerg Infect Dis. 2018;24(1):95-102. https://dx.doi.org/10.3201/eid2401.161817
Pneumonic Plague in Johannesburg, South Africa, 1904
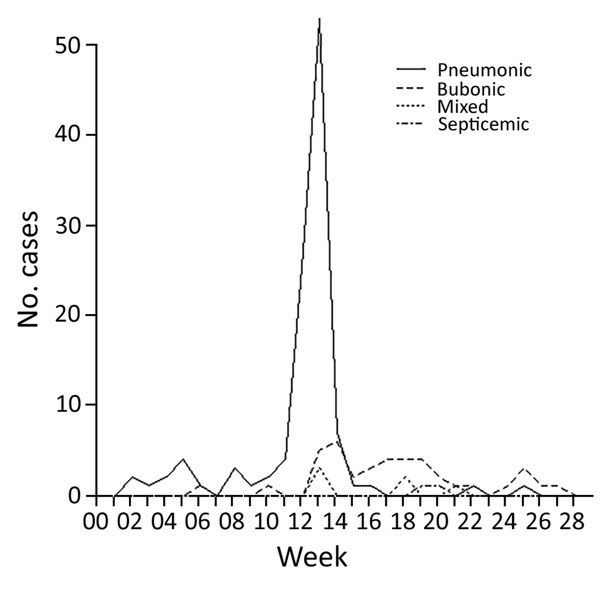
Figure 3

Figure 3. Incidence of the 4 types of plague over the duration of the epidemic in Johannesburg, South Africa, from week ending January 2 to week ending June 16, 1904.
Figure 4

Figure 4. A) Deaths per day resulting from primary pneumonic plague in Johannesburg, South Africa, March 7–31, 1904. B) Back-calculated number of case-patients experiencing symptom onset. Circles represent most likely values; error bars represent 95% CIs. C) Transmissibility of primary pneumonic plague as measured by reproduction number, Rt. Circles represent the most likely values, error bars represent 95% CIs, and shaded polygons represent the period over which Rt was estimated. Uncertainty in the back-calculated incidence has not been accounted for in the transmission estimates, which means that the variations in the time-varying Rt are probably underestimated because the incidence curve is smoothed out somewhat by the back-calculation process (and also reduced slightly because of rounding to the nearest integer). However, because the 7-day sliding window has the effect of smoothing out the Rt estimates in any case, not accounting for the uncertainty in the back-calculation probably has a limited effect on panel C results.


