Archive for January, 2018
In 2017, there were only 20 villages with cases of Guinea worm disease in two countries, both in Africa, compared to 23,735 villages in 21 countries on two continents in 1991.
Tuesday, January 23rd, 2018“…..Without a vaccine or medicine, the ancient parasitic disease is being wiped out mainly through community-based interventions to educate and change behavior, such as teaching people to filter all drinking water and preventing contamination by keeping patients from entering water sources.
In 1986, Guinea worm disease afflicted an estimated 3.5 million people a year in 21 countries in Africa and Asia…..”
Humans become infected by drinking unfiltered water containing copepods (small crustaceans) which are infected with larvae of D. medinensis ![]() . Following ingestion, the copepods die and release the larvae, which penetrate the host stomach and intestinal wall and enter the abdominal cavity and retroperitoneal space
. Following ingestion, the copepods die and release the larvae, which penetrate the host stomach and intestinal wall and enter the abdominal cavity and retroperitoneal space ![]() . After maturation into adults and copulation, the male worms die and the females (length: 70 to 120 cm) migrate in the subcutaneous tissues towards the skin surface
. After maturation into adults and copulation, the male worms die and the females (length: 70 to 120 cm) migrate in the subcutaneous tissues towards the skin surface ![]() . Approximately one year after infection, the female worm induces a blister on the skin, generally on the distal lower extremity, which ruptures. When this lesion comes into contact with water, a contact that the patient seeks to relieve the local discomfort, the female worm emerges and releases larvae
. Approximately one year after infection, the female worm induces a blister on the skin, generally on the distal lower extremity, which ruptures. When this lesion comes into contact with water, a contact that the patient seeks to relieve the local discomfort, the female worm emerges and releases larvae ![]() . The larvae are ingested by a copepod
. The larvae are ingested by a copepod ![]() and after two weeks (and two molts) have developed into infective larvae
and after two weeks (and two molts) have developed into infective larvae ![]() . Ingestion of the copepods closes the cycle
. Ingestion of the copepods closes the cycle ![]() .
.
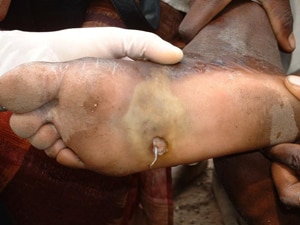 Emergence of a Guinea worm from a foot. Photo credit: E. Wolfe, 2003,The Carter Center
Mental health and disasters
Tuesday, January 23rd, 2018Mental health nurses and disaster response in Sierra Leone
Harris, Dawn et al.
The Lancet Global Health , Volume 6 , Issue 2 , e146 – e147


Almost 36,000 people have fled to temporary shelters as of Tuesday morning, following eruptions of the restive Mayon Volcano
Tuesday, January 23rd, 2018What is Interferon and what does it have to do with the flu?
Monday, January 22nd, 2018Interferon “….(IFN) expression is a mammal’s first response to viral infection. Many viruses have thus evolved mechanisms to evade IFN. Du et al. developed a method to systematically ablate IFN evasion genes from live, attenuated influenza virus…. A combination of mutants was assembled to construct a virus that triggered transient IFN responses in mice but that was unable to replicate effectively. The transient IFN responses led to robust antibody and memory responses that protected against subsequent challenge with different influenza viruses. This approach could be adapted to improve other RNA virus vaccines.
On the way to creating a ‘universal’ flu vaccine
Monday, January 22nd, 2018‘…..The key to the new vaccine is an understanding of the interactions between the virus and interferons, which are proteins that are critical to the body’s immune response. Interferons have two main functions: one is a first line of defense to kill invading viruses very quickly; a second is to coordinate the adaptive immune responses, which provide long-lasting protection against the virus. The latter is the basis of vaccination.
“If viruses do not induce interferons, they will not be killed in the first-line defense; and without interferons, the adaptive immune response is limited,” said Sun, who also is a professor of bioengineering at the UCLA Henry Samueli School of Engineering and Applied Science. “For these reasons, viruses have evolved strategies to evade detection and limit the production of interferons by host organisms.”……’
Antimicrobial Resistance (AMR): Another type of pandemic? “We still face two trends that spell potential disaster: new classes of drugs are not being invented and resistance to existing drugs continues to spread inexorably.”
Monday, January 22nd, 2018“…..The risks posed by AMR have continued to intensify in the five years since the 2013 report. Numerous welcome initiatives have been launched, but concrete successes in addressing the two drivers identified above remain elusive. We still face two trends that spell potential disaster: new classes of drugs are not being invented and resistance to existing drugs continues to spread inexorably. The stakes are incredibly high—if resistance overtakes all our available antibiotics, it would spell the “the end of modern medicine”.…..”
The Pharmaceutical Journal. 2017. “Chief Medical Officer Warns Antibiotic Resistance Could Signal ‘End of Modern Medicine’”. The Pharmaceutical Journal. 17 October 2017. http://www.pharmaceutical-journal.com/news-and-analysis/news/chief-medical-officer-warns-antibiotic-resistance-could-signal-end-of-modern-medicine/20203745.article
Selected AMR Rates
Resistance of Staphylococcus aureus to Oxadcillin (MRSA), % Resistant (invasive isolates)

Resistance of Klebsiella pneumoniae to Cephalosporins (3rd gen), % Resistant (invasive isolates)

Source: Figure courtesy Center for Disease Dynamics, Economics and Policy. Used with permission via Creative Commons license. https://resistancemap.cddep.org/AntibioticResistance.php
Note: Countries in white indicate no data available.
The Philippine Institute of Volcanology and Seismology (PHIVOLCS) declared alert level 4 which warns of an imminent hazardous eruption — possibly within days.
Monday, January 22nd, 2018Level 5 means a hazardous eruption is taking place.
At least 22 people are now known to have died when Taliban militants slaughtered guests at the luxury Intercontinental Hotel in Kabul.
Monday, January 22nd, 20182017 Was the Second Hottest Year on Record
Sunday, January 21st, 2018
Earth’s global surface temperatures in 2017 ranked as the second warmest since 1880, according to an analysis by scientists at NASA’s Goddard Institute for Space Studies (GISS). Continuing the planet’s long-term warming trend, globally averaged temperatures in 2017 were 0.90 degrees Celsius (1.62 degrees Fahrenheit) warmer than the 1951 to 1980 mean. That is second only to global temperatures in 2016.
In a separate, independent analysis, scientists at the National Oceanic and Atmospheric Administration (NOAA) concluded that 2017 was the third-warmest year in their record. The minor difference in rankings is due to slightly different methods used by the two agencies to analyze global temperatures. The long-term records of the two agencies remain in strong agreement, and both analyses show that the five warmest years on record have all taken place since 2010.
The map above depicts global temperature anomalies in 2017, according to the NASA GISS team. The map does not show absolute temperatures; instead, it shows how much warmer or cooler each region of Earth was compared to a baseline average from 1951 to 1980.
Because the locations and measurement practices of weather stations change over time, there are uncertainties in the interpretation of specific year-to-year global mean temperature differences. Taking this into account, NASA estimates that the 2017 global mean change is accurate to within 0.1 degree Fahrenheit, with a 95 percent certainty level.
“Despite colder than average weather in any one part of the world,” said GISS Director Gavin Schmidt, “temperatures over the planet as a whole continue the rapid warming trend we have seen over the last 40 years.”
The animated figure above shows global temperature anomalies for every month since 1880, a result of the Modern-Era Retrospective analysis for Research and Applications, version 2 (MERRA-2) model run by NASA’s Global Modeling and Assimilation Office. Each line shows how much the global monthly temperature was above or below the annual global mean from 1980–2015. The column on the right lists each year when a new global record was set.
Earth’s average surface temperature has risen a little more than 1 degree Celsius (about 2 degrees Fahrenheit) during the past century or so, a change driven largely by increased carbon dioxide and other human-made emissions into the atmosphere. 2017 was the third consecutive year in which global temperatures were more than 1 degree Celsius (1.8 degrees Fahrenheit) above late 19th-century levels.
Phenomena such as El Niño and La Niña—which warm and cool the tropical Pacific Ocean and cause corresponding variations in global wind and weather patterns—contribute to short-term variations in global temperatures. Also, weather dynamics affect regional temperatures, so not every region on Earth experienced similar amounts of warming last year. Warming trends are strongest in the Arctic regions.
The NASA GISS team assembles its analysis from publicly available data acquired by roughly 6,300 meteorological stations around the world; from ship- and buoy-based instruments measuring sea surface temperature; and from Antarctic research stations. This raw data is analyzed using methods that account for the distribution of temperature stations around the globe and for urban heating effects that could skew the calculations. (For more explanation of how the analysis works, read World of Change: Global Temperatures.)
Analyses from the United Kingdom Met Office and the World Meteorological Organization also ranked 2017 among the top three warmest years on record. Scientists from NOAA, WHO, and the UK Met Office use much of the same raw temperature data, but with different baseline periods or slightly different methods to analyze Earth’s polar regions and global temperatures.
-
References and Related Reading
- NASA Goddard Institute for Space Studies (2018) GISS Surface Temperature Analysis (GISTEMP). Accessed January 18, 2018.
- NOAA National Climatic Data Center (2018, January 18) Global Climate Report: Annual 2017. Accessed January 18, 2018.
- NOAA (2018, January 18) 2017 was third warmest year on record for the globe. Accessed January 18, 2018.
- NASA Earth Observatory (2015) World of Change: Global Temperatures.
- NASA Earth Observatory (2015, January 21) Why So Many Global Temperature Records?
- NASA Earth Observatory (2010, June 3) Global Warming.
NASA Earth Observatory images by Joshua Stevens, based on data from the NASA Goddard Institute for Space Studies. Caption by Kate Ramsayer, NASA Goddard Space Flight Center, with Mike Carlowicz.
- Instrument(s):
- Model
- In situ Measurement
The Department of Health and Human Services (HHS): We need more funding to effectively prepare for public health emergencies!
Sunday, January 21st, 2018“…..The hearing focused on the pending reauthorization of the Pandemic and All-Hazards Preparedness Act (PAHPA), a 2006 law that…. implemented several programs aimed at getting the nation ready for emergencies, such as developing and acquiring drugs and vaccines to be used when needed.
“We should be proud of the accomplishments of PAHPA and the progress made over the past decade,” said committee member Sen. Richard Burr (R-N.C.). “It’s created greater certainty and accountability … and established a clear strategy with which we can combat public health threats we face today. But despite this progress, we’re not fully prepared, and more work remains to accomplish this goal.”
The hurricane in Puerto Rico provided solid evidence that much work still remains, testified FDA Commissioner Scott Gottlieb, MD. “The hurricane showed the importance of Puerto Rico to the medical product manufacturing base, and the inadequacies of our supply chain,” he said……”