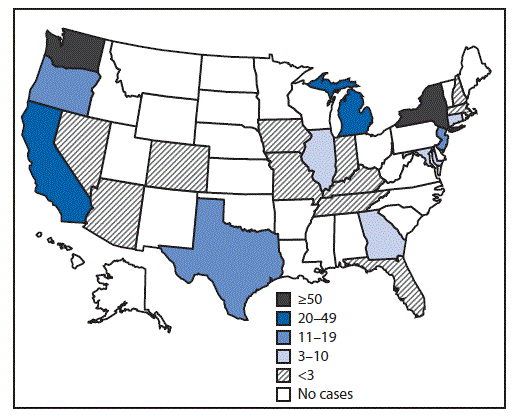
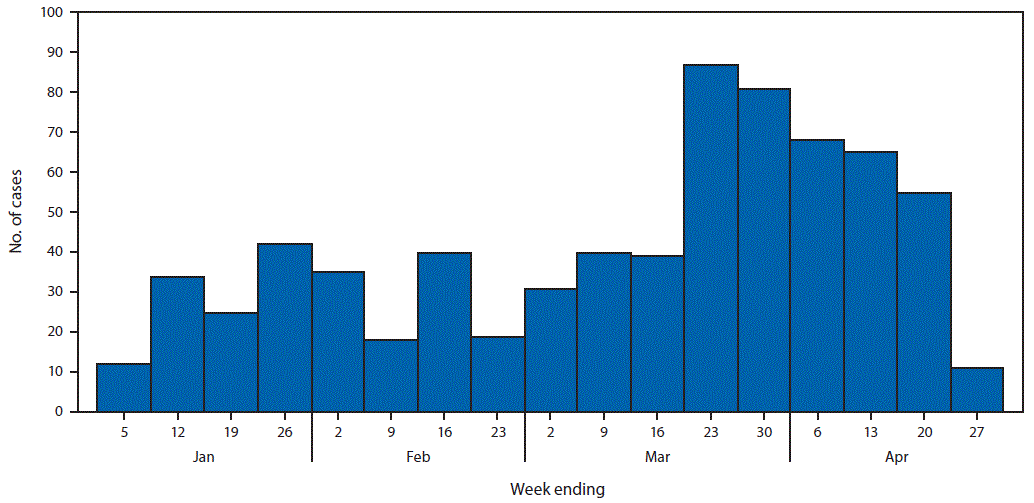
CDC: Measles in the United States, January 1–April 26, 2019
April 30th, 2019
Patel M, Lee AD, Redd SB, et al. Increase in Measles Cases — United States, January 1–April 26, 2019. MMWR Morb Mortal Wkly Rep. ePub: 29 April 2019. DOI: http://dx.doi.org/10.15585/mmwr.mm6817e1external icon.


Selected characteristics of patients with reported measles — United States, January 1–April 26, 2019*
| Characteristic |
No. (%) |
| Total |
704 (100) |
| Age group |
| <6 mos |
25 (4) |
| 6–11 mos |
68 (10) |
| 12–15 mos |
76 (11) |
| 16 mos–4 yrs |
167 (24) |
| 5–19 yrs |
203 (29) |
| 20–49 yrs |
138 (20) |
| ≥50 yrs |
27 (4) |
| Vaccination status |
| Vaccinated |
76 (11) |
| Unvaccinated |
503 (71) |
| Unknown |
125 (18) |
| Hospitalizations |
66 (9) |
| Complications |
|
| Pneumonia |
24 (3) |
| Encephalitis |
0 — |
| Death |
0 — |
| Residency |
| U.S. resident |
689 (98) |
| Internationally imported measles cases |
| Total |
44 (6) |
| Vaccination status† |
| Vaccinated† |
4 (9) |
| Unvaccinated/Unknown |
40 (91) |
| U.S. resident |
34 (77) |
| Source countries† |
| Philippines |
14 (32) |
| Ukraine |
8 (18) |
| Israel |
5 (11) |
| Thailand |
3 (7) |
| Vietnam |
2 (5) |
| Germany |
2 (5) |
| Other |
10 (23) |
* Data are preliminary as of April 26, 2019.
This entry was posted
on
Tuesday, April 30th, 2019 at
1:46 am and is filed under
Measles .
You can follow any responses to this entry through the
RSS 2.0 feed.
Both comments and pings are currently closed.


