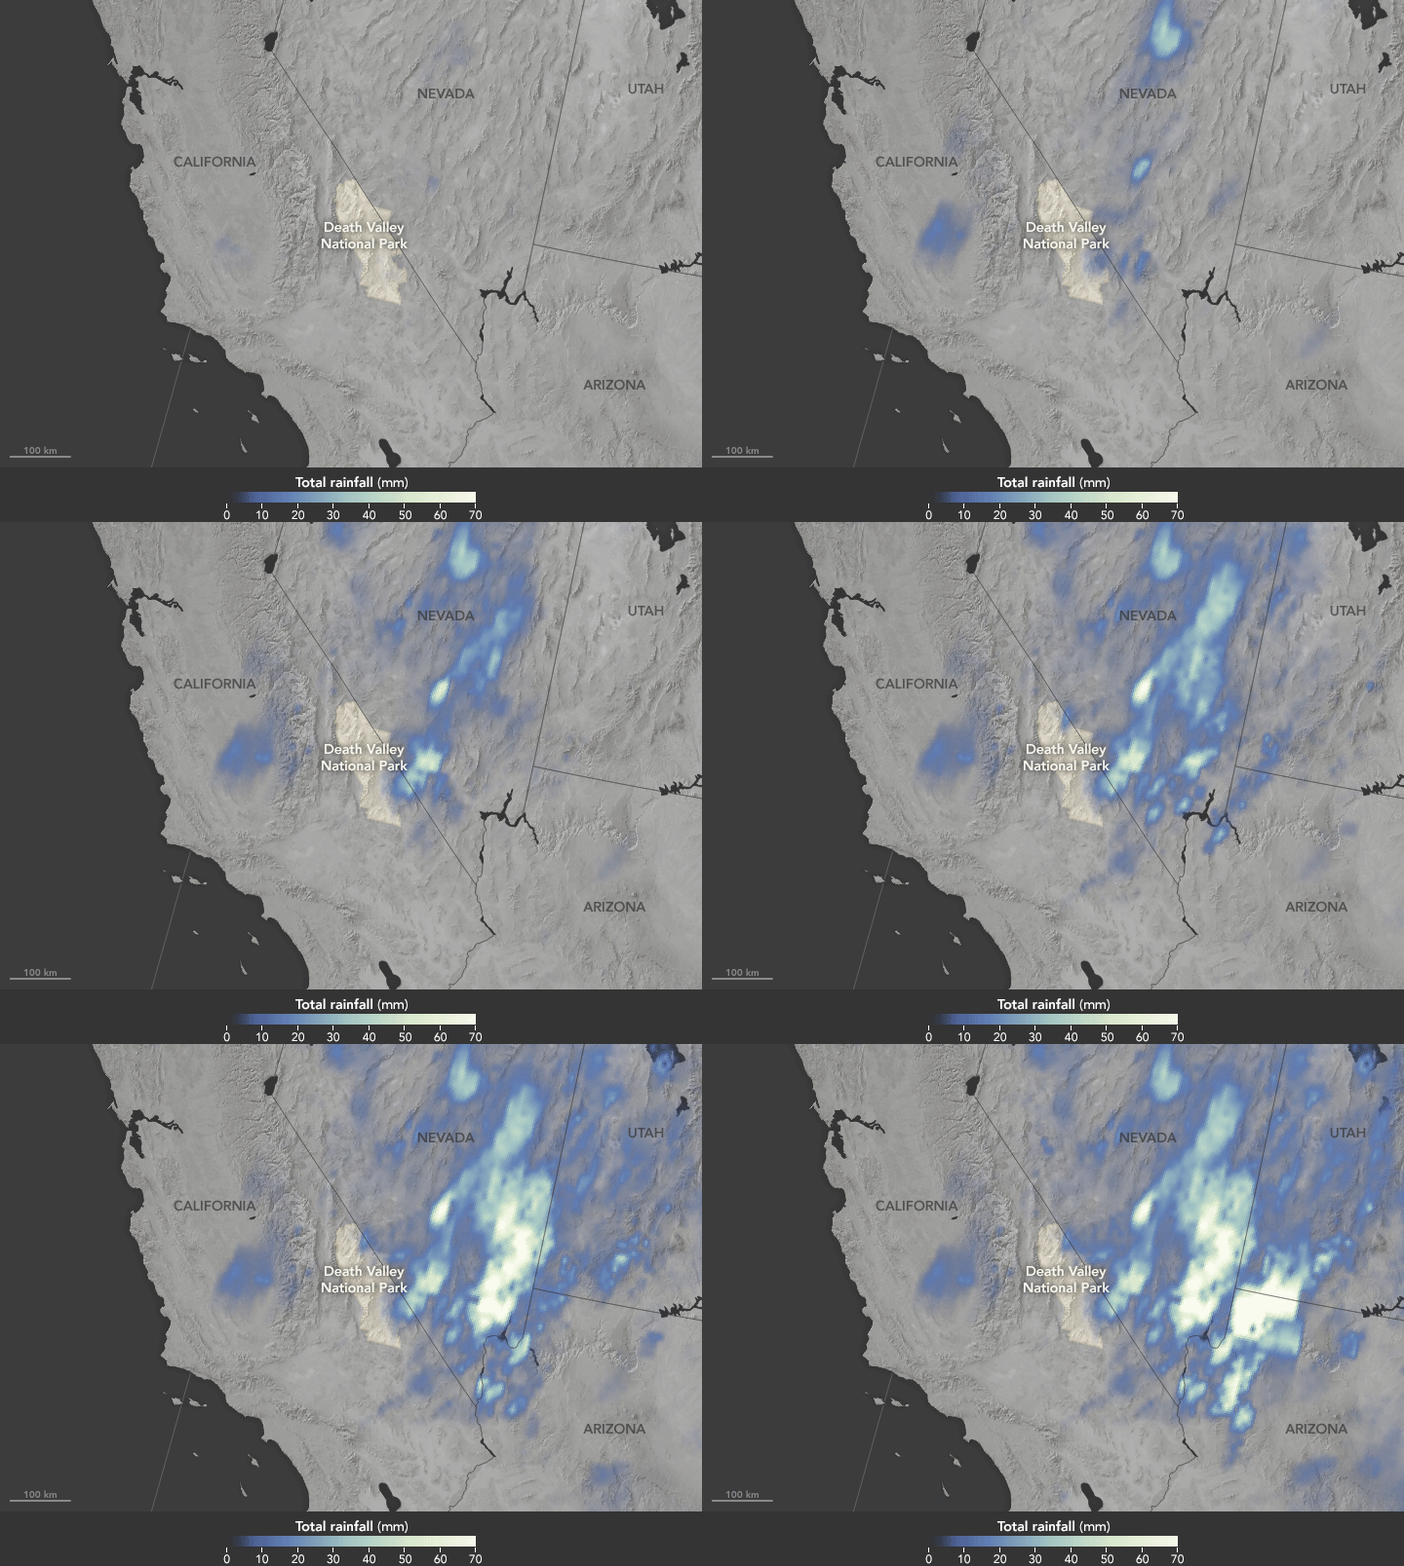
Deluge in the Amargosa and Death Valleys, November 4, 2015
November 29th, 2015
The animation above shows satellite-based estimates of rainfall from a particularly large storm that passed over the area on October 18. The rainfall data are from the Integrated Multi-Satellite Retrievals for GPM (IMERG), a product of the Global Precipitation Measurement mission. Green-white colors represent the largest rainfall totals, which in some areas reached upward of 70 millimeters (3 inches) during the 24-hour period displayed in the animation. These regional, remotely-sensed estimates may differ from the totals measured by ground-based weather stations.
Comments are closed.
Categories
- 2019 Novel Coronavirus (100)
- Acute flaccid myelitis (AFM) (12)
- Air (1)
- Alkhurma hemorrhagic fever (AHF) (1)
- Aluminium phosphide (1)
- AMR-Antimicrobial Resistance (3)
- Anaplasmosis (3)
- Angiostrongylus cantonensis (4)
- Animals/Pets (13)
- Anthrax (20)
- Avalanche (16)
- Aviation (70)
- Bioterrorism (30)
- Blast Effects/Injuries (35)
- Botulism (32)
- Buruli ulcer (1)
- Cancer (6)
- Candida auris (9)
- CBIRNE (3)
- CCHF (2)
- CDC (111)
- Chagas Disease (8)
- Chemical Threats (43)
- Chikungunya (62)
- China (12)
- Cholera (83)
- Ciguatera (4)
- Civil unrest (38)
- Climate Change (64)
- CO (4)
- Coccidioidomycosis (1)
- Communicable diseases (7)
- Conflict (117)
- Cyanide (2)
- Cyberterrorism (6)
- Cyclospora (5)
- Dengue (50)
- Diarrhea (5)
- Diphtheria (6)
- Documents (96)
- Drills/exercises (24)
- Drought (9)
- E. coli O157:H7 (5)
- Earthquake (213)
- Eastern Equine Encephalitis (1)
- Ebola (171)
- Echovirus 30 (1)
- Education (17)
- Elephantiasis (lymphatic filariasis (2)
- EMS (7)
- Environment (33)
- Ethics (5)
- Europe (6)
- Explosives (47)
- Famine (12)
- FBI (7)
- FCC (1)
- FDA (16)
- FEMA (45)
- FGM (Female Genital Mutilation) (15)
- Filariasis (2)
- Fires/Wildfires (251)
- First Responders (22)
- Flood (161)
- Folic Acid (1)
- Food-borne diseases (104)
- Global Health (129)
- Guinea worm disease/Dracunculiasis (9)
- H3N2 (3)
- H5N6 (1)
- H7N9 (50)
- H9N2 (1)
- Haff Disease (1)
- Hajj (1)
- Hanta virus (1)
- Hazardous Materials (HAZMAT) (84)
- Hepatitis C (16)
- Historical (382)
- Historical Event (397)
- HIV/AIDS (10)
- Homeland Security (7)
- Hookworm (1)
- Human Rights (26)
- Humanitarian (107)
- Influenza (136)
- Kids-Infants (112)
- Konzo (2)
- Landslides/mudslides (22)
- Lassa Fever (31)
- Lead poisoning (2)
- Legionnaire's Disease (6)
- Leishmaniasis (10)
- Leprosy (5)
- Leptospirosis (4)
- Lightning (3)
- Listeria (6)
- Loiasis (1)
- Malaria (55)
- Malnutrition (6)
- Maritime (58)
- Mass fatalities (69)
- Mass Gatherings (19)
- Mass shooting (197)
- Mayaro fever (1)
- MCI (4)
- Measles (49)
- Melioidosis (6)
- Meningitis (9)
- Mental health (11)
- MERS-CoV (157)
- Microplastics (1)
- Migration (128)
- Monkeypox (6)
- Mumps (3)
- Mycetoma (1)
- Naegleria fowleri (9)
- NASA (28)
- NDMS/DMAT (2)
- Neglected Tropical Diseases (15)
- Neurocysticercosis (1)
- Nipah virus (11)
- NOAA (2)
- Nodding Syndrome (1)
- Non-communicable diseases (3)
- Norovirus (1)
- Novichok (12)
- Ntwetwe virus (1)
- Nuclear-Radiation-Contamination (70)
- Obesity (2)
- Onchocerciasis (river blindness) (3)
- ORT (1)
- Pandemic (93)
- PFAs (1)
- PHEMCE (3)
- Plague (40)
- Podoconiosis (2)
- PODs (2)
- Polio (33)
- Pollution (10)
- Public Health (25)
- Rabies (35)
- Red Cross/Red Crescent (9)
- Ricin (8)
- Rift Valley Fever (5)
- Riots (15)
- Rocky Mountain Spotted Fever (2)
- Rohingya (63)
- Rotavirus (2)
- Salmonella (4)
- Salt (1)
- Schistosomiasis (5)
- Scurvy (1)
- Seoul Virus (1)
- SFTS (9)
- Silicosis (1)
- Slavery (6)
- Smallpox (10)
- Smog (6)
- Snake envenomation (7)
- Social media (2)
- Stampede (17)
- STI (1)
- Strategic National Stockpile (9)
- Structural (71)
- Sword's Point (1)
- TB (8)
- Telemedicine (1)
- Terrorism (443)
- Tetanus (4)
- Thelaziasis (2)
- Tick-borne diseases (1)
- Tobacco (3)
- Tornado (33)
- Trachoma (10)
- Trafficking (11)
- Transportation incident (103)
- Trauma (5)
- Triage (2)
- Trichinosis (1)
- Tropical cyclones (470)
- Tropical storms (336)
- Tsunami (22)
- Tuberculosis (12)
- Tularemia (2)
- Typhoid fever (2)
- Uncategorized (103)
- United Nations (14)
- USDA (3)
- Usutu virus (1)
- VHF (10)
- Vibrio vulnificus (2)
- Volcano (82)
- Water (28)
- Weather (186)
- West Nile Virus (11)
- WHO (124)
- Women issues (37)
- Wuhan (55)
- Yellow Fever (86)
- Zika virus (271)
Recent Posts
Archives
- February 2022
- December 2021
- May 2021
- April 2021
- March 2021
- February 2021
- January 2021
- December 2020
- November 2020
- October 2020
- September 2020
- August 2020
- July 2020
- June 2020
- March 2020
- February 2020
- January 2020
- December 2019
- November 2019
- October 2019
- September 2019
- August 2019
- July 2019
- June 2019
- May 2019
- April 2019
- March 2019
- February 2019
- January 2019
- December 2018
- November 2018
- October 2018
- September 2018
- August 2018
- July 2018
- June 2018
- May 2018
- April 2018
- March 2018
- February 2018
- January 2018
- December 2017
- November 2017
- October 2017
- September 2017
- August 2017
- July 2017
- June 2017
- May 2017
- April 2017
- March 2017
- February 2017
- January 2017
- December 2016
- November 2016
- October 2016
- September 2016
- August 2016
- July 2016
- June 2016
- May 2016
- April 2016
- March 2016
- February 2016
- January 2016
- December 2015
- November 2015

