Archive for the ‘CDC’ Category
2016-2017 Influenza Season Week 3 ending January 21, 2017
Tuesday, January 31st, 20172016-2017 Influenza Season Week 3 ending January 21, 2017
All data are preliminary and may change as more reports are received.
Synopsis:
During week 3 (January 15-21, 2017), influenza activity increased in the United States..
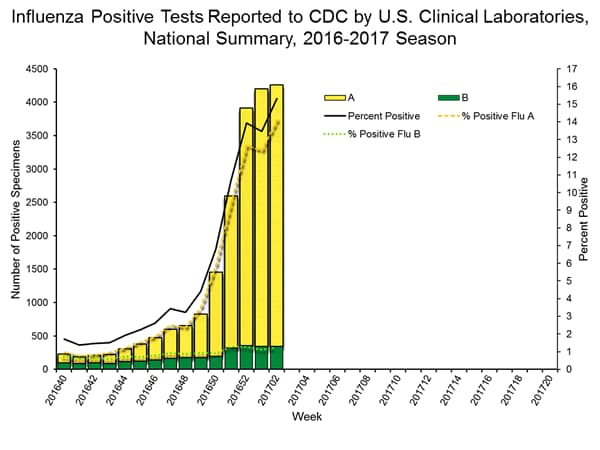
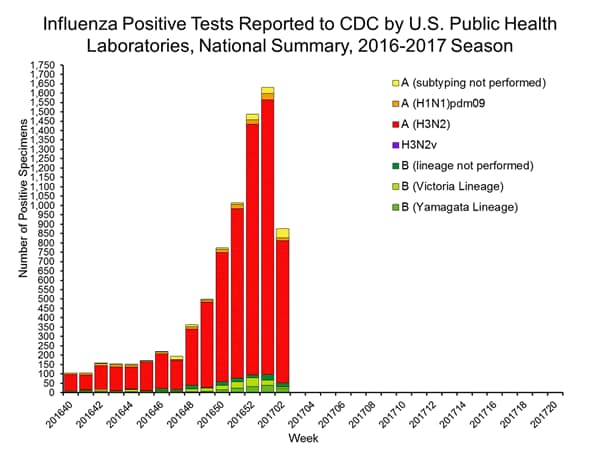
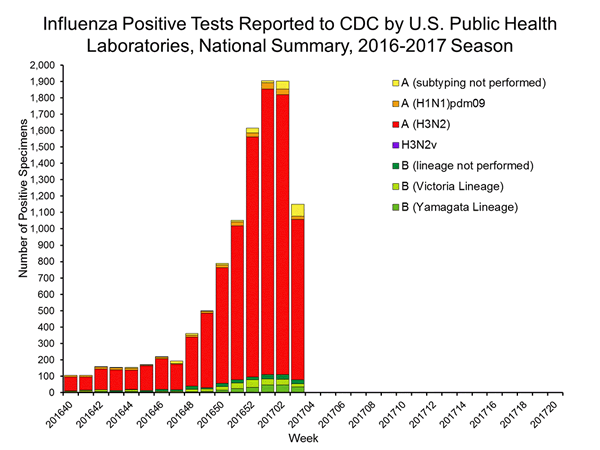
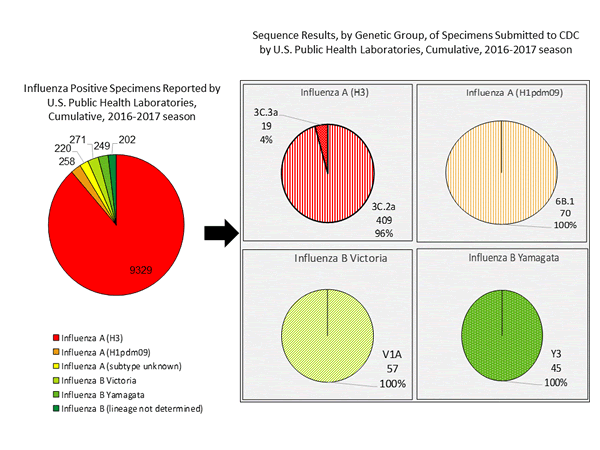
- Viral Surveillance: The most frequently identified influenza virus subtype reported by public health laboratories during week 3 was influenza A (H3). The percentage of respiratory specimens testing positive for influenza in clinical laboratories increased.
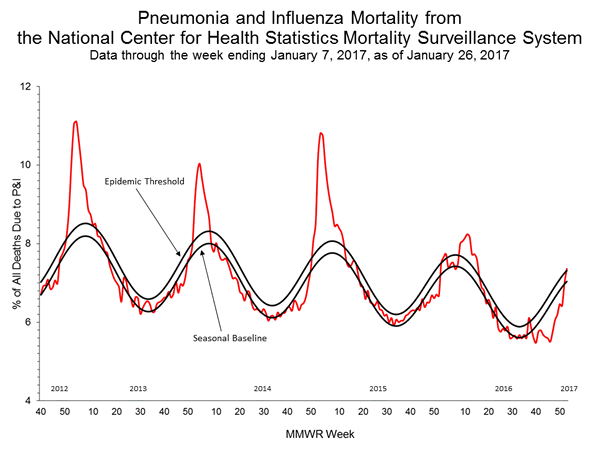
- Pneumonia and Influenza Mortality: The proportion of deaths attributed to pneumonia and influenza (P&I) was above the system-specific epidemic threshold in the National Center for Health Statistics (NCHS) Mortality Surveillance System.
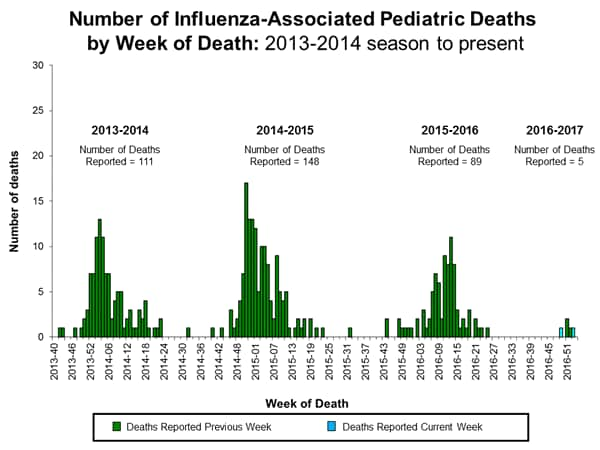
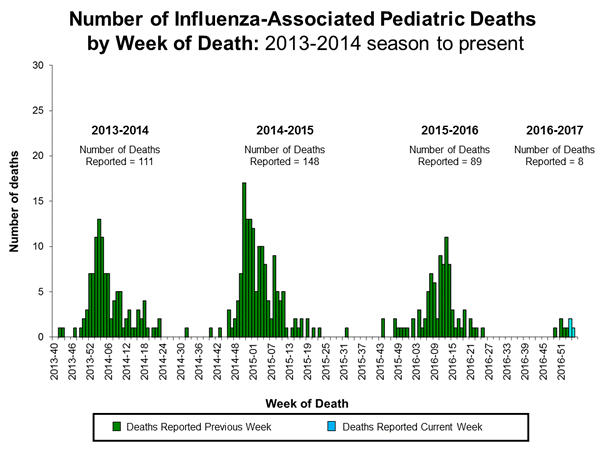
- Influenza-associated Pediatric Deaths: Three influenza-associated pediatric deaths were reported.
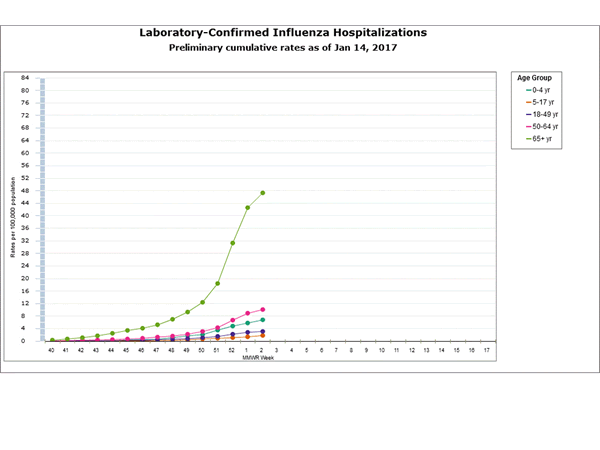
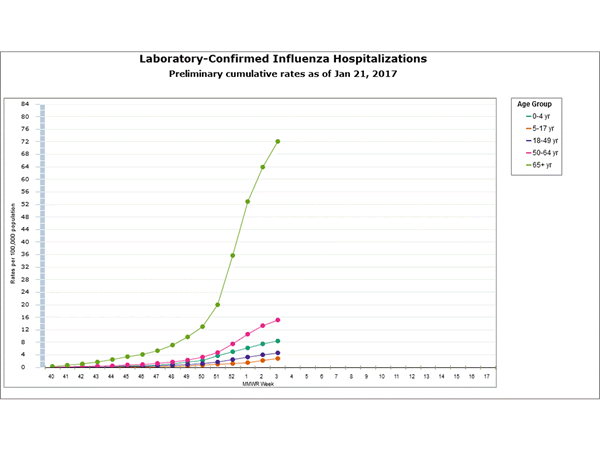
- Influenza-associated Hospitalizations: A cumulative rate for the season of 15.4 laboratory-confirmed influenza-associated hospitalizations per 100,000 population was reported.
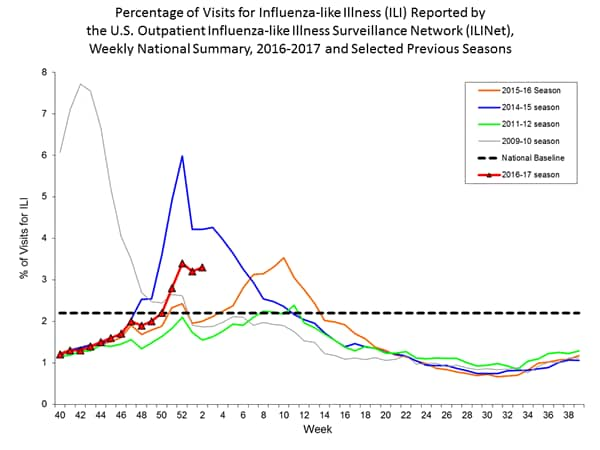
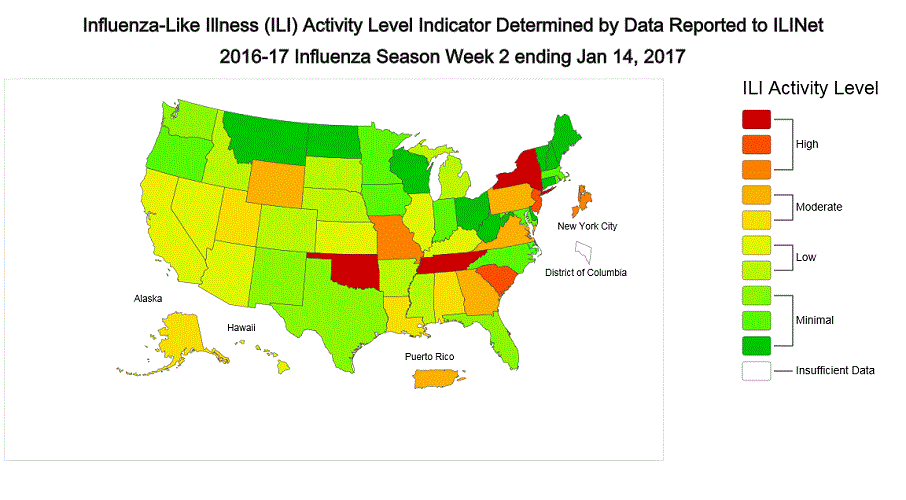
- Outpatient Illness Surveillance:The proportion of outpatient visits for influenza-like illness (ILI) was 3.4%, which is above the national baseline of 2.2%. All 10 regions reported ILI at or above their region-specific baseline levels. New York City and 10 states experienced high ILI activity; 10 states experienced moderate ILI activity; Puerto Rico and 17 states experienced low ILI activity; 13 states experienced minimal ILI activity, and the District of Columbia had insufficient data.
- Geographic Spread of Influenza: The geographic spread of influenza in Puerto Rico and 37 states was reported as widespread; Guam and 12 states reported regional activity; the District of Columbia and one state reported local activity; and the U.S. Virgin Islands reported no activity.
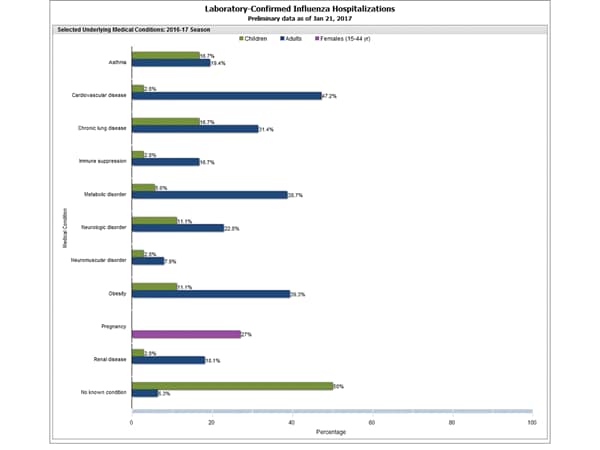
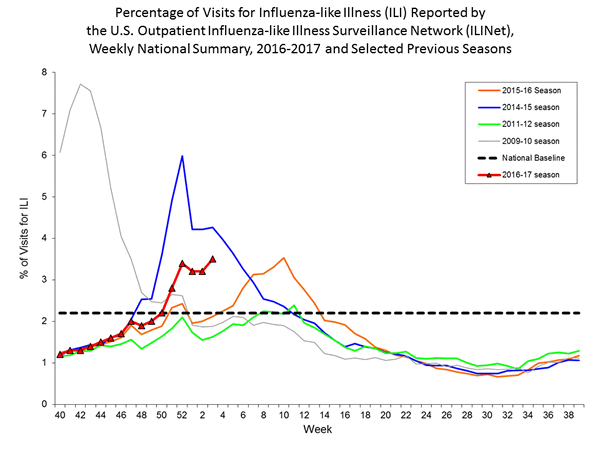
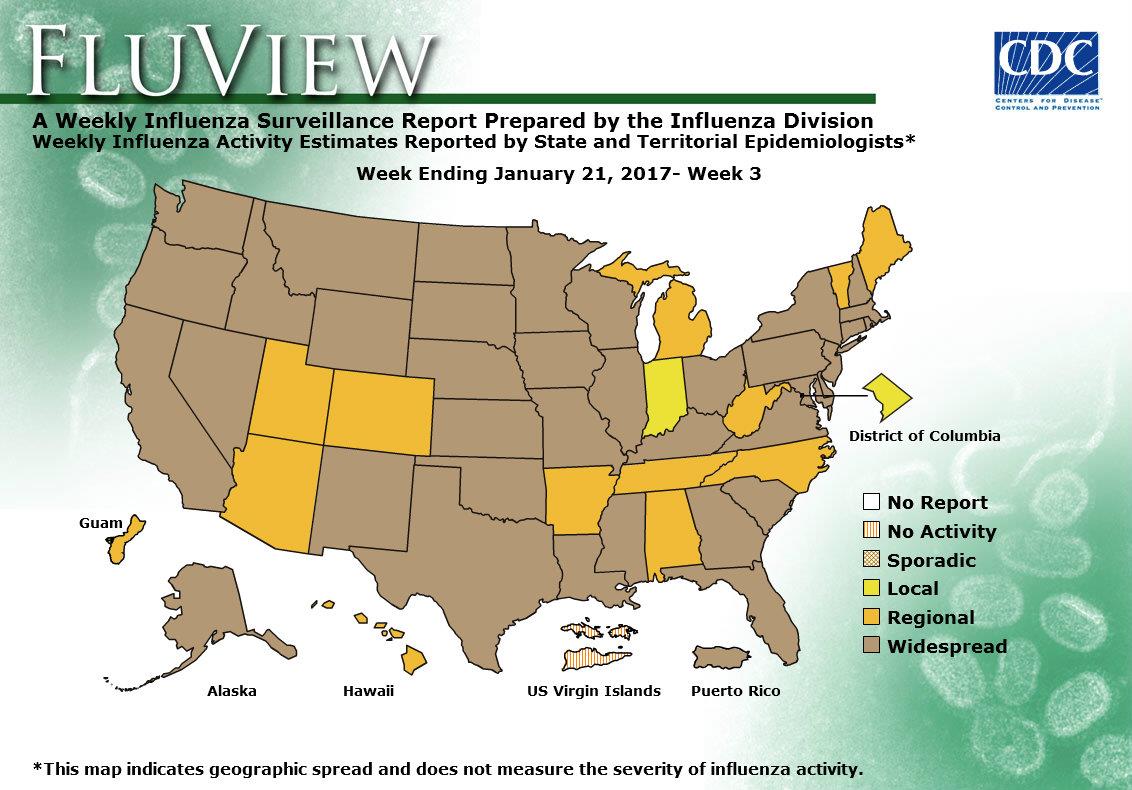
CDC–Questions and Answers – Final Rule for Control of Communicable Diseases: Interstate and Foreign
Wednesday, January 25th, 2017Federal isolation and quarantine are authorized for these communicable diseases:
- Cholera
- Diphtheria
- Infectious tuberculosis
- Plague
- Smallpox
- Yellow fever
- Viral hemorrhagic fevers
- Severe acute respiratory syndromes
- Flu that can cause a pandemic
Federal isolation and quarantine are authorized by Executive Order of the President. The President can revise this list by Executive Order.
Overview
The Department of Health and Human Services (HHS), Centers for Disease Control and Prevention (CDC) published the final rule for the Control of Communicable Diseases on January 19th, 2017 which includes amendments to the current domestic (interstate) and foreign quarantine regulations for the control of communicable diseases. The final rule is published on the Office of the Federal Register’s website.
These amendments have been made to better protect the public health of the United States and reflect public comments received regarding the Notice of Proposed Rulemaking (NPRM) published on August 15, 2016. This final rule improves CDC’s ability to protect against the introduction, transmission, and spread of communicable diseases while ensuring due process. This rule will become effective on February 21st, 2017 (30 days from publication).
Public Comments to the NPRM
HHS/CDC published a Notice of Proposed Rulemaking on August 15, 2016, and received 15,800 public comments from individuals, stakeholders, and other interested parties during the 60-day comment period. We note that many commenters raised concerns about forced vaccinations or compulsory medical treatment. We emphasize that this final rule does not authorize compulsory medical testing, vaccinations, or medical treatment without prior informed consent.
Other comments covered a range of topics, including: proposed agreements entered into between the CDC and persons subject to public health orders, CDC’s constitutional and statutory authority for carrying out its public health activities, data collection from airline and vessel operators, communicable diseases subject to federal isolation and quarantine, due process concerns, concerns about electronic monitoring and surveillance of persons subject to public health orders, the proposed definition and requirements for airline and vessel operators to report an “ill person,” concerns about public health assessments being made by non-medically trained personnel, payment for hospital and other expenses for persons subject to public health orders, the proposed definition of “indigent,” and concerns about CDC’s description of existing criminal penalties that appear in statute.
As a result of these comments, CDC made many significant changes from the NPRM to the Final Rule. Changes are described in detail below.
What has CDC changed in the Final Rule as a result of public comment?
After reviewing and carefully considering the comments on the Notice of Proposed Rulemaking, HHS/CDC made the following changes to the rule:
- Removed the proposed provision, definition, and references to “Agreements.”
- Added a requirement that CDC serve an individual with a public health order within 72 hours after apprehending the individual.
- Added a requirement for CDC to advise an individual subject to a medical examination that the examination will be conducted by an authorized, licensed health worker and with prior informed consent.
- Added a requirement that CDC provide for translation or interpretation services as needed for federal orders and during the medical review.
- Added a requirement that the Director arrange for adequate food and water, appropriate accommodation, appropriate medical treatment, and means of necessary communication, for individuals who are apprehended or held in federal quarantine or isolation.
- Clarified how CDC considers and determines how to use the least restrictive means in quarantining or isolating an individual to protect the public’s health.
- Added a right to counsel by changing the definition of Medical Representative to “Representatives” and added the additional appointment of “an attorney who is knowledgeable of public health practices” for an indigent individual who requests a medical review.
- Increased the threshold for those who may be considered “indigent” to 200% of the federal poverty level (the NPRM proposed a 150% threshold), so that more individuals may qualify for appointment of a medical representative and an attorney.
- Further explained that the definitions of both “representatives” and “medical reviewer” allow for the appointment of non-HHS/CDC employees in these capacities. The regulations, moreover, explicitly state that the medical reviewer will not be the same individual who initially authorized the federal quarantine or isolation order.
- Modified the definition of “electronic or internet-based monitoring” by clarifying that this definition pertains to the means by which CDC may communicate with an individual (e.g., Skype, email, cellular phone calls).
- Added a requirement that the Director must respond to a request for a travel permit within 5 business days and must respond to an appeal of a denial of a travel permit within 3 business days.
- Modified the definition of non-invasive to (1) replace “physical inspection” with “visual inspection,” (2) specify that the individual performing the assessment must be a “public health worker” and (3) remove “auscultation, external palpation, external measurement of blood pressure.” The definition has also been clarified to explain that the public health worker who conducts the public health risk assessment is “an individual with education and training in the field of public health.”
Who is affected by CDC’s new foreign and domestic communicable disease regulations?
These regulations generally apply to persons (regardless of citizenship or nationality) arriving into the United States from foreign countries or traveling between U.S. states or territories. Certain provisions of these regulations also apply to conveyance operators (e.g., the operator of an airplane, ship, bus, or train) or persons attempting to import an animal or other product into the United States.
Does this rule authorize mandatory vaccination without informed consent?
No, this final rule does not authorize compulsory vaccination, medical testing, or medical treatment without a patient’s informed consent. When a medical examination is ordered as part of an isolation or quarantine order, the medical exam is conducted by trained clinical staff at a hospital who are responsible for obtaining informed consent. The final rule now requires that the CDC Director, as part of the Federal order authorizing a medical examination, advise the individual that the medical examination will be conducted by an authorized, licensed health worker and with prior informed consent.
How does CDC protect data it collects about travelers?
CDC is committed to protecting the privacy of personally identifiable information collected and maintained under the Privacy Act of 1974. On December 13, 2007, HHS/CDC published a notice of a new system of records (SORN) under the Privacy Act of 1974 for activities covered under this final rule.
Under this system of records, CDC will only release data collected under this rule and subject to the Privacy Act to authorized users as legally permitted. CDC will take precautionary measures including implementing the necessary administrative, technical and physical controls to minimize the risks of unauthorized access to medical and other private records. In addition, CDC will make disclosures from the system only with the consent of the subject individual, in accordance with the routine uses published in its SORN, or as allowed under an exception to the Privacy Act. Furthermore, CDC will apply the protections of the SORN to all travelers regardless of citizenship or nationality.
How does CDC store the data provided by airlines and/or vessels?
This data is currently stored in the Quarantine Activity Reporting System (QARS) and data is kept in accordance with the records retention schedule. The National Archives and Records Administration (NARA) maintains the official Records Control Schedule (RCS) repository. The repository contains scanned versions of approved records schedules, or Standard Forms 115, Request for Records Disposition Authority.
Protecting People’s Rights
How does the final rule protect people’s rights to due process?
The final rule is a significant improvement over previous regulations that contained no explicit due process protections. In response to public comment, the final rule added many strong due process protections for individuals subject to federal public health orders. These protections include:
- The right to a written order that explains the reasons why the CDC considers quarantine or isolation to be necessary and your rights if held in federal quarantine or isolation;
- The right to have this written order served on you within 72 hours after being apprehended;
- The right to adequate food and water, appropriate accommodation, appropriate medical treatment, and means of necessary communication while apprehended or if held in federal quarantine or isolation;
- The right to have CDC reassess its written order within 72 hours after it is served on you to ensure that the CDC has not made a mistake, that there is a continued public health need for federal quarantine or isolation, and that the CDC is using the least restrictive means to protect the public’s health;
- The right to request a medical review after the CDC has reassessed its written order and if the CDC has determined that quarantine or isolation is still necessary;
- The right to have a medical review conducted by a medical reviewer (a medical professional other than the person who issued the quarantine or isolation order) and to have the medical reviewer make findings of fact, issue a report and recommendation to the CDC Director, and make his/her own determination as to whether the CDC is using the least restrictive means to protect the public’s health;
- The right to present witnesses and testimony at the medical review, and to be represented at the medical review by either an advocate (e.g., an attorney, family member, or physician) at your own expense, or, if indigent, to have representatives (i.e., a medical professional and an attorney) appointed at the government’s expense.
- Acknowledgement that you still have the right to go to court.
Can the “medical reviewer” and “representatives” be people from outside the CDC?
The final rule defines both “representatives” and “medical reviewer” in a manner that would allow for the appointment of non-HHS/CDC employees in these capacities at the Director’s discretion. For individuals qualifying as indigent, CDC generally intends to provide independent legal counsel from outside of the agency. However, to maintain flexibility and ensure that medical reviews are conducted in a timely fashion, CDC has retained language in the final rule stating that representatives and the medical reviewer, “may include an HHS or CDC employee.”
Does the final rule require CDC to use the least restrictive means to protect the public’s health?
Yes, CDC will carry out its authorities for isolation and quarantine consistent with principles of using the least restrictive means to protect the public’s health. In general, this means that the CDC will attempt to obtain voluntary compliance with public health measures and explore options such as the appropriateness of a home environment if quarantine or isolation is necessary.
Does the final rule preserve people’s right to go to court?
Yes, the final rule explicitly states that it does not affect the constitutional or statutory rights of individuals to obtain judicial review of their federal detention. Individuals who are detained in federal isolation or quarantine may file a petition for a writ of habeas corpus as appropriate.
Is the final rule consistent with the International Health Regulations?
Yes, the final rule is consistent with U.S. obligations under the IHR. In addition to implementing the final rule consistent with U.S. constitutional requirements, CDC’s implementation will also be consistent with IHR Article 32 which, among other things, requires provision of basic necessities, protection of baggage and other possessions, appropriate accommodation, arranging for appropriate medical treatment, and means of communication for international travelers subject to public health orders.
CDC’s Authority Under this Rule
Does the final rule expand CDC’s authority?
No, the final rule does not expand the authority granted to the CDC by Congress to place individuals into quarantine or isolation, nor does it change the formal list of diseases subject to federal isolation or quarantine, which is established only by an Executive Order of the President.
What communicable diseases are subject to federal isolation and quarantine?
CDC’s authority to order isolation or quarantine is limited to people who the CDC reasonably believes to be infected with a quarantinable communicable disease(https://www.cdc.gov/quarantine/aboutlawsregulationsquarantineisolation.html) as defined by Executive Order of the President; the current list of these diseases is available here(https://www.cdc.gov/quarantine/aboutlawsregulationsquarantineisolation.html).
This list currently includes cholera, diphtheria, infectious tuberculosis, plague, smallpox, yellow fever, viral hemorrhagic fevers (Lassa, Marburg, Ebola, Crimean-Congo, South American, and others not yet isolated or named), severe acute respiratory syndromes (e.g., SARS, MERS), and influenza caused by novel or reemergent influenza viruses that are causing, or have the potential to cause, a pandemic.
If an individual does not have, or is not suspected of having, one of these illnesses, CDC cannot hold the individual for quarantine or isolation.
When does CDC use its federal authority?
CDC generally uses its federal authority to isolate a sick person or quarantine an exposed person only in rare situations where states do not have jurisdiction or are otherwise unable to use their authority. For example, CDC has used its isolation authority at international airports and land border crossings. CDC may also use its authority if a state or local authority requests assistance from CDC or in the event of inadequate local control.
What about a State’s responsibility for isolation or quarantine?
The final rule is consistent with U.S. principles of federalism (the relationship between the federal government and state/local governments). By statute, federal public health regulations do not preempt state or local public health regulations, except in the event of a conflict with the exercise of federal authority. The final rule does not change the long-standing provision at 42 C.F.R. 70.2 authorizing CDC to take measures to prevent the interstate spread of communicable diseases in the event of inadequate local control. The final rule recognizes that CDC by statute has a primary role at ports of entry and in other time-sensitive situations where state and local public health authorities may not be present or where measures taken by these authorities are inadequate to prevent communicable disease spread.
Why does CDC use the term “apprehension” in the final rule?
CDC uses the term “apprehension” because this is the term used under the Public Health Service Act at 42 U.S.C. 264. CDC may apprehend, detain, examine, or conditionally release people who it reasonably believes are infected with communicable diseases that are specified in an Executive Order of the President. CDC published this final rule to provide greater transparency regarding its processes and procedures around quarantine and isolation.
How does CDC determine if someone should be apprehended?
Before issuing a quarantine or isolation order(https://www.cdc.gov/quarantine/aboutlawsregulationsquarantineisolation.html), CDC conducts a public health risk assessment that takes into account symptoms and possible exposures.
CDC may apprehend, detain, examine, or conditionally release an individual if it reasonably believes that he/she may be infected with or exposed to a quarantinable communicable disease.
The final rule defines reasonable belief as the existence of “specific articulable facts upon which a public health officer could reasonably draw the inference that an individual has been exposed, either directly or indirectly, to the infectious agent that causes a quarantinable communicable disease, as through contact with an infected person or an infected person’s bodily fluids, a contaminated environment, or through an intermediate host or vector, and that as a consequence of the exposure, the individual is or may be harboring in the body the infectious agent of that quarantinable communicable disease.”
How long can someone be apprehended and detained?
The final rule defines an apprehension as “the temporary taking into custody of an individual or group for purposes of determining whether quarantine, isolation, or conditional release is warranted.” Under the final rule, CDC must serve an individual with a federal order for quarantine, isolation, or conditional release within 72 hours after taking that person into custody.
Isolation would last for the period of communicability of the illness, which varies by disease and the availability of specific treatment. Quarantine lasts only as long as necessary to protect the public by (1) providing public health care (such as voluntary immunization or drug treatment, as required) and (2) ensuring that quarantined persons do not infect others if they have been exposed to a contagious disease.
Why does the final rule define “public health emergencies”?
The final rule does not expand CDC’s authority to quarantine or isolate individuals or eliminate the formal list of diseases subject to federal isolation or quarantine. By statute, CDC authority to apprehend, detain, or examine an individual is limited to those quarantinable communicable diseases that are specified in an Executive Order of the President and cannot be changed by the CDC.
The final rule defines “public health emergency” because by statute CDC may only apprehend and detain an individual who is moving between U.S. states if the individual is in the “qualifying stage” of a quarantinable communicable disease. The “qualifying stage” is defined by statute as the “communicable stage” of the disease or a “precommunicable stage, if the disease would be likely to cause a public health emergency if transmitted to other individuals.” The final rule defines “public health emergency” so that people will better understand CDC’s processes and procedures around quarantine and isolation.
Using Effective Public Health Measures
Are the public health measures described in this final rule effective?
Yes, the final rule is consistent with scientific principles and best practices of modern isolation and quarantine. Modern isolation and quarantine lasts only as long as necessary to protect the public by (1) providing a public health intervention (such as voluntary testing or drug treatment, as appropriate and with the informed consent of the patient) and (2) ensuring that persons under isolation and quarantine do not infect others if they have been exposed to or are capable of spreading a quarantinable communicable disease.
Protecting Travelers through Illness Reporting
If someone is reported as being “ill” under the definition in the final rule, what will happen?
The final rule does not expand CDC’s authority to quarantine or isolate individuals or eliminate the formal list of diseases subject to federal isolation or quarantine. By statute, CDC authority to apprehend, detain, or examine an individual is limited to quarantinable communicable diseases that are specified in an Executive Order of the President. The final rule defines an “ill person” for purposes of determining when a public health investigation of an ill traveler onboard a flight or ship may be required. An “ill person” is not automatically subject to federal isolation and quarantine.
What are the new reporting requirements for airplanes and ships?
Airline pilots and ship operators are required to report all deaths on board, and certain overt and common signs and symptoms of sick travelers to the CDC and before arriving into the United States. HHS/CDC has also requested that other symptoms of communicable diseases be routinely reported to the CDC. This rule makes these commonly requested symptoms (already routinely and voluntarily reported to CDC) required reporting.
This final rule does not change any current operations of CDC’s Vessel Sanitation Program or make any substantive changes in gastrointestinal illness (i.e. diarrheal) reporting for vessels. Updated lists of the additional required signs and symptoms are in the table below.
| Airlines | Ships |
|---|---|
| (1) Fever (defined as measured temperature of 100.4°F [38°C] or greater, feels warm to the touch, or gives a history of feeling feverish)
AND one of the following:
(2) Fever that has persisted for more than 48 hours; OR (3) Other signs or symptoms of communicable disease CDC is concerned about and has announced in the Federal Register. |
(1) Fever (defined as measured temperature of 100.4°F [38°C] or greater, feels warm to the touch, or gives a history of feeling feverish)
AND one of the following:
(2) Fever that has persisted for more than 48 hours; OR (3) Acute gastroenteritis (inflammation of stomach or intestines or both), defined as:
(4) Other signs or symptoms of communicable disease CDC is concerned about and has announced in the Federal Register. |
Why has HHS/CDC updated the definition of “ill person”?
The updated definition includes additional signs and symptoms that might be expected in a person who has a quarantinable communicable disease or another serious communicable disease that could spread through travel. By giving airlines and ships this updated definition, CDC is increasing the likelihood that a sick person with a communicable disease will be recognized by the CDC. The new definition also more closely matches international standards for disease reporting published by the International Civil Aviation Organization (ICAO, the United Nations specialized agency for air travel). Finally, the new definition allows the CDC Director to update the definition through notice in the Federal Register if new information suggests that additional signs or symptoms should be reported to limit the risk of disease spread through travel.
Why is the definition of “ill person” different for airline and ship operators?
The “ill person” definition is different for airlines and ships because in general, travelers spend more time on ships than they do on a plane. As a result, there is more time to monitor travelers on ships for signs and symptoms of disease. Cruise ships usually have a medical provider on board who can complete a medical examination of the sick traveler, and both cruise and cargo ships can request a consultation from CDC long before the ship arrives at a port of entry.
What is the updated reporting requirement for domestic airlines? Is this a new procedure?
With these updates, airline crews flying between states must report directly to CDC any deaths occurring on board and certain signs and symptoms of sick travelers. This requirement will mirror the current reporting requirement for flights arriving into the United States from a foreign country. CDC will then coordinate a response with state and local public health authorities. This update will streamline reporting and response to sick travelers on flights between states by providing a single point of contact.
The regulations continue to allow flight crews to report sick travelers to the local health authority in addition to CDC. Airlines may choose to report to CDC or to CDC and the local or state health department. Most chose to report to only to CDC for convenience. The update to the regulations allows airlines to report to CDC, instead of the local health authority. CDC will then notify the state or local health authority, as needed, satisfying any federal requirement to report to the local health authority. The updated requirements also more closely match guidance and standards issued to airlines by the International Civil Aviation Organization (ICAO).
How will airline and ship crews know what to report to CDC?
CDC provides training and guidance to our airline, cruise line, and shipping partners to make sure they are aware of how and what to report, and of any situations such as outbreaks that might require special precautions.
This guidance can be found on the CDC Quarantine and Isolation Web page(https://www.cdc.gov/quarantine/index.html).
Additional Information
When are these changes effective?
These changes are effective on February 21st, 2017.
Can I make comments on the final rule?
No. The comment period for this rulemaking ended on October 14, 2016. In light of the number of comments submitted, HHS/CDC has determined that a 60-day comment period was both fair and sufficient to adequately inform the public of the contents of this rulemaking, allow the public to carefully consider the rulemaking, and receive informed public feedback.
Where can I view comments made to the Notice of Proposed Rulemaking?
Comments may be viewed at www.regulations.gov, docket number CDC-2016-0086.
Where can I find more information about this final rule?
The final rule is published on the Office of the Federal Register’s website.
CDC–Control of Communicable Diseases: Interstate and Foreign
Wednesday, January 25th, 2017The Department of Health and Human Services (HHS) Centers for Disease Control and Prevention (CDC) published the final rule for the Control of Communicable Diseases on January 19th, 2017 which includes amendments to the current domestic (interstate) and foreign quarantine regulations for the control of communicable diseases. These amendments have been made in response to public comments received regarding the notice of proposed rulemaking published on August 15, 2016. This final rule improves CDC’s ability to protect against the introduction, transmission, and spread of communicable diseases while ensuring due process. This rule will become effective on February 21st, 2017. The final rule is published on the Office of the Federal Register’s website.
Response to public comments
HHS/CDC published a Notice of Proposed Rulemaking (NPRM) on August 15, 2016, and received 15,800 public comments from individuals, stakeholders, and other interested parties during the 60-day comment period.
These comments covered a range of topics, including concerns regarding:
- agreements between the CDC and persons subject to federal public health orders,
- forced vaccination or medical treatment,
- CDC’s constitutional and statutory authority for carrying out quarantine and isolation,
- data collection from aircraft and vessel operators,
- people being quarantined for non-quarantinable illnesses,
- due process,
- electronic monitoring and surveillance of persons subject to federal public health orders,
- the proposed definition and requirement for airline and vessel operators to report an “ill person,”
- public health risk assessments being made by non-medically trained personnel,
- payment for hospital and other expenses for persons subject to federal public health orders, and
- the proposed definition of “indigent.”
The Final Rule:
- Outlines the provisions to reflect input received from individuals, industry, state and federal partners, public health authorities, and other interested parties.
- Does not authorize compulsory medical testing, vaccination, or medical treatment without prior informed consent.
- Requires CDC to advise individuals subject to medical examinations that such examinations will be conducted by an authorized health worker and with prior informed consent.
- Includes strong due process protections for individuals subject to public health orders, including a right to counsel for indigent individuals.
- Does not expand CDC’s authority beyond what is granted by Congress, nor does it alter the list of diseases subject to federal isolation or quarantine, which is established by an Executive Order of the President.
- Limits to 72 hours the amount of time that an individual may be apprehended pending the issuance of a federal order for isolation, quarantine, or conditional release.
- Provides the public with explicit information about how and where the CDC conducts public health risk assessments and manages travelers at US ports of entry.
For more information about the Final Rule, please visit the Office of the Federal Register’s website(https://www.cdc.gov/quarantine/final-rules-control-communicable-diseases.html).
Additional Information
- Questions and Answers – Final Rule for Control of Communicable Diseases: Interstate and Foreign(https://www.cdc.gov/quarantine/qa-final-rule-communicable-diseases.html)
- Final Rules for Control of Communicable Diseases: Domestic (Interstate) and Foreign – Scope and Definitions(https://www.cdc.gov/quarantine/final-rules-control-communicable-diseases.html)
- Specific Laws and Regulations Governing the Control of Communicable Diseases(https://www.cdc.gov/quarantine/specificlawsregulations.html)
- Legal Authorities for Isolation and Quarantine(https://www.cdc.gov/quarantine/aboutlawsregulationsquarantineisolation.html)
- 42 CFR, Part 70: Interstate Quarantine
- 42 CFR, Part 71, Foreign Quarantine
- Amendment to Executive Order 13295: Quarantinable Communicable Diseases
CDC’s power to quarantine threatens to expand
Tuesday, January 24th, 2017“….Prompt judicial review has always been important during epidemic scares. People can usually challenge a state’s order of quarantine immediately. Indeed, in several states, the government has to get a judge’s approval before quarantining someone.
Unfortunately, the new rules give the C.D.C. significant in-house oversight of the decision to quarantine, with up to three layers of internal agency review. This internal review has no explicit time limit and could easily stretch on for weeks while a healthy person languishes in quarantine……”
CDC’s Summary of Weekly FluView Report, Week 2
Saturday, January 21st, 2017Summary of Weekly FluView Report
U.S. Situation Update
Key Flu Indicators
According to the FluView report for the week ending January 14, 2017 (week 2), flu activity continues to increase in the United States. The proportion of people seeing their health care provider for influenza-like-illness (ILI) has been at or above the national baseline for five consecutive weeks so far this season and the number of states reporting widespread flu activity increased from 21 states to 29 states. Also, CDC reported two additional flu-associated pediatric deaths for the 2016-2017 season. Influenza A (H3) viruses continue to predominate. Flu activity is expected to continue over the coming weeks. CDC recommends annual flu vaccination for everyone 6 months of age and older. Anyone who has not gotten vaccinated yet this season should get vaccinated now. Below is a summary of the key flu indicators for the week ending January 14, 2017:
- Influenza-like Illness Surveillance: For the week ending January 14, the proportion of people seeing their health care provider(https://www.cdc.gov/flu/weekly/#_blank) for influenza-like illness (ILI) increased to 3.3%. This remains above the national baseline of 2.2%. All ten regions reported ILI at or above their region-specific baseline level. For the last 15 seasons, the average duration of a flu season by this measure has been 13 weeks, with a range from one week to 20 weeks.
- Influenza-like Illness State Activity Indicator Map: New York City and six states (Missouri, New Jersey, New York, Oklahoma, South Carolina, and Tennessee) experienced high ILI activity. Puerto Rico and eight states (Alabama, Alaska, Georgia, Louisiana, Pennsylvania, Utah, Virginia, and Wyoming) experienced moderate ILI activity. 14 states (Arizona, Arkansas, California, Colorado, Hawaii, Idaho, Illinois, Kansas, Kentucky, Michigan, Mississippi, Nebraska, Nevada, and South Dakota). 22 states experienced minimal ILI activity. The District of Columbia did not have sufficient data to calculate an activity level. ILI activity data indicate the amount of flu-like illness that is occurring in each state.
- Geographic Spread of Influenza Viruses: Widespread influenza activity was reported by Puerto Rico and 29 states (Alaska, California, Connecticut, Delaware, Florida, Idaho, Illinois, Kentucky, Maryland, Massachusetts, Missouri, Montana, Nebraska, Nevada, New Hampshire, New Jersey, New York, North Dakota, Ohio, Oklahoma, Oregon, Pennsylvania, Rhode Island, South Carolina, Texas, Virginia, Washington, Wisconsin, and Wyoming). Regional influenza activity was reported by Guam and 17 states (Alabama, Arizona, Arkansas, Colorado, Georgia, Hawaii, Iowa, Kansas, Louisiana, Maine, Michigan, Minnesota, Mississippi, New Mexico, North Carolina, South Dakota, and Utah). Local influenza activity was reported by the District of Columbia and four states (Indiana, Tennessee, Vermont, and West Virginia). Sporadic influenza activity was reported by the U.S. Virgin Islands. Geographic spread data show how many areas within a state or territory are seeing flu activity.
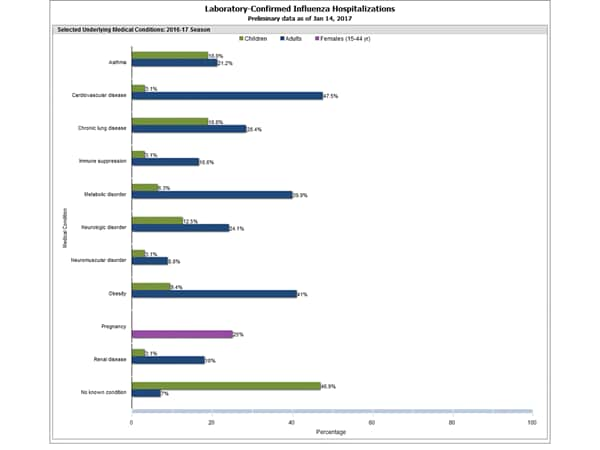
- Flu-Associated Hospitalizations: Since October 1, 2016, a total of 2,864 laboratory-confirmed influenza-associated hospitalizations(https://www.cdc.gov/flu/weekly/#_blank) have been reported. This translates to a cumulative overall rate of 10.2 hospitalizations per 100,000 people in the United States. Additional data, including hospitalization rates during other influenza seasons, can be found at http://gis.cdc.gov/GRASP/Fluview/FluHospRates.html and http://gis.cdc.gov/grasp/fluview/FluHospChars.html.
- The highest hospitalization rates are among people 65 years and older (47.3 per 100,000), followed by adults 50-64 years (10.1 per 100,000) and children younger than 5 years (6.8 per 100,000). During most seasons, children younger than 5 years and adults 65 years and older have the highest hospitalization rates.
- Hospitalization data are collected from 13 states and represent approximately 9% of the total U.S. population. The number of hospitalizations reported does not reflect the actual total number of influenza-associated hospitalizations in the United States.
- The highest hospitalization rates are among people 65 years and older (47.3 per 100,000), followed by adults 50-64 years (10.1 per 100,000) and children younger than 5 years (6.8 per 100,000). During most seasons, children younger than 5 years and adults 65 years and older have the highest hospitalization rates.
- Mortality Surveillance:
- The proportion of deaths(https://www.cdc.gov/flu/weekly/#_blank) attributed to pneumonia and influenza (P&I) was 7.0% for the week ending December 31, 2016 (week 52). This percentage is below the epidemic threshold of 7.3% for week 52 in the National Center for Health Statistics (NCHS) Mortality Surveillance System.
- Pediatric Deaths:
- Two influenza-associated pediatric deaths were reported to CDC during the week ending January 14, 2017.
- One death was associated with an influenza A virus for which no subtyping was performed and occurred during week 49 (the week ending December 10, 2016.
- One death was associated with an influenza virus for which the type was not determined and occurred during week 1 (the week ending January 7, 2017).
- A total of 5 influenza-associated pediatric deaths have been reported during the 2016-2017 season.
- Laboratory Data:
- Nationally, the percentage of respiratory specimens(https://www.cdc.gov/flu/weekly/index.htm#_blank) testing positive for influenza viruses in clinical laboratories during the week ending January 14 was 15.3%.
- Regionally, the three week average percent of specimens testing positive for influenza in clinical laboratories ranged from 9.2% to 28.0%.
- During the week ending January 14, of the 4,258 (15.3%) influenza-positive tests reported to CDC by clinical laboratories, 3,916 (92.0%) were influenza A viruses and 342 (8.0%) were influenza B viruses.
- The most frequently identified influenza virus type reported by public health laboratories during the week ending January 14 was influenza A viruses, with influenza A (H3) viruses predominating.
- During the week ending January 14, 824 (94.2%) of the 875 influenza-positive tests reported to CDC by public health laboratories were influenza A viruses and 51 (5.8%) were influenza B viruses. Of the 777 influenza A viruses that were subtyped, 761 (97.9%) were H3 viruses and 16 (2.1%) were (H1N1)pdm09 viruses.
- Since October 1, 2016, antigenic and/or genetic characterization shows that the majority of the tested viruses remain similar to the recommended components of the 2016-2017 Northern Hemisphere vaccines.
- Since October 1, 2016, CDC tested 545 specimens (59 influenza A (H1N1)pdm09, 385 influenza A (H3N2), and 101 influenza B viruses) for resistance to the neuraminidase inhibitors antiviral drugs. None of the tested viruses were found to be resistant to oseltamivir, zanamivir, or peramivir.
2016-2017 Influenza Season Week 2 ending January 14, 2017
Saturday, January 21st, 2017During week 2 (January 8-14, 2017), influenza activity increased in the United States.
- Viral Surveillance: The most frequently identified influenza virus subtype reported by public health laboratories during week 2 was influenza A (H3). The percentage of respiratory specimens testing positive for influenza in clinical laboratories increased.
- Pneumonia and Influenza Mortality: The proportion of deaths attributed to pneumonia and influenza (P&I) was below the system-specific epidemic threshold in the National Center for Health Statistics (NCHS) Mortality Surveillance System.
- Influenza-associated Pediatric Deaths: Two influenza-associated pediatric deaths were reported.
- Influenza-associated Hospitalizations: A cumulative rate for the season of 10.2 laboratory-confirmed influenza-associated hospitalizations per 100,000 population was reported.
- Outpatient Illness Surveillance: The proportion of outpatient visits for influenza-like illness (ILI) was 3.3%, which is above the national baseline of 2.2%. All 10 regions reported ILI at or above their region-specific baseline levels. New York City and six states experienced high ILI activity; Puerto Rico and eight states experienced moderate ILI activity; 14 states experienced low ILI activity; 22 states experienced minimal ILI activity, and the District of Columbia had insufficient data.
- Geographic Spread of Influenza: The geographic spread of influenza in Puerto Rico and 29 states was reported as widespread; Guam and 17 states reported regional activity; the District of Columbia and four states reported local activity; and the U.S. Virgin Islands reported sporadic activity.
Neuraminidase Inhibitor Resistance Testing Results on Samples Collected Since October 1, 2016
|
Oseltamivir |
Zanamivir |
Peramivir |
||||
|---|---|---|---|---|---|---|
|
Virus Samples tested (n) |
Resistant Viruses, Number (%) |
Virus Samples tested (n) |
Resistant Viruses, Number (%) |
Virus Samples tested (n) |
Resistant Viruses, Number (%) |
|
| Influenza A (H1N1)pdm09 |
59 |
0 (0.0) |
59 |
0 (0.0) |
59 |
0 (0.0) |
| Influenza A (H3N2) |
385 |
0 (0.0) |
385 |
0 (0.0) |
319 |
0 (0.0) |
| Influenza B |
101 |
0 (0.0) |
101 |
0 (0.0) |
101 |
0 (0.0) |
The majority of recently circulating influenza viruses are susceptible to the neuraminidase inhibitor antiviral medications, oseltamivir, zanamivir, and peramivir; however, rare sporadic instances of oseltamivir-resistant and peramivir-resistant influenza A (H1N1)pdm09 viruses and oseltamivir-resistant influenza A (H3N2) viruses have been detected worldwide. Antiviral treatment as early as possible is recommended for patients with confirmed or suspected influenza who have severe, complicated, or progressive illness; who require hospitalization; or who are at high risk for serious influenza-related complications. Additional information on recommendations for treatment and chemoprophylaxis of influenza virus infection with antiviral agents is available at http://www.cdc.gov/flu/antivirals/index.htm.
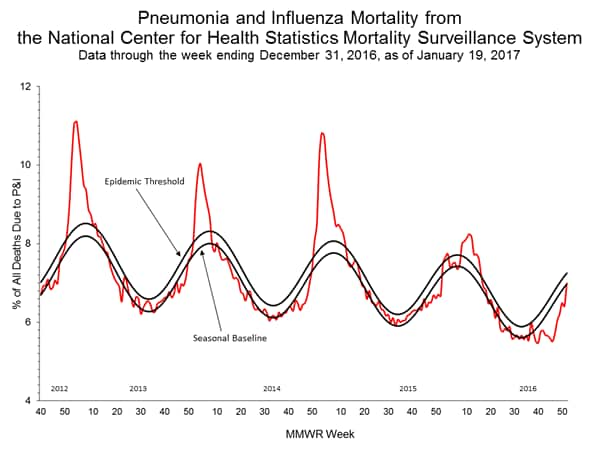
Question to out-going CDC chief: “What scares you the most? What keeps you awake at night?”
Tuesday, January 17th, 2017His answer:
Frieden: The biggest concern is always for an influenza pandemic. Even in a moderate flu year, [influenza] kills tens of thousands of Americans and sends hundreds of thousands to the hospital. That increase in mortality last year may have been driven in significant part by a worse flu season compared to a mild flu season the prior year. So flu, even in an average year, really causes a huge problem. And a pandemic really is the worst-case scenario. If you have something that spreads to a third of the population and can kill a significant proportion of those it affects, you have the makings of a major disaster.
CDC: The impact of annual influenza vaccination and the burden of influenza in the United States for the 2015-2016 influenza season
Monday, December 12th, 2016Estimated Influenza Illnesses, Medical Visits, Hospitalizations, and Deaths Averted by Vaccination in the United States
Introduction:
This web page provides estimates on the impact of annual influenza vaccination and the burden of influenza in the United States for the 2015-2016 influenza season, and will be updated annually.
For the past several years, CDC has used a model to estimate the numbers of influenza illnesses, medical visits, and hospitalizations, and the impact of influenza vaccination on these numbers in the United States (1-5). The methods used to calculate the estimates have been described previously (1,2) and are outlined briefly below. CDC uses the estimates of the burden of influenza in the population and the impact of influenza vaccination in influenza-related communications. Annual estimates on the number of influenza-related illnesses, medical visits, and hospitalizations, will be used to derive a five-year range to characterize the influenza burden in the United States. This range will be updated every five years.
Additionally, this web page provides estimates of influenza deaths and deaths averted by influenza vaccination. CDC calculates estimated influenza deaths in two ways: 1) using reports of pneumonia & influenza (P&I) deaths and 2) using reports of respiratory & circulatory (R&C) deaths attributable to influenza. P&I deaths are now available in real-time, while data on R&C deaths are available after a three-year delay. While both estimates are useful, P&I deaths represent only a fraction of the total number of deaths from influenza because they do not capture the deaths that occurred among people not tested for influenza or deaths that result from respiratory and cardiovascular complications. Calculations based on R&C deaths are used in CDC influenza-related communications materials because these calculations provide a more complete estimate of the actual burden of influenza. CDC will continue to present the mortality burden of influenza as a range, rather than a median or average, to better reflect the variability of influenza and will update estimates of R&C deaths as the data become available.
2015-2016 Estimates:
For the 2015-2016 influenza season, CDC estimates that influenza vaccination prevented approximately 5.1 million influenza illnesses, 2.5 million influenza-associated medical visits, and 71,000 influenza-associated hospitalizations (see Table 1). These estimates of averted disease burden are comparable to some previous seasons (see Table 2). During the 2015-2016 influenza season, CDC estimates that influenza vaccination prevented 3,000 P&I deaths (see Table 1). This estimate is similar to estimates of averted P&I deaths during previous seasons (see Table 2). Past comparative data suggest that for the 2015-2016 season the total number of influenza-associated R&C deaths prevented by vaccination may be between two and four times greater than estimates using only P&I deaths (see Table 2).
To calculate these estimates, CDC used 2015-2016 estimates of influenza vaccination coverage(https://www.cdc.gov/flu/fluvaxview/index.htm) (32.2% to 69.7%, depending on age group), vaccine effectiveness(https://www.cdc.gov/flu/professionals/vaccination/effectiveness-studies.htm#table) (24% to 57%, depending on age group), and influenza hospitalizations rates (20.3 per 100,000 to 321.1 per 100,000, depending on age group and adjusted for influenza testing and test sensitivity).
2015-2016 Discussion:
During the 2015-2016 season, influenza A (H3N2) viruses circulated early in the season but influenza A (H1N1)pdm09 viruses predominated overall (6). The season was notable because influenza activity peaked in mid-March, 2016; one of the later peaks on record. In the United States influenza activity most commonly peaks between December and February. The overall burden of influenza was substantial with an estimated 25 million influenza illnesses, 11 million influenza-associated medical visits, 310,000 influenza-related hospitalizations, and 12,000 P&I deaths (see Table 3). (Note that past comparative data suggest that the total number of influenza-associated R&C deaths may be between two and four times greater than estimates using only P&I deaths). Overall, the burden estimates for last season are lower than the estimated burden for the three previous seasons, but are near the middle of the range for the previous five seasons (see Table 4).
While influenza seasons can vary in severity, during most seasons people 65 years and older experience the greatest burden of severe influenza disease. This was also true for the 2015-2016 season. While people in this age group accounted for only 15% of the U.S. population, they made up 50% of influenza-associated hospitalizations and 64% of P&I deaths during the 2015-2016 season. Influenza vaccination is the best way to prevent influenza virus infection, and among adults 65 years and older CDC estimates that vaccination prevented 23% of influenza-related hospitalizations during the 2015-2016 season. Vaccine coverage dropped by about 3 percentage points in this age group (to about 63%) between the 2014-2015 and 2015-2016 influenza seasons (7). Such drops in influenza vaccination coverage are costly for older adults, who are at high risk of serious influenza-related complications. If, instead of declining, vaccine coverage had increased by just 5 percentage point in this age group, an additional 36,000 illnesses and more than 3,000 additional hospitalizations could have been prevented during the 2015-2016 season.
The fraction of averted illness from vaccination was lowest among the broader range of working-age adults, aged 18 to 64 years, owing to low vaccination coverage in general in this age group, a drop in vaccine coverage among people 50 to 64 years old, and lower vaccine effectiveness among people 50 to 64 years during the 2015-2016 season (see Table 5). With more than 16 million illnesses from influenza estimated last season and vaccine coverage estimated at 36%, increasing vaccination coverage among persons 18 to 64 years old could have a large impact on reducing illness and work absenteeism. Specifically, if vaccination coverage had increased by 5 percentage points among adults aged 18 to 64 years during the 2015-2016 season, 300,000 additional influenza illnesses and 2,000 additional hospitalizations could have been prevented.
If vaccination rates increased by just 5 percentage points across the entire population, another 500,000 influenza illnesses, 230,000 influenza-associated medical visits, and 6,000 influenza-associated hospitalizations could be prevented. If vaccination rates improved to the Healthy People goal of 70 percent for all age groups, another 2.4 million influenza illnesses and 19,000 influenza-associated hospitalizations could have been prevented. Similarly, improvements to vaccine effectiveness could provide incremental public health benefit.
Strategies to improve vaccine coverage in all ages include ensuring influenza vaccination status is assessed at each heath care encounter during the influenza season (October through May), ensuring that everyone 6 months and older receive a recommendation to get vaccinated and an offer of vaccination from their provider, using standing orders in the health care office, using patient reminder/recall systems aided by immunization information systems, and expanding vaccination access through use of nontraditional settings for vaccination (e.g., pharmacies, workplaces, and schools) to reach persons who might not visit a physician’s office during the influenza season.
Conclusion:
Influenza vaccination during the 2015-2016 influenza season prevented an estimated 5.1 million illnesses, 2.5 million medical visits, 71,000 hospitalizations, and 3,000 P&I deaths. (Note that past comparative data suggest that the total number of influenza-associated R&C deaths prevented by vaccination may be between two and four times greater than estimates using only P&I deaths). Efforts to increase vaccination coverage will further reduce the burden of influenza, especially among working-age adults younger than 65 years, who continue to have the lowest influenza vaccination coverage. This report underscores the benefits of the current vaccination program, but also highlights areas where improvements in vaccine uptake and vaccine effectiveness could deliver even greater benefits to the public’s health.
Although the timing and intensity of influenza virus circulation for the 2016-2017 season cannot be predicted, peak weeks of influenza activity have occurred between December and February during about 75% of seasons over the past 30 years, and significant circulation of influenza viruses can occur as late as May. Therefore, vaccination should be offered to anyone aged ≥6 months by the end of October if possible and for as long as influenza viruses continue to circulate.
Limitations:
These estimates are subject to several limitations. First, influenza vaccination coverage estimates were derived from reports by survey respondents, not vaccination records, and are subject to recall bias. Second, these coverage estimates are based on telephone surveys with relatively low response rates; nonresponse bias may remain after weighting. Estimates of the number of persons vaccinated based on these survey data have often exceeded the actual number of doses distributed, indicating that coverage estimates used in this report may overestimate the numbers of illnesses and hospitalizations averted by vaccination. Third, this model only calculates outcomes directly averted among persons who were vaccinated. If there is indirect protection from decreased exposure to infectious persons in a partially vaccinated population (i.e., herd immunity), the model would underestimate the number of illnesses and hospitalizations prevented by vaccination. Fourth, vaccine effectiveness among adults 65 years and older might continue to decrease with age, reaching very low levels among the oldest adults who also have the highest rates of influenza vaccination; thus, the model might have overestimated the effect in this group. Fifth, due to data availability, we are unable to estimate influenza-associated R&C deaths for the 2014-2015 or 2015-2016 seasons. P&I deaths are a fraction of all deaths associated with influenza. Based on past studies, (8,9) the total number of R&C deaths associated with influenza that occurred during the 2015-2016 season may be two to four times higher than reported P&I deaths. As data on R&C deaths become available CDC will update estimates of influenza-associated deaths (see CDC Study: Flu Vaccine Saved 40,000 Lives During 9 Year Period(https://www.cdc.gov/flu/news/flu-vaccine-saved-lives.htm)).
Previous Estimates:
Previous estimates of the burden of illness, medical visits, and hospitalizations related to influenza are available online and in scientific publications(https://www.cdc.gov/flu/about/disease/burden.htm#flu-related-illness). (1-5) Estimates using the same methodology as for the 2015-2016 season are shown in the tables below to provide context for the current season’s estimates.
The estimates of P&I deaths related to influenza are a fraction of all deaths related to influenza that occurred a given season. Data on the number of R&C deaths are available with a three-year lag and, therefore, are available for the 2010-2011 through 2013-2014 influenza season. Using these data, CDC estimates that influenza-associated R&C deaths have ranged from a low of 12,000 (during 2011-2012) to a high of 56,000 (during 2012-2013).
2015-2016 Tables for Influenza Burden and Burden-Averted Estimates:
Table 1: Estimated number and fraction of influenza illnesses, medical visits, hospitalizations, and pneumonia and influenza deaths averted by vaccination, by age group — United States, 2015-2016 influenza season
| Age (yrs) | Averted illnesses |
Averted medical visits |
Averted hospitalizations |
Averted pneumonia & influenza deaths* |
|||||||
|---|---|---|---|---|---|---|---|---|---|---|---|
| No. | 95% CI | No. | 95% CI | No. | 95% CI | Fraction prevented (%) |
95% CI | No. | 95% CI | ||
| 6 months-4 | 980,052 | 710,239-1,322,705 | 656,635 | 474,202-889,804 | 6,832 | 4,951-9,221 | 32.0 | 27.6-36.9 | 105 | 66-156 | |
| 5-17 | 1,281,134 | 940,148-1,733,726 | 666,190 | 485,103-908,476 | 3,513 | 2,578-4,754 | 24.2 | 21.0-27.8 | 62 | 42-78 | |
| 18-49 | 1,591,114 | 1,264,333-1,999,398 | 588,712 | 465,711-747,321 | 8,931 | 7,097-11,223 | 14.1 | 12.3-15.7 | 236 | 190-285 | |
| 50-64 | 743,725 | 360,432-1,209,238 | 319,802 | 153,599-527,189 | 7,887 | 3,822-12,824 | 9.5 | 4.92-14.3 | 261 | 123-423 | |
| ≥65 | 487,473 | 262,848-816,276 | 272,985 | 147,356-460,045 | 44,316 | 23,895-74,207 | 22.5 | 13.5-31.4 | 2,217 | 1,167-3,620 | |
| All ages | 5,083,498 | 3,538,000-7,081,344 | 2,504,323 | 1,725,971-3,532,835 | 71,479 | 42,344-112,228 | 18.9 | 14.3-24.2 | 2,882 | 1,588-4,562 | |
*Only data on pneumonia & influenza deaths are available in real-time during an influenza season; however, these are only a subset of the total deaths associated with influenza, which may be 2 to 4 times higher when other complications are also considered.
Table 2: Estimated number and fraction of influenza illnesses, medical visits, hospitalizations, and pneumonia and influenza deaths averted by vaccination, by season— United States, 2010-11 through 2015-16 influenza seasons
| Season | Averted illnesses |
Averted medical visits |
Averted hospitalizations |
Averted deaths | ||||||||
|---|---|---|---|---|---|---|---|---|---|---|---|---|
| Pneumonia & influenza deaths* |
Respiratory & circulatory deaths† |
|||||||||||
| No. | 95% CI | No. | 95% CI | No. | 95% CI | Fraction prevented (%) |
95% CI | No. | 95% CI | No. | 95% CI | |
| 2010-2011 | 5,039,277 | 3,435,322-7,716,921 | 2,514,353 | 1,702,599-3,885,779 | 70,821 | 33,965-141,708 | 20.8 | 13.1-30.3 | 3,434 | 1,422-6,906 | 9,880 | 3,883- 19,362 |
| 2011-2012 | 1,981,571 | 1,160,279-3,666,130 | 968,312 | 555,687-1,809,753 | 39,301 | 17,610-88,885 | 22.7 | 13.0-34.0 | 1,227 | 505-2,450 | 3,618 | 1,400- 6,909 |
| 2012-2013 | 5,628,332 | 4,235,767-8,327,082 | 2,701,875 | 1,997,056-4,085,452 | 61,522 | 31,580-162,836 | 11.1 | 6.25-19.6 | 1,823 | 724-5,517 | 5,280 | 2,149- 15,029 |
| 2013-2014 | 6,683,929 | 5,037,991-8,898,309 | 3,080,284 | 2,252,594-4,190,948 | 86,730 | 56,447-129,736 | 21.5 | 17.2-26.1 | 3,840 | 2,298-5,844 | 9,172 | 5,267- 14,465 |
| 2014-2015 | 1,606,813 | 609,744-3,456,741 | 792,958 | 296,449-1,744,001 | 47,449 | 10,795-144,291 | 7.5 | 2.09-15.9 | 1,419 | 312-4,255 | – | – |
| 2015-2016 | 5,083,498 | 3,538,000-7,081,344 | 2,504,323 | 1,725,971-3,532,835 | 71,479 | 42,344-112,228 | 18.9 | 14.3-24.2 | 2,882 | 1,588-4,562 | – | – |
*Only data on pneumonia & influenza deaths are available in real-time during an influenza season; however, these are only a subset of the total deaths associated with influenza that occur each year, which may be 2 to 4 times higher when other complications are also considered.
†Data on respiratory & circulatory deaths are available with a three-year lag; therefore, estimates on averted respiratory & circulatory deaths are only available through 2013-2014 influenza season at this time.
Table 3: Estimated influenza disease burden, by age group — United States, 2015-2016 influenza season
| Age (yrs) | Total population |
Estimated illnesses |
Estimated medical visits |
Estimated hospitalizations |
Estimated excess pneumonia & influenza deaths* |
|||||
|---|---|---|---|---|---|---|---|---|---|---|
| No. | 95% CI | No. | 95% CI | Hosp. rate (per 100,000) |
No. | 95% CI | No. | 95% Cr I† | ||
| <5 | 19,907,281 | 2,207,454 | 1,914,725-2,597,610 | 1,478,994 | 1,271,529-1,757,051 | 77.3 | 15,389 | 13,349-18,109 | 218 | 163-341 |
| 5-17 | 53,737,830 | 3,985,210 | 3,362,617-4,780,978 | 2,072,309 | 1,746,545-2,513,438 | 20.3 | 10,927 | 9,220-13,109 | 193 | 147-832 |
| 18-49 | 136,800,721 | 9,717,671 | 8,434,252-11,413,475 | 3,595,538 | 3,069,688-4,288,400 | 39.9 | 54,545 | 47,342-64,064 | 1,432 | 1,264-1,659 |
| 50-64 | 63,212,136 | 6,979,986 | 6,316,499-7,811,225 | 3,001,394 | 2,664,703-3,437,918 | 117.1 | 74,021 | 66,985-82,836 | 2,439 | 2,105-2,893 |
| ≥65 | 47,760,852 | 1,686,841 | 1,476,732-2,023,024 | 944,631 | 814,401-1,141,033 | 321.1 | 153,349 | 134,248-183,911 | 7,639 | 6,348-9,404 |
| All ages | 321,418,820 | 24,577,163 | 21,504,826-28,626,313 | 11,092,867 | 9,566,867-13,137,840 | 95.9 | 308,232 | 271,143-362,029 | 11,995 | 10,634-13,914 |
*Only data on pneumonia & influenza deaths are available in real-time during an influenza season; however, these are only a subset of the total deaths associated with influenza that occur each year, which may be 2 to 4 times higher when other complications are also considered.
†A 95% credible interval (95% Cr I) is provided because of the Monte Carlo approach used to estimate excess pneumonia & influenza deaths.
Table 4: Estimated influenza disease burden, by season — United States, 2010-11 through 2015-16 influenza seasons
| Season | Estimated illnesses |
Estimated medical visits |
Estimated hospitalizations |
Estimated excess deaths |
|||||||
|---|---|---|---|---|---|---|---|---|---|---|---|
| Pneumonia & influenza deaths* |
Respiratory & circulatory deaths† |
||||||||||
| No. | 95% CI | No. | 95% Cr I+ | Hosp. rate (per 100,000) |
No. | 95% CI | No. | 95% Cr I§ | No. | 95% Cr I¶ | |
| 2010-2011 | 21,096,749 | 17,582,319-27,698,870 | 9,956,056 | 8,187,913-13,224,822 | 91.2 | 281,589 | 239,013-373,931 | 13,541 | 12,111-15,372 | 39,008 | 34,283-44,986 |
| 2011-2012 | 9,231,004 | 7,281,179-13,835,345 | 4,298,616 | 3,392,861-6,450,996 | 44.8 | 139,497 | 115,865-206,066 | 4,154 | 3,691-4,747 | 12,182 | 10,638-14,346 |
| 2012-2013 | 35,590,424 | 30,113,616-44,250,092 | 16,638,347 | 13,979,214-20,765,551 | 188.8 | 592,688 | 509,813-733,307 | 19,962 | 18,006-22,434 | 56,102 | 50,252-63,709 |
| 2013-2014 | 28,445,377 | 24,968,054-33,040,119 | 12,613,671 | 10,942,829-14,817,158 | 101.9 | 322,123 | 283,230-376,646 | 13,590 | 12,252-15,307 | 31,864 | 27,832-37,234 |
| 2014-2015 | 34,292,299 | 30,332,937-40,051,029 | 16,184,354 | 14,105,043-19,181,789 | 221.8 | 707,155 | 624,149-838,516 | 19,490 | 17,718-21,740 | – | – |
| Approximate 5-season range (No.) |
9,200,000-35,600,000 | 4,300,000-16,700,000 | 140,000-710,000 | 4,000-20,000 | 12,000-56,000** | ||||||
| 2015-2016 | 24,577,163 | 21,504,826-28,626,313 | 11,092,867 | 9,566,867-13,137,840 | 95.9 | 308,232 | 271,143-362,029 | 11,995 | 10,634-13,914 | – | – |
*Only data on pneumonia & influenza deaths are available in real-time during an influenza season; however, they are only a subset of the total deaths associated with influenza that occur each year, which may be 2 to 4 times higher when deaths due to other complications are also considered.
†Data on respiratory & circulatory deaths are available with a three-year lag; therefore, estimates on averted respiratory & circulatory deaths are available for the 2010-2011 through 2013-2014 influenza seasons but not for the 2014-2015 or 2015-2016 seasons.
§A 95% credible interval (95% Cr I) is provided because of the Monte Carlo approach used to estimate excess pneumonia & influenza deaths.
¶Range is based on 4 seasons with available data on respiratory & circulatory deaths.
Table 5: Influenza vaccine coverage and vaccine effectiveness, by age group — United States, 2015-2016 influenza season
| Age | Vaccine coverage * | Vaccine effectiveness † | ||
|---|---|---|---|---|
| % | 95% CI | % | 95% CI | |
| 6 months-4 years | 70 | 68-71 | 57 | 33-72 |
| 5-17 years | 56 | 55-57 | 51 | 33-64 |
| 18-49 years | 32 | 31-33 | 49 | 35-60 |
| 50-64 years | 43 | 43-44 | 24 | -1-43 |
| ≥65 years | 63 | 62-64 | 41 | 4-64 |
*Estimates from FluVaxView. (7)
†Estimates from US Flu VE Network. (9)
Questions & Answers:
How does CDC estimate the number of hospitalizations, illnesses, and medically-attended illnesses associated with influenza that occurred in the United States?
Laboratory-confirmed influenza-associated hospitalization rates by age group were obtained from FluSurv-NET, a collaboration between CDC, the Emerging Infections Program Network, and selected state and local health departments in 13 geographically distributed areas in the United States that conduct population-based surveillance. Reported hospitalization rates were adjusted using a multiplier to correct for underreporting, which is calculated from the percent of persons hospitalized with respiratory illness who were tested for influenza and the average sensitivity of influenza testing in surveillance hospitals. These values were measured from data collected during four post-pandemic seasons; data from two seasons were previously reported (2).
Adjusted rates were applied to the U.S. population by age group to calculate the numbers of influenza-associated hospitalizations. The numbers of influenza illnesses were then estimated from hospitalizations based on previously measured ratios that reflect the estimated number of ill persons per hospitalization in each age group (5).
The numbers of persons seeking medical care for influenza were then calculated using age group-specific data on the percentages of persons with a respiratory illness who sought medical care, which were estimated from results of the 2010 Behavioral Risk Factor Surveillance Survey (10).
How does CDC estimate the number of influenza-associated deaths that occurred during the influenza season?
The annual number of excess deaths related to influenza during the season is estimated using a statistical model of weekly deaths that accounts for seasonal trends and indicators for influenza activity and circulation of respiratory syncytial virus (RSV) obtained from viral surveillance activities (11,12). The methods have been previously described elsewhere in detail (13).
Data on deaths were obtained from the US National Center for Health Statistics (NCHS) (11). Data on deaths with pneumonia or influenza listed as a cause of death are available in real-time so can be included in the estimation of burden for the 2015-2016 influenza season; however, previous studies have shown these deaths account for a fraction of all deaths that are related to influenza. Most influenza-related deaths are not due directly to influenza virus infection but are due to secondary bacterial infection or worsening of underlying chronic health conditions, such as chronic heart or lung disease. Even when influenza likely contributed to the events leading to a death, it is often not recognized and rarely listed on the death certificate. Deaths with any respiratory or circulatory (R&C) causes listed on the death certificate are likely more inclusive of deaths related to influenza than P&I deaths; however, data on R&C deaths are not available for up to three years so we are able to calculate annual estimates only for the 2010-2011 through 2013-2014 influenza seasons.
In 2010, CDC estimated the number of influenza-associated P&I deaths and number of influenza-associated deaths with any respiratory or circulatory (R&C) causes listed on the death certificate from 1976-1977 through 2006-2007 influenza seasons (8). From the historical analysis of R&C deaths, we estimate that the total number of influenza-associated deaths that occurred during the influenza season could be two to four times higher than the number of P&I deaths. The current estimate of influenza-associated P&I deaths that occurred during the 2015-2016 season is within the range of P&I mortality estimates from the historical data but roughly half the estimates of influenza-associated R&C deaths.
How does CDC estimate the number of influenza-associated outcomes that were prevented with influenza vaccination?
The annual estimates of influenza vaccination coverage by month during each season and the final end-of-season vaccine effectiveness measurements were used to estimate how many persons were not protected by vaccination during the season and thus were at risk for these outcomes.
The rate of each outcome among persons at risk was then used to estimate the number of influenza-associated outcomes that would have been expected in the same population if no one had been protected by vaccination. Finally, the averted outcomes attributable to vaccination were calculated as the difference between outcomes in the hypothetical unvaccinated population and the observed vaccinated population.
Estimates of 2015-2016 influenza vaccination coverage by month from July 2015 through April 2016, were based on self-report or parental report of vaccination status using data from the National Immunization Survey for children aged 6 months-17 years and Behavioral Risk Factor Surveillance Survey data for adults aged ≥18 years (7).
Vaccine effectiveness estimates for the 2015-2016 season were derived from the US Influenza Vaccine Effectiveness Network, a group of five academic institutions that conduct annual vaccine effectiveness studies (9). The network estimates the effectiveness of vaccination for preventing real-time reverse transcription polymerase chain reaction-positive influenza among persons with acute respiratory illness of ≤7 days duration seen in hospitals, emergency departments, or outpatient clinics in communities in four states.
Calculations were stratified by month of the year to account for annual variations in the timing of disease and vaccination and then summed across the whole season. The prevented fraction was calculated as the number of averted illnesses divided by the total illnesses that would have been expected in an unvaccinated population.
Can you explain the change in the range used to describe influenza-related deaths?
The previous range used to describe influenza-related deaths, from 3,000 to 49,000, was based on data from 30 influenza seasons from 1976 through 2007 (8). The range described in the tables above, 12,000 to 56,000, is based on data from the 2010-2011 through 2013-2014 influenza seasons. Over the past six influenza seasons, the U.S. has experienced several seasons with high rates of hospitalization and severe disease, which may explain why the range over just four seasons has higher numbers of influenza-related deaths than the previously published range.
In addition, other factors may also contribute to why some seasons have different numbers of influenza deaths than seen in the past, including changes in the way that death certificates are filed, changes in the age structure of the population, or changes in the prevalence of chronic medical conditions that put people at high-risk of influenza complications.
How does CDC track flu-related deaths in the United States?
See “Estimating Seasonal Influenza-Associated Deaths in the United States” for the answer to this question.
Why are estimated pediatric deaths in this report different from the number of pediatric deaths reported through the Influenza-Associated Pediatric Mortality Surveillance System?
Deaths associated with laboratory-confirmed influenza in children aged <18 years became nationally notifiable in 2004 and are reported to CDC through the Influenza-Associated Pediatric Mortality Surveillance System. The number of reported deaths is published each week in FluView(https://www.cdc.gov/flu/weekly/index.htm). However, the number of reported deaths is likely an underestimate of the total number of flu-related pediatric deaths because not all children may be tested for flu or children may be tested later in their illness when seasonal influenza can no longer be detected from respiratory samples.
CDC estimates the numbers of flu-related deaths using statistical models to account for likely under-reporting. The estimates of pneumonia and influenza (P&I) deaths associated with flu in this report are from one such model. Previously published reports have found that the estimated numbers of flu-related deaths in children from statistical models may be two to three times higher than the number of reported deaths. (14)
Can you explain the change in the estimate of influenza-related hospitalizations?
Influenza hospitalizations have always varied from season to season. In the past, CDC had referred to an average number of hospitalizations that was estimated based on records during 1979-2001 from about 500 hospitals across the United States. The average number of people hospitalized was “more than 200,000” but individual seasons over that time period ranged from a low of 157,911 for 1990-1991 to a high of 430,960 for 1997-1998. The new range of 140,000 to 710,000 is based on data from more recent seasons. CDC believes the recent five-year range in this report better represents the variability of influenza seasons than an average estimate.
Can you explain why some of the estimates on this website are different from previously published estimates using this methodology? (For example, total flu-related hospitalization during 2014-2015 was previously estimated to be 974,000, but the current estimate is 707,000 people)?
CDC estimates the burden of influenza using influenza-related hospitalizations and a set of multipliers for the ratio of hospitalizations to cases and the proportion of people who seek clinical care for acute respiratory illness (2). The surveillance system used to estimate influenza-related hospitalizations, FluSurv-NET, collects data on patients hospitalized who have laboratory-confirmed influenza. Influenza testing is done at the request of the clinician, but not everyone is tested. Also, influenza tests are not perfectly accurate. Thus, the reports of laboratory-confirmed influenza-related hospitalizations to FluSurv-NET are likely underestimates of the true number. To adjust for this, we collect data annually from participating FluSurv-NET sites on the amount of influenza testing and the type of test that is used at the site, and this information is used to correct for the underestimate. These testing data are often not available for up to a year after the influenza season, and thus the most recent season’s estimates may need to be revised when more recent data become available, as was the case for the 2014-2015 season.
References:
- Kostova D, Reed C, Finelli L, Cheng PY, Gargiullo PM, Shay DK, et al. Influenza Illness and Hospitalizations Averted by Influenza Vaccination in the United States, 2005-2011. PLoS One. 2013;8(6):e66312.
- Reed C, Chaves SS, Daily Kirley P, Emerson R, Aragon D, Hancock EB, et al. Estimating influenza disease burden from population-based surveillance data in the United States. PLoS One. 2015;10(3):e0118369.
- Centers for Disease Control and Prevention. Estimated influenza illnesses and hospitalizations averted by influenza vaccination – United States, 2012-13 influenza season. MMWR Morb Mortal Wkly Rep. 2013 Dec 13;62(49):997-1000.
- Reed C, Kim IK, Singleton JA, Chaves SS, Flannery B, Finelli L, et al. Estimated influenza illnesses and hospitalizations averted by vaccination-United States, 2013-14 influenza season. MMWR Morb Mortal Wkly Rep. 2014 Dec 12;63(49):1151-4.
- Centers for Disease Control and Prevention. Estimated Influenza Illnesses and Hospitalizations Averted by Vaccination — United States, 2014–15 Influenza Season. 2015 December 10, 2015 [cited 2016 October 27]; Available from: http://www.cdc.gov/flu/about/disease/2014-15.htm
- Davlin SL, Blanton L, Kniss K, Mustaquim D, Smith S, Kramer N, et al. Influenza Activity – United States, 2015-16 Season and Composition of the 2016-17 Influenza Vaccine. MMWR Morb Mortal Wkly Rep. 2016 Jun 10;65(22):567-75.
- Centers for Disease Control and Prevention. Flu Vaccination Coverage, United States, 2015–16 Influenza Season. 2016 September 29, 2016 [cited 2016 October 27]; Available from: http://www.cdc.gov/flu/fluvaxview/coverage-1516estimates.htm
- Centers for Disease Control and Prevention. Estimates of deaths associated with seasonal influenza — United States, 1976-2007. MMWR Morb Mortal Wkly Rep. 2010 Aug 27;59(33):1057-62.
- Flannery B, Chung J. Influenza Vaccine Effectiveness, Including LAIV vs IIV in Children and Adolescents, US Flu VE Network, 2015–16. Advisory Committee on Immunization Practices; 2016 June 22; Atlanta, GA; 2016.
- Biggerstaff M, Jhung M, Kamimoto L, Balluz L, Finelli L. Self-reported influenza-like illness and receipt of influenza antiviral drugs during the 2009 pandemic, United States, 2009-2010[332 Kb, 26 pages](https://www.cdc.gov/vaccines/acip/meetings/downloads/slides-2016-06/influenza-05-flannery.pdf). Am J Public Health. 2012 Oct;102(10):e21-6.
- Centers for Disease Control and Prevention. Overview of Influenza Surveillance in the United States. 2016 October 13, 2016 [cited 2016 November 1]; Available from: http://www.cdc.gov/flu/weekly/overview.htm
- Centers for Disease Control and Prevention. The National Respiratory and Enteric Virus Surveillance System (NREVSS). 2016 October 26, 2016 [cited 2016 November 1]; Available from: https://www.cdc.gov/surveillance/nrevss/index.html
- Foppa IM, Cheng PY, Reynolds SB, Shay DK, Carias C, Bresee JS, et al. Deaths averted by influenza vaccination in the U.S. during the seasons 2005/06 through 2013/14. Vaccine. 2015 Jun 12;33(26):3003-9.
- Wong KK, Cheng P, Foppa I, Jain S, Fry AM, Finelli L. Estimated paediatric mortality associated with influenza virus infections, United States, 2003-2010. Epidemiol Infect. 2014 May 15:1-8
Authors
Melissa A. Rolfes, PhD, MPH1; Ivo M. Foppa, ScD1,2; Shikha Garg, MD1; Brendan Flannery, PhD1; Lynnette Brammer, MPH1; James A. Singleton, PhD3; Erin Burns, MA1; Daniel Jernigan, MD1; Carrie Reed, DSc1; Sonja J. Olsen, PhD1; Joseph Bresee, MD1
1 Influenza Division, National Center for Immunization and Respiratory Diseases, Centers for Disease Control and Prevention, Atlanta, GA
2 Battelle Memorial Institute, Atlanta, GA, USA
3 Immunization Services Division, National Center for Immunization and Respiratory Diseases, Centers for Disease Control and Prevention, Atlanta, GA
Acute flaccid myelitis (AFM) in the USA: As of 9/30/16, 89 AFM cases have been confirmed in 33 states, mostly in children.
Thursday, November 3rd, 2016
At a Glance
- CDC is concerned about AFM, a serious illness that we do not know the cause of or how to prevent it.
- CDC is investigating the increase in AFM in 2016. As of September 2016, 89 people in 33 states were confirmed to have AFM.
- Even with an increase in cases in 2016, AFM remains a very rare disease (less than one in a million).
- While the AFM case count for 2016 is less than the 2014 case count, CDC is concerned about the increase in cases in recent months.
- CDC is intensifying efforts(http://www.cdc.gov/acute-flaccid-myelitis/afm-surveillance.html#cdc) to understand the cause and risk factors of AFM.
- It’s always important to practice disease prevention steps, like washing your hands, staying up-to-date on vaccines, and protecting yourself from mosquito bites.
Acute flaccid myelitis (AFM) is a rare illness that anyone can get. It affects a person’s nervous system, specifically the spinal cord. AFM can result from a variety of causes, including viral infections.
Beginning in August 2014, CDC received an increase in reports of people across the United States with AFM for which no cause could be found. Since then, CDC has been actively investigating this illness. We continue to receive reports of sporadic cases of AFM. From January 1 to September 30, 2016, a total of 89 people in 33 states across the country were confirmed to have AFM.
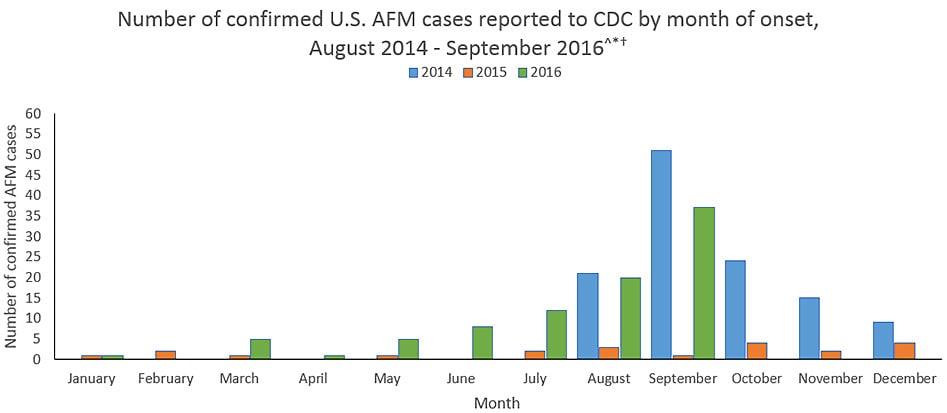
Updated November 1, 2016
^ Cases reported as of October 31, 2016 with onset of illness through September 30, 2016. The case counts are subject to change. CDC updates the case counts monthly with a one month lag to allow the time needed for case review.
* The data shown from August 2014 to July 2015 are based on the AFM investigation case definition: onset of acute limb weakness on or after August 1, 2014, and a magnetic resonance image (MRI) showing a spinal cord lesion largely restricted to gray matter in a patient age ≤21 years.
† The data shown from August 2015 to present are based on a revised AFM case definition adopted by CSTE: acute onset of focal limb weakness and an MRI showing spinal cord lesion largely restricted to gray matter and spanning one or more spinal segments, regardless of age.
For more information on AFM case definitions, visit the Case Definitions(http://www.cdc.gov/acute-flaccid-myelitis/hcp/case-definition.html) page.
What This Graph Shows
- From January 1 to September 30, 2016, 89 people were confirmed to have AFM. (Note: The cases occurred in 33 states across the U.S.)
- In 2015, 21 people were confirmed to have AFM. (Note: The cases occurred in 16 states across the U.S.)
- From August to December 2014, 120 people were confirmed to have AFM. (Note: The cases occurred in 34 states across the U.S.)
- The case counts represent only those cases reported to and confirmed by CDC.
- There has been an increase in reports of confirmed AFM cases in 2016 compared with 2015 (21 cases in 16 states).
The graph shows reports of cases confirmed by CDC as of October 31, 2016 with onset of illness through September 30, 2016.
It is currently difficult to interpret trends of the AFM data since reporting only started in 2014 and is voluntary in most states. Also, since AFM reporting is relatively new, there may initially be more variability in the data from year to year making it difficult to interpret or compare case counts between years. One possible reason for the differences in annual reporting is more awareness among and reporting by healthcare providers and health departments.
To protect patient confidentiality, CDC is not specifying the states with confirmed AFM cases. We defer to the states to release information as they choose.
Number of confirmed AFM cases by year of illness onset, 2014-2016
| Year | Number confirmed cases | Number of states reporting confirmed cases |
|---|---|---|
| 2014 (Aug-Dec) | 120 | 34 |
| 2015 | 21 | 16 |
| 2016* (Jan-Sept) | 89 | 33 |
*The case counts are subject to change.
What We Know
What we know about the AFM cases reported since August 2014:
- Most patients are children.
- The patients’ symptoms have been most similar to those caused by certain viruses, including poliovirus, non-polio enteroviruses, adenoviruses, and West Nile virus. See a list of viruses associated with AFM(http://www.cdc.gov/acute-flaccid-myelitis/about-afm.html#germs).
- Enteroviruses can cause neurologic illness, including meningitis. However, more severe disease, such as encephalitis and AFM, is not common. Rather, they most commonly cause mild illness.
- CDC has tested many different specimens from the patients for a wide range of pathogens (germs) that can cause AFM. To date, we have not consistently detected a pathogen (germ) in the patients’ spinal fluid; a pathogen detected in the spinal fluid would be good evidence to indicate the cause of AFM since this illness affects the spinal cord.
- The increase in AFM cases in 2014 coincided with a national outbreak of severe respiratory illness among people caused by enterovirus D68 (EV-D68). Among the people with AFM, CDC did not consistently detect EV-D68 in the specimens collected from them. In 2015 there were no cases of EV-D68 detected and so far in 2016, only limited sporadic cases of EV-D68(http://www.cdc.gov/non-polio-enterovirus/about/ev-d68.html) have been detected in the United States.
What We Don’t Know
What we don’t know about the AFM cases reported since August 2014:
- Despite extensive testing, CDC does not yet know the cause of the AFM cases.
- It is unclear what pathogen (germ) or immune response is causing the disruption of signals sent from the nervous system to the muscles causing weakness in the arms and legs.
- CDC has not yet determined who is at higher risk for developing AFM, or the reasons why they may be at higher risk.
See Prevention(http://www.cdc.gov/acute-flaccid-myelitis/about-afm.html#prevention) for information about how to protect your family from viral infections that may cause AFM.
What CDC Is Doing
CDC is actively investigating the AFM cases and monitoring disease activity. We are working closely with healthcare providers and state and local health departments to increase awareness and reporting for AFM, and investigate the AFM cases, risk factors, and possible causes of this illness.
CDC activities include:
- encouraging healthcare providers to be vigilant for AFM among their patients, and to report suspected cases to their health departments
- verifying reports of suspected AFM cases submitted by health departments using a case definition adopted by the Council of State and Territorial Epidemiologists (CSTE)
- testing specimens, including stool, blood, respiratory and cerebrospinal fluid, from people confirmed to have AFM
- working with clinicians and state and local health departments to investigate and better understand the AFM cases, including potential causes and how often the illness occurs
- providing new and updated information to clinicians, health departments, policymakers, the public, and partners in various formats, such as the Morbidity and Mortality Weekly Report, the AFM website, and CDC social media
- pursuing an approach that uses multiple research methods to further explore the potential association of AFM with possible causes as well as risk factors for AFM. This includes collaborating with several medical institutions to review MRI scans of people from the past 10 years to determine how many AFM cases occurred before 2014.
For more information, see COCA Clinical Reminder (August 27, 2015) – Notice to Clinicians: Continued Vigilance Urged for Cases of Acute Flaccid Myelitis.
The 2014 investigation summary is available here: Acute Flaccid Myelitis in the United States—August – December 2014: Results of Nation-Wide Surveillance.
For more information on AFM surveillance, see the CSTE Standardized Case Definition for Acute Flaccid Myelitis.
Hurricane Matthew – CDC’s International Response
Friday, October 21st, 2016
Background
Category 4 Hurricane Matthew struck the south-west coast of Haiti at 0700 local time (1200 GMT) on 4 October. Wind speeds of 230km/h were recorded, causing widespread damage, flooding and displacement. The most affected departments are Grand Anse, South, Nippes and South East, where heavy floods were recorded. West and North West departments were also affected. The government of Haiti has issued a Red Alert and the Haiti National Emergency Operation Center has been activated. Estimates are that over 2 million people could be affected.
What is CDC doing?

Status of health facilities in Haiti
Source: ReliefWeb
CDC’s Emergency Response and Recovery Branch is leading efforts to support countries impacted by Hurricane Matthew. This includes coordinating with the US Office of Foreign Disaster Assistance(OFDA), the CDC Haiti Country Office, and other governmental and humanitarian partners to support response efforts. CDC’s country office in Haiti and teams of public health responders from Atlanta are focusing their efforts on assessing the public health impact of the storm and working with our Haitian partners to repair damaged public health systems. CDC health experts are in Haiti to assess the impact of the storm on health needs and infrastructure.
Current health priorities for the CDC Haiti country office are to ensure that those affected continue to receive health care; to collect data on cholera and other diseases that are prone to outbreaks, and to evaluate the interruption of safe water and sanitation supplies.
Hurricane Matthew and Haiti: Putting CDC Expertise to Work


