Archive for the ‘Climate Change’ Category
J-IDEA, the Abdul Latif Jameel Institute for Disease and Emergency Analytics will rapidly respond to emergencies such as epidemics, extreme climate events, and natural and humanitarian disasters.
Tuesday, October 22nd, 2019“…..J-IDEA will tackle crises, such as Ebola and MERS, alongside longer-term global priorities, including the impact of climate change on health, using cutting-edge data science and public health research to deliver policy insights.
The new institute brings together the world’s foremost epidemiologists, biostatisticians, medics and data scientists as they break down barriers between academic expertise and on-the-ground impact. ….”
“……J-IDEA brings together over 200 researchers working on global health within Imperial College’s School of Public Health. Partnering with governments and international institutions, J-IDEA advances methods and real-world application of data analytics to identify and support effective actions and high priority investments into population health globally – both in responding to crises but also in identifying the cross-cutting investments which will build strong and resilient health systems better able to meet future health challenges and threats…..”
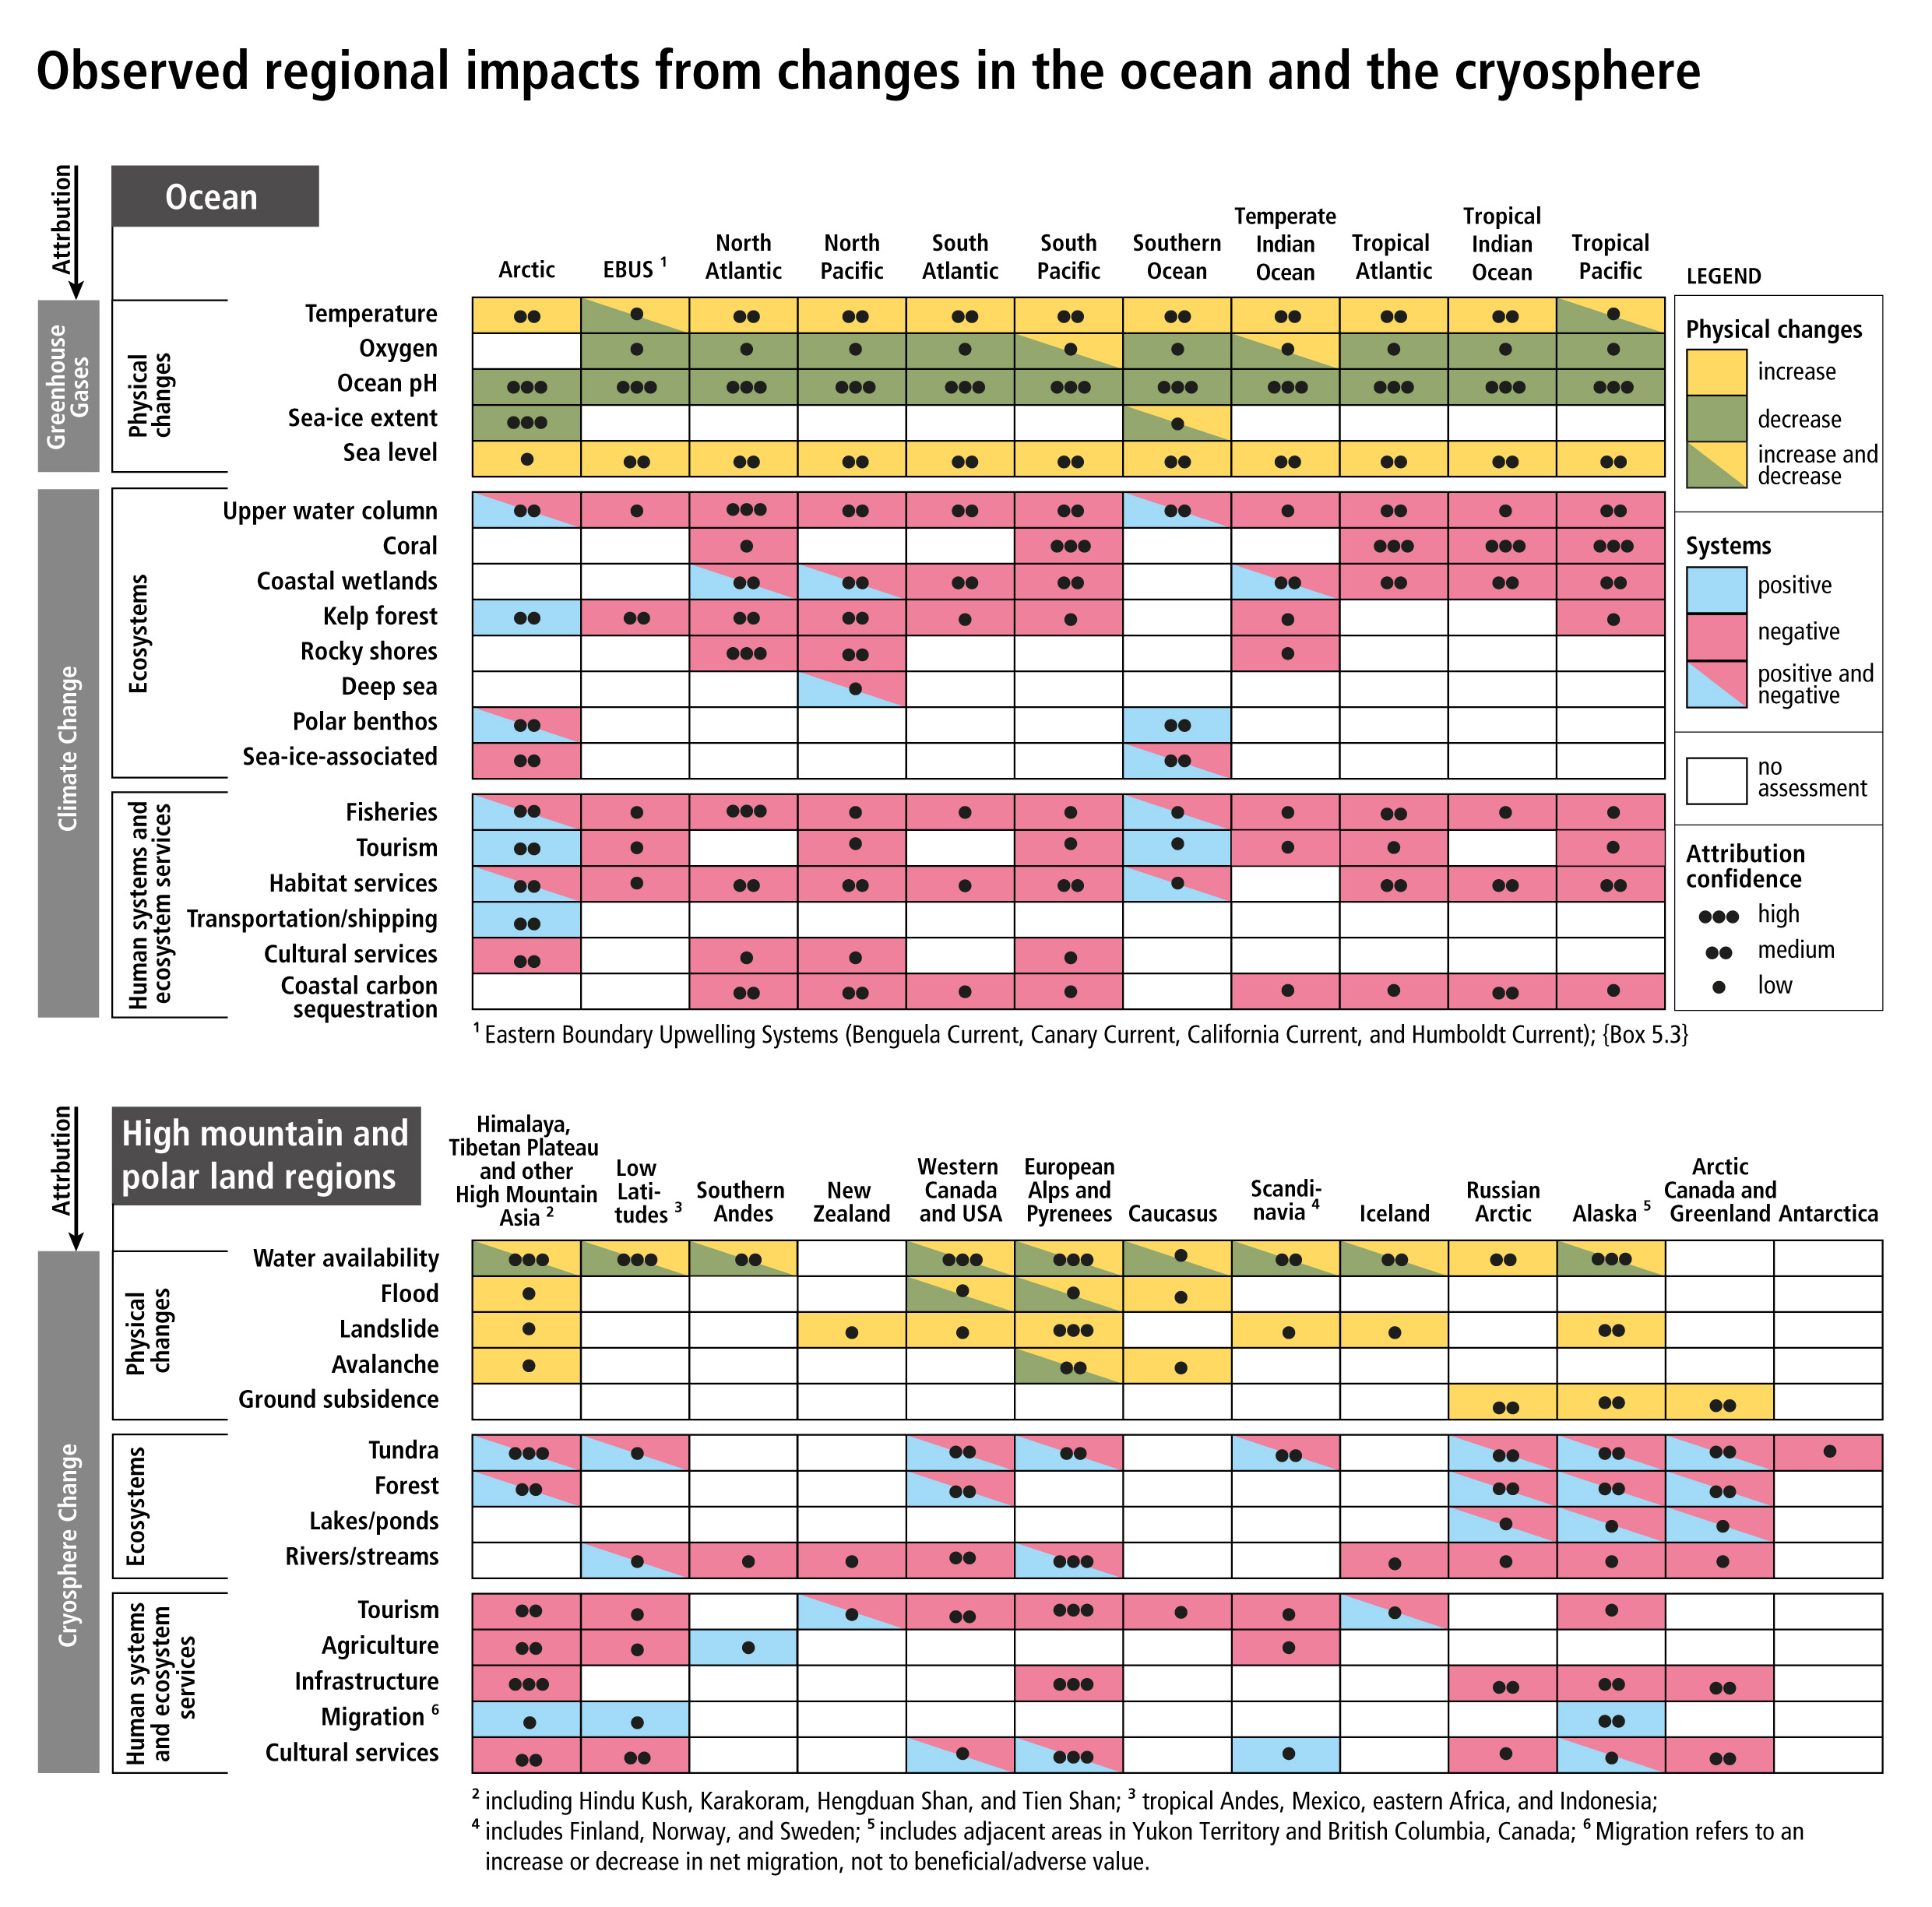
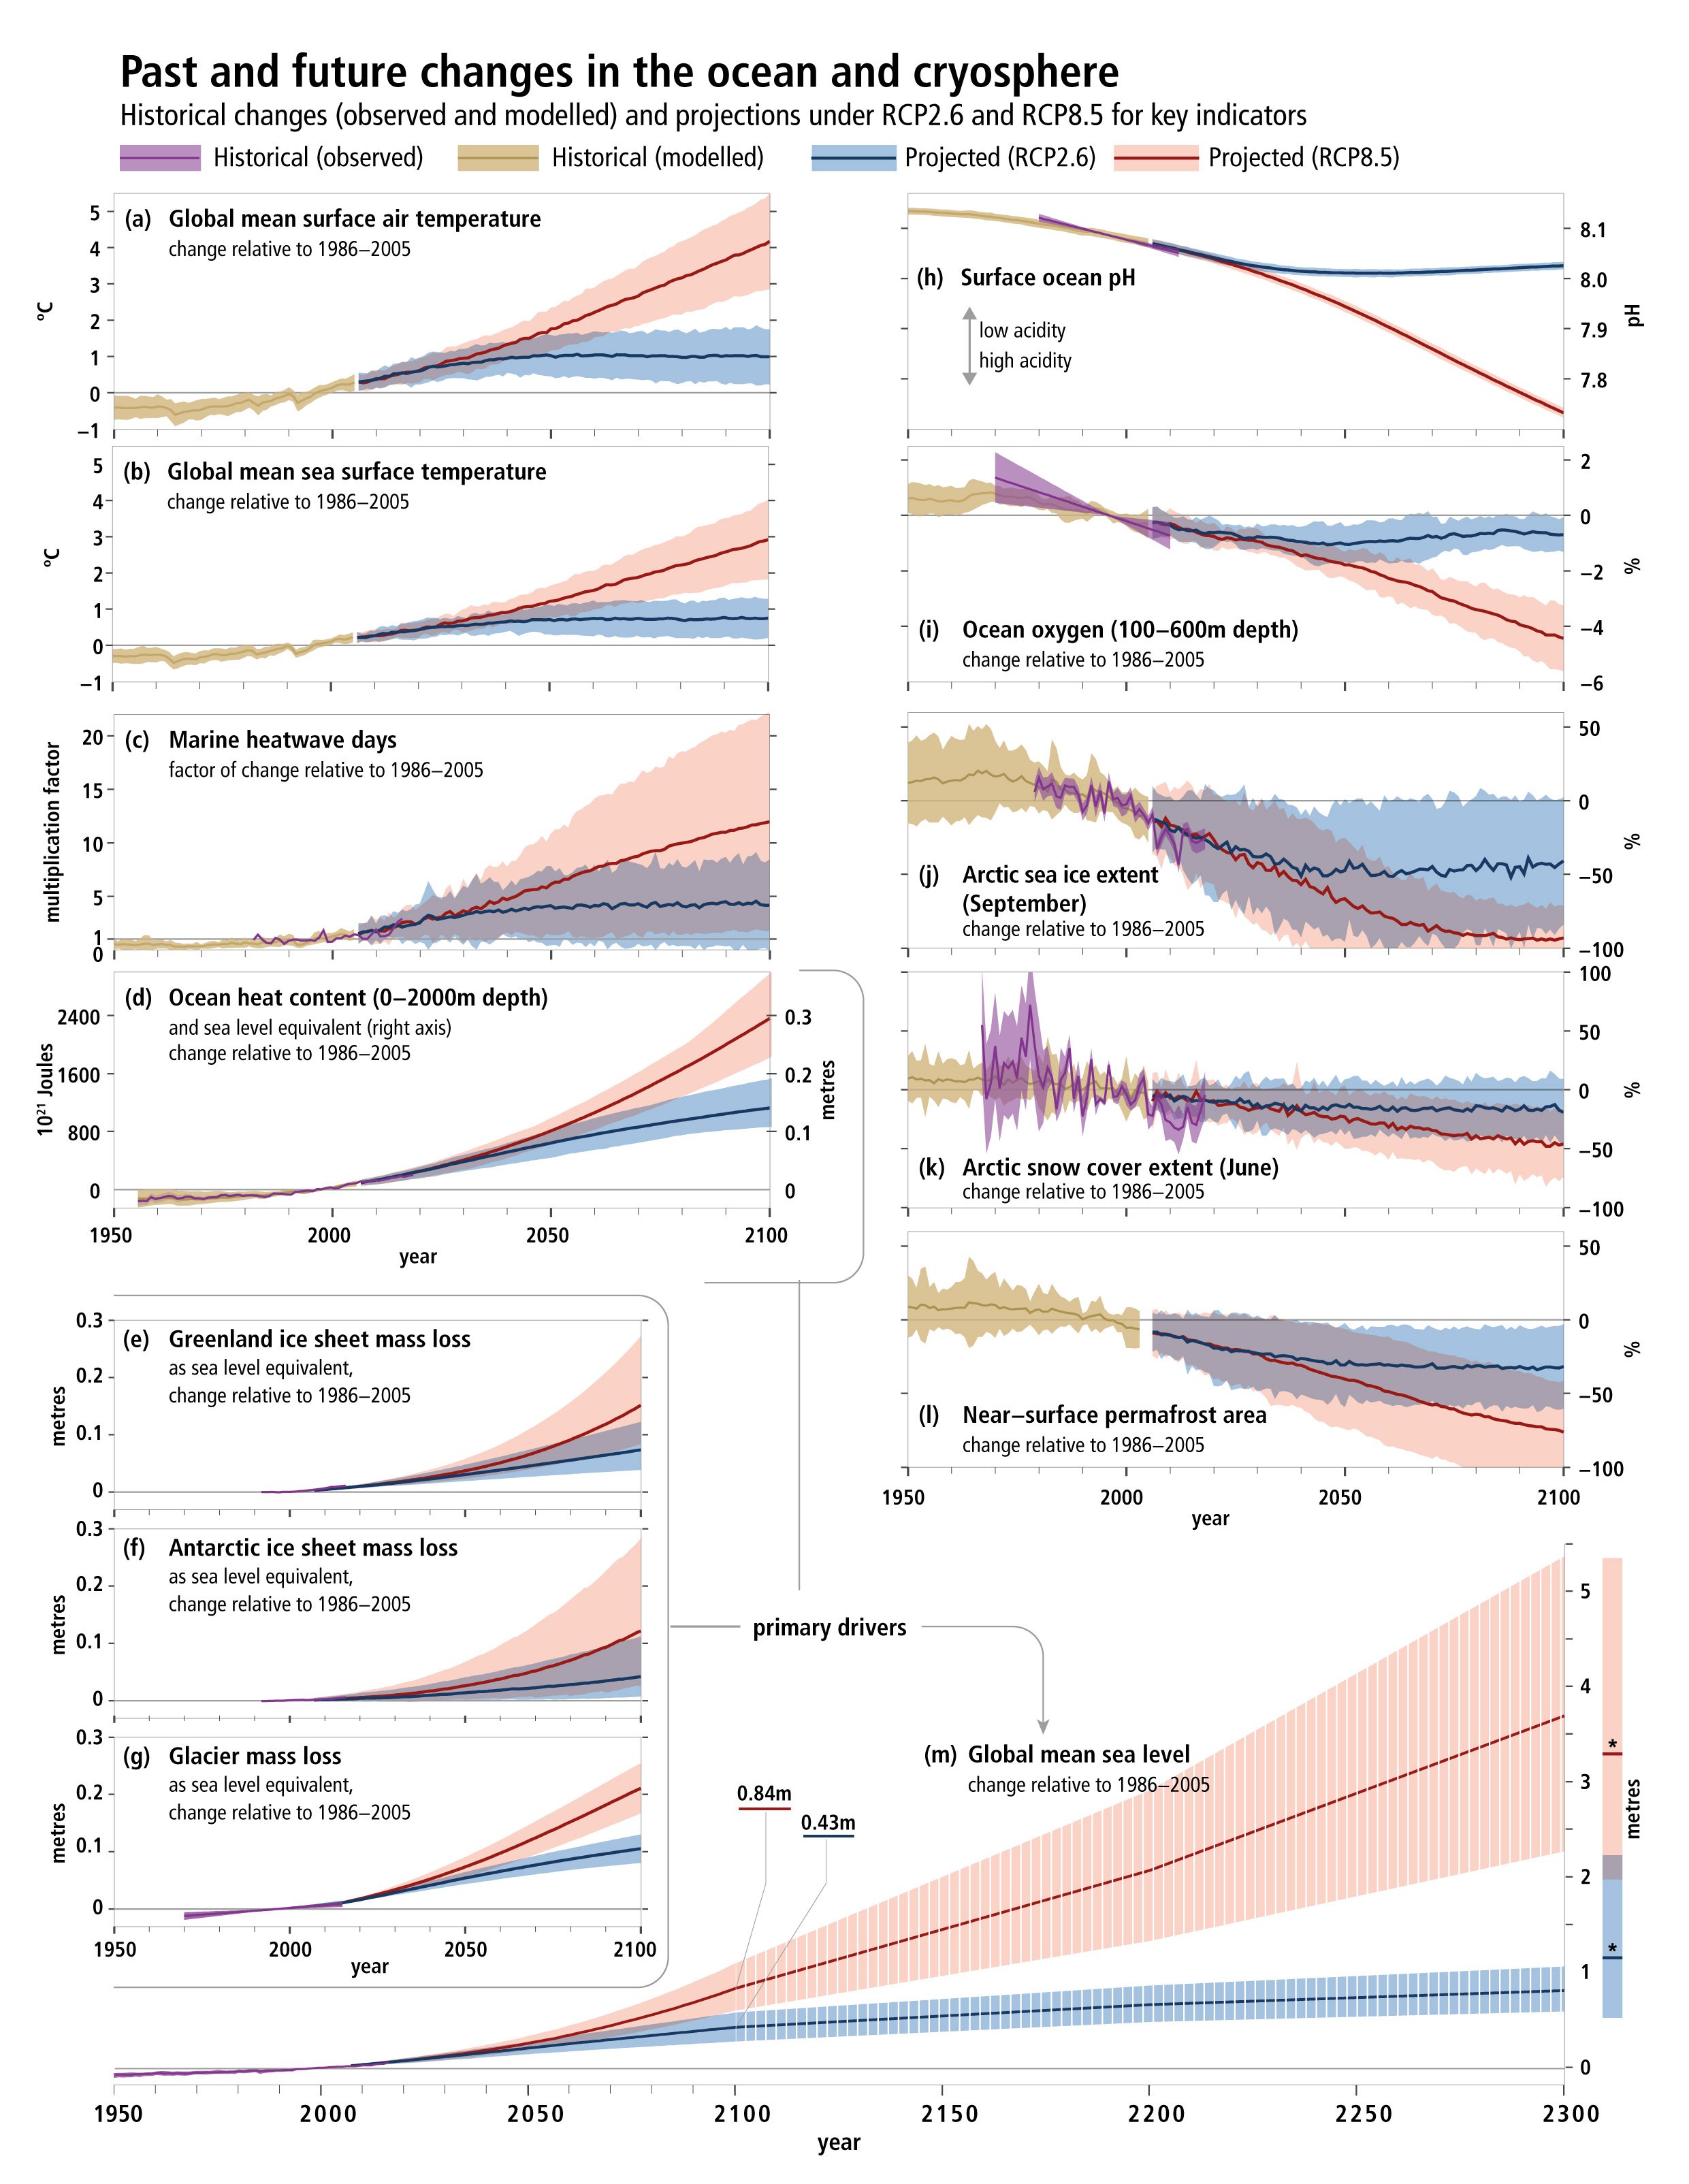
Special Report on the Ocean and Cryosphere in a Changing Climate
Wednesday, September 25th, 2019NYT: “……Earth’s oceans are under severe strain from climate change, a major new United Nations report warns, threatening everything from the ability to harvest seafood to the well-being of hundreds of millions of people living along the coasts.
Rising temperatures are contributing to a drop in fish populations in many regions, and oxygen levels in the ocean are declining while acidity levels are on the rise, posing risks to important marine ecosystems, according to the report issued Wednesday by the Intergovernmental Panel on Climate Change, a group of scientists convened by the United Nations to guide world leaders in policymaking.
In addition, warmer ocean waters, when combined with rising sea levels, threaten to fuel ever more powerful tropical cyclones and floods, the report said, further imperiling coastal regions and worsening a phenomenon that is already contributing to storms like Hurricane Harvey, which devastated Houston two years ago……”
California has experienced a fivefold increase in annual burned area since 1972. Climate change?
Tuesday, September 10th, 2019
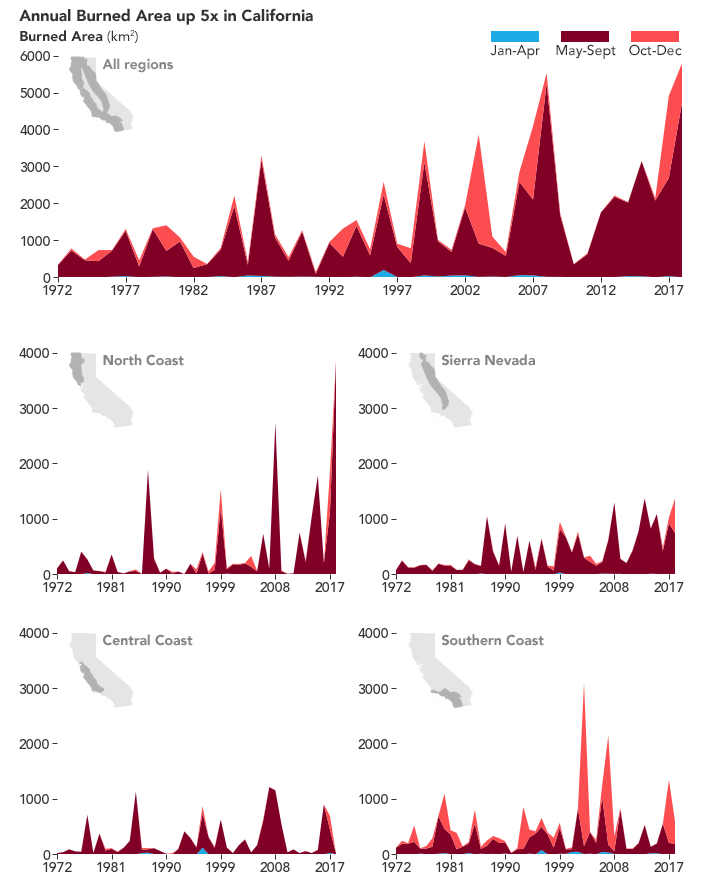
If it seems like California has been getting hit by more and larger fires lately, that’s because it has. In 2017, California endured the Thomas Fire, the state’s largest fire (by area) at that time. One year later, the Mendocino Fire Complex took its place. In 2018, California also suffered its most destructive fire ever and set a new record for burned area in one year.
A study published in July 2019 shows these remarkable fire years are no longer freakish anomalies. They fit with a trend of more frequent and bigger fires. According to the researchers, the annual burned area across California has increased fivefold over the past five decades, and the main driver is higher temperatures.
“Warming is affecting forest fire,” said Park Williams, lead author and a researcher from Columbia University. “But in California, the story is bound to be really complicated because there are a lot of different climate types, vegetation types, and different ways humans are interacting with the landscape.”
Williams and colleagues separated California into four different regions and examined fire activity during different seasons. The graphs above show the seasonal and annual burned area in California for 1972-2018. Overall, the annual burned area increased by 405 percent during that period.
The burned area data came from CalFire Fire Resource and Assessment Program and the Monitoring Trends in Burn Severity dataset, which includes Landsat observations. Using climate models, the team then correlated the burned area with data on monthly precipitation, temperatures, humidity, wind speed, and solar radiation. (Much of this data was derived from NOAA and NASA observations).
The scientists found that the greatest increases in burned area occurred during the summertime (May-September), and particularly in the forests of the North Coast and Sierra Nevada regions. Overall, burned area from summertime forest fires increased by eightfold over the past five decades. “Essentially all of the increase we’ve seen in annual wildfire area in California over the last 50 years is driven by warming in the atmosphere during summertime,” said Williams.
Specifically, the team found the strongest relationship between summer forest fires and the aridity of the atmosphere—a combination of heat and the absence of water vapor. That is not to say other non-climate factors are not important, said Williams. In fact, human activities have probably strengthened the effect of warming in some areas. “By fighting fires and living in forests, humans have increased the vegetation available to burn and the sparks needed to start fires,” said Williams, “so now more than ever the table is set for big fire as soon as hot and dry conditions arrive.”
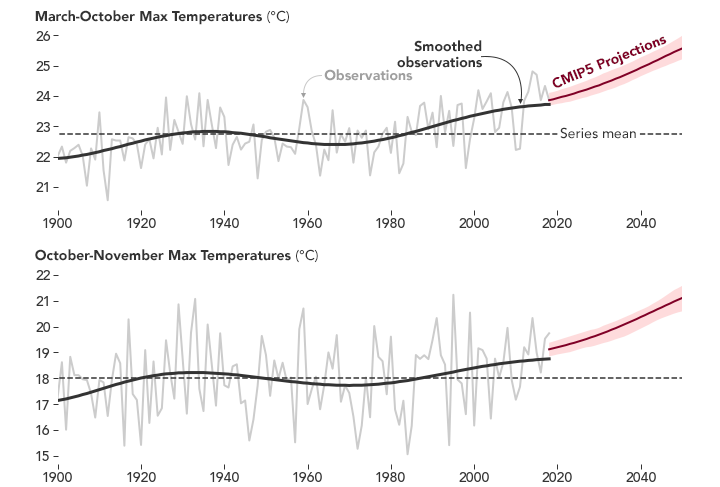
The plots above show the maximum temperatures from March to October and October to November, averaged across the four California study regions. From 1896 to 2018, the maximum temperature for March to October increased by 1.81°C, which corresponded to a 13 percent increase in vapor pressure deficit (the amount of water missing from the atmosphere). These observed trends match expected trends from climate models responding to anthropogenic (human-caused) emissions. Over the same period, the maximum temperature for October to November increased by 1.67°C, which corresponded to an increase of vapor pressure deficit of 14 percent. Both plots show the future expected temperature trends for the region based on the climate model, Coupled Model Intercomparison Project (CMIP5).
Fall wildfires also evolved. Although fewer fires occur in that season, they tend to be more dramatic now. (The Camp Fire is a prime example.) Unlike summertime forest fires, the severity of fall fire season is influenced by the timing (regular or late arrival) of winter rains and by strong Santa Ana wind events (to fan and spread flames), neither of which showed a significant increase. But if the winds are strong and rains are late, then the extra warming helps create destructive fires.
“Even though rain and the winds haven’t changed by our calculations, the fall fire risk has actually increased,” said Williams. “When you get into fall, that’s when vegetation is driest because it has not rained since spring. It is also warmer by about 1.5°C than it was century ago. That means fuels are drier today than they were a century ago.”
Outside of the forested areas of California, wildfire area has not significantly increased since 1972. Williams noted that grasslands and coastal chaparral are usually already hot, so they are not as sensitive to the extra heat from global warming. Instead, the likelihood for a large fire in such areas depends on the amount of fuel available. For instance, is there enough grass from spring and early summer growth to carry a fire across long distances? As a result, grasslands and chaparral fires tend to occur after a wet winter combined with a dry summer.
“Anytime we hear a one-size-fits-all story for what’s driving the big fires in California, we are not getting the whole story because California is so big,” said Williams. “There are different factors depending on the region and time, and there’s not going to be one solution to fix every fire problem.”
NASA Earth Observatory images by Joshua Stevens, using data from Williams, Park A., et al. (2019). Story by Kasha Patel.
Drowning or sinking islands: the story of Kiritimati
Friday, August 16th, 2019“…….Intensifying storms and weather-related events have displaced an average of 24.1 million people every year around the world since 2008, and the World Bank estimates that another 143 million people will be displaced by 2050 in just three regions: sub-Saharan Africa, South Asia and Latin America……..’


CDC: Climate Effects on Health
Monday, August 12th, 2019Climate Effects on Health
The information on health effects has been excerpted from the Third National Climate Assessment’s Health Chapterexternal icon. Additional information regarding the health effects of climate change and references to supporting literature can be found in the Health Chapter at http://www.globalchange.gov/engage/activities-products/NCA3/technical-inputsexternal icon.
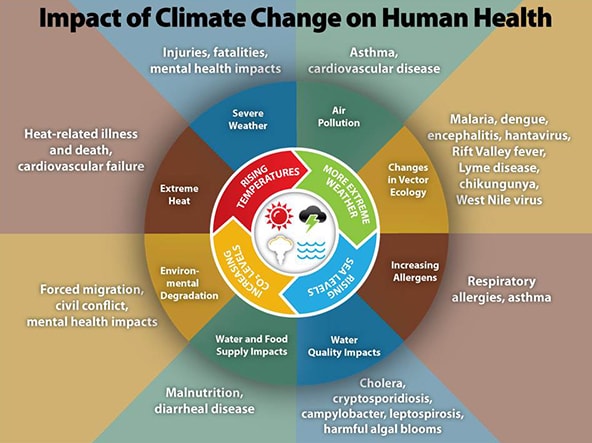
Climate change, together with other natural and human-made health stressors, influences human health and disease in numerous ways. Some existing health threats will intensify and new health threats will emerge. Not everyone is equally at risk. Important considerations include age, economic resources, and location.
In the U.S., public health can be affected by disruptions of physical, biological, and ecological systems, including disturbances originating here and elsewhere. The health effects of these disruptions include increased respiratory and cardiovascular disease, injuries and premature deaths related to extreme weather events, changes in the prevalence and geographical distribution of food- and water-borne illnesses and other infectious diseases, and threats to mental health.
CDC and APHA Fact Sheets
- Extreme Rainfall and Drought Can Impact our Health pdf icon[PDF – 98 KB]
- Warmer Water and Flooding Increase the Risk of Illness or Injury pdf icon[PDF – 184 KB]
- Climate Change Decreases the Quality of the Air We Breathe pdf icon[PDF 111 KB]
- Extreme Heat Can Impact Our Health in Many Ways pdf icon[PDF – 108 KB]
- Climate Change Increases the Risk of Vector-Borne Diseases pdf icon[PDF – 112 KB]
NASA: New Map Shows Risk of Sunburn Across the U.S.
Thursday, August 8th, 2019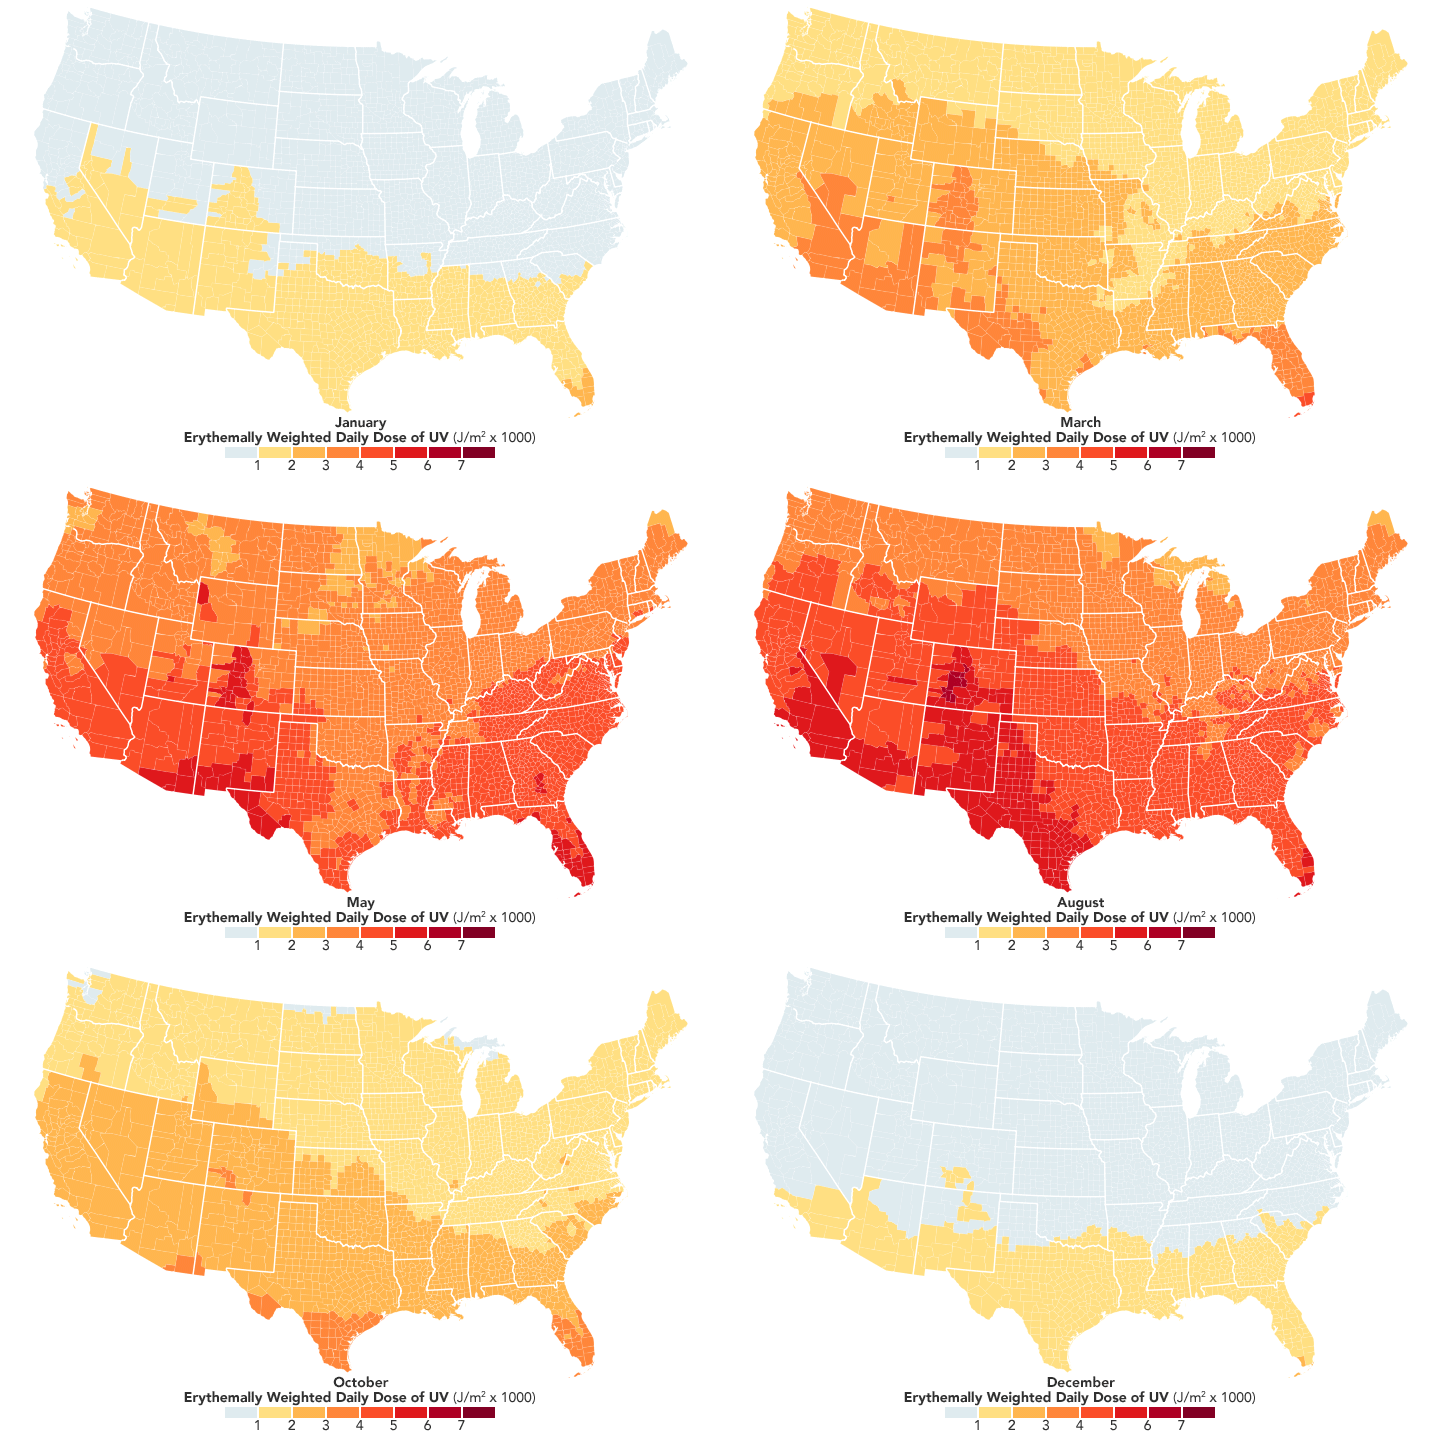
Skin cancer is the most common form of cancer in the United States, taking thousands of lives every year. By the age of 70, one in five Americans will develop skin cancer. Now NASA is helping public health officials track the primary cause of the disease: overexposure to ultraviolet radiation.
The NASA Applied Sciences Program has partnered with the Centers for Disease Control and Prevention (CDC) to create the first publicly available map of ultraviolet (UV) radiation for all counties in the contiguous United States. The dataset, which spans 2005-2015, is available on the CDC’s National Environmental Public Health Tracking network, which delivers information and data about health issues related to environmental factors. Public health officials, city planners, or individuals concerned about Sun exposure can learn how much ultraviolet radiation is falling over each county each month, which is an important step in helping reduce skin cancer risks.
“Before this, there hasn’t been a true comprehensive exposure measure of UV radiation,” said Yang Liu, an associate professor at Emory University’s Rollins School of Public Health. “People have been studying Sun exposure using very crude indicators. We’re looking at the specific UV wavelengths that can cause skin cancer.”
Although skin cancer is caused by ultraviolet radiation, different types of UV radiation can have different effects. The two that play an important role in skin cancer are UVA and UVB rays. UVA rays penetrate deeply into the skin to cause genetic damage to cells; UVA is linked to long-term skin damage such as wrinkles. UVB are the principal rays that cause sunburn and can directly damage the DNA in skin cells.
The maps on this page show the average amount of UV radiation per square meter reaching the surface in different parts of the country. Liu and his team used an equation to combine the various wavelengths of UV radiation to mimic the intensity of a sunburn—a measurement called the “erythemally weighted daily dose.” The researchers also gave more weight to more populated areas. For instance, the measurement is higher in more populated areas, which is helpful for studying the corresponding population health effects of high UV exposure.


