Archive for the ‘Climate Change’ Category
Climate change and dengue fever in Latin America
Monday, June 4th, 2018Felipe J. Colón-González el al., “Limiting global-mean temperature increase to 1.5–2 °C could reduce the incidence and spatial spread of dengue fever in Latin America,” PNAS (2018).
Read more at: https://phys.org/news/2018-05-limiting-global-millions-dengue-fever.html#jCp
“……We show that policies to limit global warming to 2 °C could reduce dengue cases by about 2.8 (0.8–7.4) million cases per year by the end of the century compared with a no-policy scenario that warms by 3.7 °C. Limiting warming further to 1.5 °C produces an additional drop in cases of about 0.5 (0.2–1.1) million per year…..”

NASA: India heat
Friday, June 1st, 2018
India has been hit by a streak of unusually intense thunderstorms, dust storms, and lightning so far in 2018. The events collapsed homes, destroyed crops, and claimed the lives of over a hundred people with even more casualties, calling for assistance by Prime Minister Narendra Modi.
In late April, the state of Andhra Pradesh in southeastern India was struck by about 40,000 lightning bolts in 13 hours—more than the number of strikes that occurred in the entire month of May 2017 — striking people and livestock.
On May 2, 2018, a cluster of strong thunderstorms, accompanied by strong winds and lightning, swept through the Rajasthan region in the north, knocking over large structures and harming those in the way. The potent thunderstorms whipped up one of the deadliest dust storms in decades.
One week later, the same region was hit by more deadly thunderstorms that brought lightning, 110 kilometer (65 mile) per hour winds, and violent dust storms.
The map above shows aerosols, including dust, over northern India on May 14, 2018, around the time of the second dust storm. The aerosol measurements were recorded by the Ozone Mapping and Profiler Suite (OMPS) on the Suomi NPP satellite. The dust is naturally blocked from moving north by the Himalayan mountain range. In addition to causing accidents and poor air quality, dust aerosols can influence the amount of heat transmitted to Earth‘s surface by either scattering or absorbing incoming sunlight.
In recent years, extreme weather events such as heat waves, thunderstorms, and floods have been increasing in India, according to Ajay Singh, a climate change researcher with the Indian Institute of Technology Bombay. “Overall, the impact of global warming on the climate of India is clearly visible in the form of increased frequency and intensity of most of the extreme weather events,” said Singh.
Even with the increasing trend, the intensity of events so far this year is anomalous, said Singh. The unusual thunder and dust storms could have a combination of causes, including extra moisture from a cyclonic circulation over West Bengal colliding with destructive dusty winds. High temperatures in the area also made the atmosphere unstable, fueling thunderstorms and heavy winds.
The unusually high number of lightning strikes was caused by cold winds from the Arabian Sea colliding with warmer winds from northern India, leading to the formation of more clouds than usual. The spike in lightning this April was abnormal, but India has long been prone to lightning strikes, which are believed to cause more fatalities than any other natural hazard in the country.
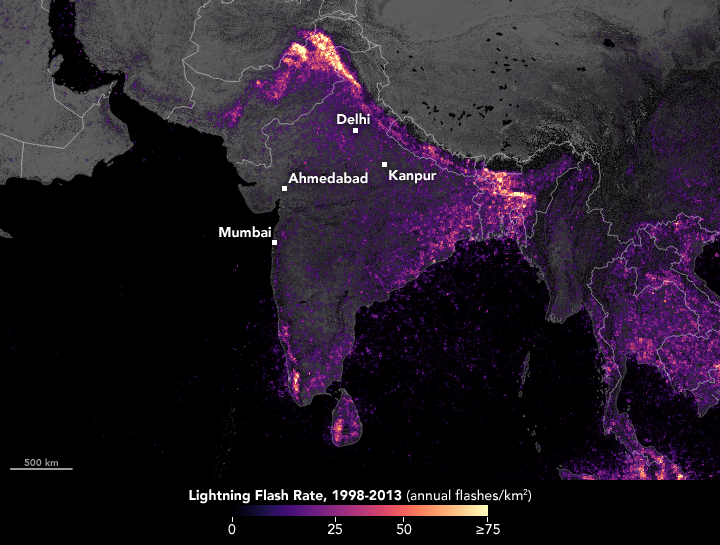
The second map shows the annual average number of lightning flashes in India from 1998–2013. The visualization was made from data acquired by the Lightning Imaging Sensor (LIS) on NASA’s Tropical Rainfall Measuring Mission satellite and compiled by the Global Hydrology Resource Center (GHRC). Southeastern India usually experiences increased lightning activity before monsoon season, as heating and weather patterns become unstable and changeable.
Researchers are interested to learn how the spring 2018 lightning burst in India fits in with longer�term trends. Some years can be highly active without signaling a trend, said Dan Cecil, a scientist at NASA Marshall. For instance, a region near Andhra Pradesh had almost double the normal lightning flash rates in 2010, yet 2011 was almost exactly normal. The following years alternated between being slightly below normal and slightly above normal, according to satellite data.
-
References and Further Reading
- BBC (2018, May 14) India dust storms: At least 61 dead in four states. Accessed May 24, 2018.
- BBC (2018, April 26) India state records 36,749 lightning strikes in 13 hours. Accessed May 24, 2018.
- National Geographic (2018, May 3) Why This Dust Storm in India Turned Deadly. Accessed May 24, 2018.
- Pacific Standard (2018, May 14) India’s New Reality: More Frequent and Severe Dust Storms. Accessed May 24, 2018.
- The Weather Channel (2018, May 4) India Rain, Dust Storm Kills at Least 120, Injures 200. Accessed May 24, 2018.
- The Weather Channel (2018, May 20) Why Lightning Kills More Indians Than Any Other Natural Disaster. Accessed May 24, 2018.
- Weather Underground (2018, May 3) Fierce Thunderstorm-Related Winds Kill More than 100 in India. Accessed May 24, 2018.
- Quartz (2018, May 14) Extreme weather in India has killed over 70 people in a day. Accessed May 24, 2018.
NASA Earth Observatory images by Joshua Stevens, using OMPS data from NASA’s NPP Ozone Science Team, and lightning climatology from GHRC Lightning & Atmospheric Electricity Research. Story by Kasha Patel.
- Instrument(s):
- Suomi NPP – OMPS
- TRMM – LIS
New study: Increasing local temperatures are associated with higher levels of antibiotic resistance in E. coli, K. pneumoniae, and Staph. aureus.
Thursday, May 24th, 2018“…..The team calculated that an increase in the average minimum temperature of 10°C (18°F) across regions was associated with an increase in antibiotic resistance of 4.2% for E coli, 2.2% for K pneumoniae, and 2.7% for S aureus. In addition, changes in minimum temperature were associated with larger increases in resistance in each year analyzed.
“The reason we included other predictors, like antibiotic use and population density, is because those are well-known in the literature to be drivers of antibiotic resistance,” McGough said. “What was really strong about this study is that, after controlling for those factors, we still find that temperature is a strong predictor of antibiotic resistance.”
The strongest associations between temperature and resistance was found in fluoroquinolones and beta-lactam antibiotics, suggesting that warmer temperatures may affect the way bacteria respond to certain drug mechanisms……”
Antibiotic resistance increases with local temperature
- doi:10.1038/s41558-018-0161-6
2017 Was the Second Hottest Year on Record
Sunday, January 21st, 2018
Earth’s global surface temperatures in 2017 ranked as the second warmest since 1880, according to an analysis by scientists at NASA’s Goddard Institute for Space Studies (GISS). Continuing the planet’s long-term warming trend, globally averaged temperatures in 2017 were 0.90 degrees Celsius (1.62 degrees Fahrenheit) warmer than the 1951 to 1980 mean. That is second only to global temperatures in 2016.
In a separate, independent analysis, scientists at the National Oceanic and Atmospheric Administration (NOAA) concluded that 2017 was the third-warmest year in their record. The minor difference in rankings is due to slightly different methods used by the two agencies to analyze global temperatures. The long-term records of the two agencies remain in strong agreement, and both analyses show that the five warmest years on record have all taken place since 2010.
The map above depicts global temperature anomalies in 2017, according to the NASA GISS team. The map does not show absolute temperatures; instead, it shows how much warmer or cooler each region of Earth was compared to a baseline average from 1951 to 1980.
Because the locations and measurement practices of weather stations change over time, there are uncertainties in the interpretation of specific year-to-year global mean temperature differences. Taking this into account, NASA estimates that the 2017 global mean change is accurate to within 0.1 degree Fahrenheit, with a 95 percent certainty level.
“Despite colder than average weather in any one part of the world,” said GISS Director Gavin Schmidt, “temperatures over the planet as a whole continue the rapid warming trend we have seen over the last 40 years.”
The animated figure above shows global temperature anomalies for every month since 1880, a result of the Modern-Era Retrospective analysis for Research and Applications, version 2 (MERRA-2) model run by NASA’s Global Modeling and Assimilation Office. Each line shows how much the global monthly temperature was above or below the annual global mean from 1980–2015. The column on the right lists each year when a new global record was set.
Earth’s average surface temperature has risen a little more than 1 degree Celsius (about 2 degrees Fahrenheit) during the past century or so, a change driven largely by increased carbon dioxide and other human-made emissions into the atmosphere. 2017 was the third consecutive year in which global temperatures were more than 1 degree Celsius (1.8 degrees Fahrenheit) above late 19th-century levels.
Phenomena such as El Niño and La Niña—which warm and cool the tropical Pacific Ocean and cause corresponding variations in global wind and weather patterns—contribute to short-term variations in global temperatures. Also, weather dynamics affect regional temperatures, so not every region on Earth experienced similar amounts of warming last year. Warming trends are strongest in the Arctic regions.
The NASA GISS team assembles its analysis from publicly available data acquired by roughly 6,300 meteorological stations around the world; from ship- and buoy-based instruments measuring sea surface temperature; and from Antarctic research stations. This raw data is analyzed using methods that account for the distribution of temperature stations around the globe and for urban heating effects that could skew the calculations. (For more explanation of how the analysis works, read World of Change: Global Temperatures.)
Analyses from the United Kingdom Met Office and the World Meteorological Organization also ranked 2017 among the top three warmest years on record. Scientists from NOAA, WHO, and the UK Met Office use much of the same raw temperature data, but with different baseline periods or slightly different methods to analyze Earth’s polar regions and global temperatures.
-
References and Related Reading
- NASA Goddard Institute for Space Studies (2018) GISS Surface Temperature Analysis (GISTEMP). Accessed January 18, 2018.
- NOAA National Climatic Data Center (2018, January 18) Global Climate Report: Annual 2017. Accessed January 18, 2018.
- NOAA (2018, January 18) 2017 was third warmest year on record for the globe. Accessed January 18, 2018.
- NASA Earth Observatory (2015) World of Change: Global Temperatures.
- NASA Earth Observatory (2015, January 21) Why So Many Global Temperature Records?
- NASA Earth Observatory (2010, June 3) Global Warming.
NASA Earth Observatory images by Joshua Stevens, based on data from the NASA Goddard Institute for Space Studies. Caption by Kate Ramsayer, NASA Goddard Space Flight Center, with Mike Carlowicz.
- Instrument(s):
- Model
- In situ Measurement
Jakarta is sinking faster than any other big city on the planet, faster, even, than climate change is causing the sea to rise — so surreally fast that rivers sometimes flow upstream, ordinary rains regularly swamp neighborhoods and buildings slowly disappear underground, swallowed by the earth.
Friday, December 22nd, 2017- Jakartans are digging illegal wells, drip by drip draining the underground aquifers on which the city rests — like deflating a giant cushion underneath it.
- About 40 percent of Jakarta now lies below sea level.
Global Temperatures Over the Decades
Wednesday, December 20th, 2017
1885-1894

1895-1904

1905-1914

1915-1924

1925-1934

1935-1944

1945-1954

1955-1964

1965-1974

1975-1984

1985-1994

1995-2004

2005-2014
The world is getting warmer. Whether the cause is human activity or natural variability—and the preponderance of evidence says it’s humans—thermometer readings all around the world have risen steadily since the beginning of the Industrial Revolution. (Click on bullets above to step through the decades.)
According to an ongoing temperature analysis conducted by scientists at NASA’s Goddard Institute for Space Studies (GISS), the average global temperature on Earth has increased by about 0.8° Celsius (1.4° Fahrenheit) since 1880. Two-thirds of the warming has occurred since 1975, at a rate of roughly 0.15-0.20°C per decade.
But why should we care about one degree of warming? After all, the temperature fluctuates by many degrees every day where we live.
The global temperature record represents an average over the entire surface of the planet. The temperatures we experience locally and in short periods can fluctuate significantly due to predictable cyclical events (night and day, summer and winter) and hard-to-predict wind and precipitation patterns. But the global temperature mainly depends on how much energy the planet receives from the Sun and how much it radiates back into space—quantities that change very little. The amount of energy radiated by the Earth depends significantly on the chemical composition of the atmosphere, particularly the amount of heat-trapping greenhouse gases.
A one-degree global change is significant because it takes a vast amount of heat to warm all the oceans, atmosphere, and land by that much. In the past, a one- to two-degree drop was all it took to plunge the Earth into the Little Ice Age. A five-degree drop was enough to bury a large part of North America under a towering mass of ice 20,000 years ago.
The maps above show temperature anomalies, or changes, not absolute temperature. They depict how much various regions of the world have warmed or cooled when compared with a base period of 1951-1980. (The global mean surface air temperature for that period was estimated to be 14°C (57°F), with an uncertainty of several tenths of a degree.) In other words, the maps show how much warmer or colder a region is compared to the norm for that region from 1951-1980.
Global temperature records start around 1880 because observations did not sufficiently cover enough of the planet prior to that time. The period of 1951-1980 was chosen largely because the U.S. National Weather Service uses a three-decade period to define “normal” or average temperature. The GISS temperature analysis effort began around 1980, so the most recent 30 years was 1951-1980. It is also a period when many of today’s adults grew up, so it is a common reference that many people can remember.
The line plot below shows yearly temperature anomalies from 1880 to 2014 as recorded by NASA, NOAA, the Japan Meteorological Agency, and the Met Office Hadley Centre (United Kingdom). Though there are minor variations from year to year, all four records show peaks and valleys in sync with each other. All show rapid warming in the past few decades, and all show the last decade as the warmest.

To conduct its analysis, GISS uses publicly available data from 6,300 meteorological stations around the world; ship- and buoy-based observations of sea surface temperature; and Antarctic research station measurements. These three data sets are loaded into a computer analysis program—available for public download from the GISS web site—that calculates trends in temperature anomalies relative to the average temperature for the same month during 1951-1980.
The objective, according to GISS scientists, is to provide an estimate of temperature change that could be compared with predictions of global climate change in response to atmospheric carbon dioxide, aerosols, and changes in solar activity.
As the maps show, global warming doesn’t mean temperatures rose everywhere at every time by one degree. Temperatures in a given year or decade might rise 5 degrees in one region and drop 2 degrees in another. Exceptionally cold winters in one region might be followed by exceptionally warm summers. Or a cold winter in one area might be balanced by an extremely warm winter in another part of the globe.
Generally, warming is greater over land than over the oceans because water is slower to absorb and release heat (thermal inertia). Warming may also differ substantially within specific land masses and ocean basins. The graph below shows the long-term temperature trends in relation to El Niño or La Niña events, which can skew temperatures warmer or colder in any one year. Orange bars represent global temperature anomalies in El Niño years, with the red line showing the longer trend. Blue bars depict La Niña years, with a blue line showing the trend. Neutral years are shown in gray, and the black line shows the overall temperature trend since 1950.

Since the year 2000, land temperature changes are 50 percent greater in the United States than ocean temperature changes; two to three times greater in Eurasia; and three to four times greater in the Arctic and the Antarctic Peninsula. Warming of the ocean surface has been largest over the Arctic Ocean, second largest over the Indian and Western Pacific Oceans, and third largest over most of the Atlantic Ocean.
In the global maps at the top of this page, the years from 1885 to 1945 tend to appear cooler (more blues than reds), growing less cool as we move toward the 1950s. Decades within the base period do not appear particularly warm or cold because they are the standard against which all decades are measured. The leveling off between the 1940s and 1970s may be explained by natural variability and possibly by cooling effects of aerosols generated by the rapid economic growth after World War II.
Fossil fuel use also increased in the post-War era (5 percent per year), boosting greenhouse gases. But aerosol cooling is more immediate, while greenhouse gases accumulate slowly and take much longer to leave the atmosphere. The strong warming trend of the past three decades likely reflects a shift from comparable aerosol and greenhouse gas effects to a predominance of greenhouse gases, as aerosols were curbed by pollution controls, according to GISS director Jim Hansen.
-
References
- Hansen, J., R. Ruedy, M. Sato, and K. Lo (2010). Global surface temperature change. Reviews of Geophysics, 48 (RG4004)
- National Academy of Sciences (2010). Advancing the Science of Climate Change. Accessed December 1, 2010.
- NASA (2010, January 21). 2009: Second Warmest Year on Record; End of Warmest Decade. Accessed November 30, 2010.
- NASA (2010, January 21). NASA Climatologist Gavin Schmidt Discusses the Surface Temperature Record. Accessed November 30, 2010.
- NASA Earth Observatory (2010, June 3) Fact Sheet: Global Warming. November 30, 2010.
- NASA Goddard Institute for Space Studies (n.d.). GISS Surface Temperature Analysis. Accessed November 30, 2010.
- NOAA National Climatic Data Center (n.d.). Global Warming Frequently Asked Questions. Accessed December 1, 2010.
- NOAA Paleoclimatology. (n.d.) Climate Timeline Tool: Climate Resources for 1000 Years. Accessed December 1, 2010.
Researchers around the world analyzed 27 extreme weather events from 2016 and found that human-caused climate change was a “significant driver” for 21 of them.
Friday, December 15th, 2017Global Maps


A report from 13 U.S. federal agencies that called evidence of a global, long-term warming trend “unambiguous.”
Monday, November 6th, 2017Climate Science Special Report: Fourth National Climate Assessment, Volume I [Wuebbles, D.J., D.W. Fahey, K.A. Hibbard, D.J. Dokken, B.C. Stewart, and T.K. Maycock (eds.)]. U.S. Global Change Research Program, Washington, DC, USA, pp. 12-34, doi: 10.7930/J0DJ5CTG.
Full Report: https://science2017.globalchange.gov/downloads/CSSR2017_FullReport.pdf
Global Drought
Thursday, September 14th, 2017
As global temperatures continue to rise, the prevailing wisdom in the climate science community is that droughts will grow more frequent and more extreme in the 21st century. Though temperatures were already rising in the 20th century, the global trend in drought length and severity was ambiguous, with no clear pattern. However, the impacts of droughts was less ambiguous, particularly in recent decades.
In a study published in August 2017 in the journal Nature, researchers from 17 institutions found that more of Earth’s land surface is now being affected by drought and ecosystems are taking longer to recover from dry spells. Recovery is particularly worse in the tropics and at high latitudes, two areas that are already pretty vulnerable to global change.
The map above is based on data from that study, which was led by Christopher Schwalm of Woods Hole Research Center. It depicts the average length of time that it took for vegetation to recover from droughts that occurred between 2000 and 2010. The darkest colors mark the areas with the longest drought recovery time. Land areas colored light gray were covered by ice or sand (deserts).
Up until now, most assessments of drought and recovery have focused on the hydrology; that is, has new rain and snowfall made up for the deficit of water in rivers, lakes, and soils? In this new study, researchers focused on the health and resilience of the trees and other plants because full reservoirs and streams do not necessarily mean that vegetation has recovered.
The research team combined observations from the Moderate Resolution Imaging Spectroradiometer (MODIS) on NASA’s Terra satellite, ground measurements, and computer models to assess changes in drought. In particular, they measured changes in gross primary productivity, or how well plants are consuming and storing carbon dioxide through photosynthesis. As the analysis showed, plants in many regions are taking longer to recover from drought, often because weather is more extreme (usually hotter) than in the past.
If the time between droughts grows shorter (as predicted) and the time to recover from them keeps growing longer, some ecosystems could reach a tipping point and change permanently. This could affect how much carbon dioxide is stored on land in trees and other vegetation (the land “carbon sink”). If less carbon is being captured and stored, then more of what humans produce would remain in the atmosphere, creating a feedback loop that amplifies the warming that leads to more drought.
“The most important implication of our study,” said Schwalm, “is that under business-as-usual emissions of greenhouse gases, the time between drought events will likely become shorter than the time needed for recovery.”
“Using the vantage point of space, we can see all of Earth’s forests and other ecosystems getting hit repeatedly and increasingly by droughts,” added co-author Josh Fisher of NASA’s Jet Propulsion Laboratory. “Some of these ecosystems recover, but, with increasing frequency, others do not.”
-
-
Reference
- Schwalm, C.R. et al. (2017). Global patterns of drought recovery. Nature, 548, 202–205.
-
NASA Earth Observatory image by Jesse Allen, using data provided by Christopher Schwalm (WHRC). Story by Michael Carlowicz, with reporting from JPL and WHRC.
The Cost of Hurricanes
Thursday, September 7th, 2017Why Hurricanes Keep Getting Costlier
“….In 2016, the Congressional Budget Office estimated that hurricanes currently cause about $28 billion, on average, in annual damage nationwide. But those costs are projected to rise 40 percent between now and 2075, after adjusting for inflation.
Nearly half of that projected increase, the C.B.O. said, is because global warming and sea-level rise are expected to make hurricanes and storm surges more severe…..
But half of the expected rise in hurricane costs is the result of expected increases in coastal development. Today, according to the C.B.O., roughly 1.2 million Americans live in coastal areas at risk of “substantial damage” from hurricanes — defined as damage of at least 5 percent of average income. By 2075, that number is forecast to rise to 10 million.
Population growth can also increase hurricane risks by adding newcomers who are unfamiliar with big storms or by clogging roads during evacuations…..”
“…..sea levels along Miami’s coasts have risen 3.3 inches since then [1992], and the city is already seeing an increase in “sunny-day flooding” during high tides. With sea levels higher, a hurricane that struck in a vulnerable place could conceivably produce far greater flooding….. “