Archive for the ‘Climate Change’ Category
UN/WHO: Workers in fields and factories face an epidemic of heat-related injuries that will devastate their health, income and productivity as climate change takes hold.
Thursday, May 5th, 2016Climate Change and The Workplace

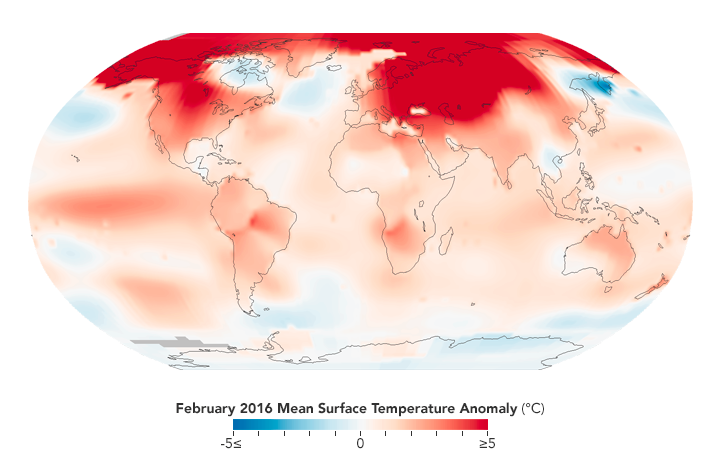
February 2016 was the warmest February in 136 years of modern temperature records. That month deviated more from normal than any month on record.
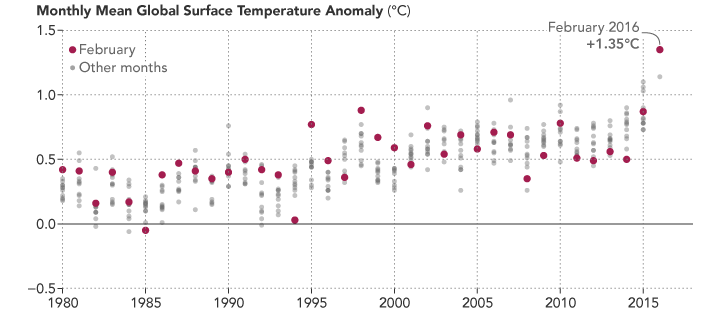
According to an ongoing temperature analysis conducted by scientists at NASA’s Goddard Institute for Space Studies (GISS), the average global temperature in February was about 0.5 degrees Celsius (0.8 degrees Fahrenheit) warmer than the previous record (February 1998). February 2016 was 1.35 degrees Celsius above the 1951–80 average; February 1998 was 0.88°C above it. Both records were set during strong El Niño events.
The map above depicts global temperature anomalies for February 2016. It does not show absolute temperatures; instead it shows how much warmer or cooler the Earth was compared to a baseline average from 1951 to 1980.
Almost all land surfaces on Earth experienced unusually warm temperatures in February 2016. The warmest temperatures occurred in Asia, North America, and the Arctic. Two of the exceptions were the Kamchatka Peninsula and a small portion of southeast Asia, which saw unusually cool temperatures. Note the clear fingerprint of El Niño in the equatorial Pacific Ocean.

The chart above plots the global temperature anomaly for each month of the year since 1980. Each February is highlighted with a red dot. All dots, red or gray, show how much global temperatures rose above or below the 1951–1980 average. Despite monthly variability, the long-term trend due to global warming is clear and now punctuated by the unusually warm data point for February 2016.
The GISS team assembles its temperature analysis from publicly available data acquired by roughly 6,300 meteorological stations around the world; by ship- and buoy-based instruments measuring sea surface temperature; and by Antarctic research stations. This raw data is analyzed using methods that account for the varied spacing of temperature stations around the globe and for urban heating effects that could skew the calculations. The modern global temperature record begins around 1880 because observations did not cover enough of the planet prior to that time.
For more explanation of how the analysis works, visit the GISS Surface Temperature F.A.Q. page.
-
References
- NASA Goddard Institute for Space Studies (2016, March 14) GISS Surface Temperature Analysis (GISTEMP). Accessed March 14, 2015.
-
Further Reading
- Climate Central (2016, February 14) What To Know About February’s Satellite Temp Record. Accessed March 16, 2016.
- Mashable (2016, February 14) February obliterated global temperature records: The 5 most important implications. Accessed March 16, 2016.
- Spencer, R. (2016, February 14) UAH V6 Global Temperature Update for Feb. 2016: +0.83 deg. C (new record). Accessed March 16, 2016.
- The Washington Post (2016, March 14) The planet had its biggest temperature spike in modern history in February. Accessed March 16, 2016.
- Weather Underground (2016, March 13) February Smashes Earth’s All-Time Global Heat Record by a Jaw-Dropping Margin. Accessed March 16, 2016.
NASA Earth Observatory images by Joshua Stevens, using data from the Goddard Institute for Space Studies. Caption by Adam Voiland.
- Instrument(s):
- In situ Measurement
Extreme Weather & Crop Production
Friday, January 8th, 2016Influence of extreme weather disasters on global crop production
- Journal name: Nature; Volume: 529, Pages: 84–87
- Date published: 07 January 2016
- DOI: doi:10.1038/nature16467
In recent years, several extreme weather disasters have partially or completely damaged regional crop production1, 2, 3, 4, 5. While detailed regional accounts of the effects of extreme weather disasters exist, the global scale effects of droughts, floods and extreme temperature on crop production are yet to be quantified. Here we estimate for the first time, to our knowledge, national cereal production losses across the globe resulting from reported extreme weather disasters during 1964–2007. We show that droughts and extreme heat significantly reduced national cereal production by 9–10%, whereas our analysis could not identify an effect from floods and extreme cold in the national data. Analysing the underlying processes, we find that production losses due to droughts were associated with a reduction in both harvested area and yields, whereas extreme heat mainly decreased cereal yields. Furthermore, the results highlight ~7% greater production damage from more recent droughts and 8–11% more damage in developed countries than in developing ones. Our findings may help to guide agricultural priorities in international disaster risk reduction and adaptation efforts.


** Droughts and heat waves wiped out nearly 1/10 of the rice, wheat, corn and other cereal crops in countries hit by extreme weather disasters between 1964 and 2007.
Thursday, January 7th, 20161885 – 1894 2005 – 2014
NASA: The world is getting warmer, whatever the cause.
According to an analysis by NASA scientists, the average global temperature has increased by about 0.8°Celsius (1.4° Fahrenheit) since 1880.
Two-thirds of the warming has occurred since 1975.
NASA: Fires Put a Carbon Monoxide Cloud over Indonesia
Sunday, December 13th, 2015
In September and October 2015, tens of thousands of fires sent clouds of toxic gas and particulate matter into the air over Indonesia. Despite the moist climate of tropical Asia, fire is not unusual during those months. For the past few decades, people have used fire to clear land for farming and to burn away leftover crop debris. What was unusual in 2015 was how many fires burned and how many escaped their handlers and went uncontrolled for weeks and even months.
To study the fires, scientists in Indonesia and around the world have been using many different tools—from sensors on the ground to data collected by satellites. The goal is to better understand why the fires became so severe, how they are affecting human health and the atmosphere, and what can be done to prepare for similar surges in fire activity in the future.
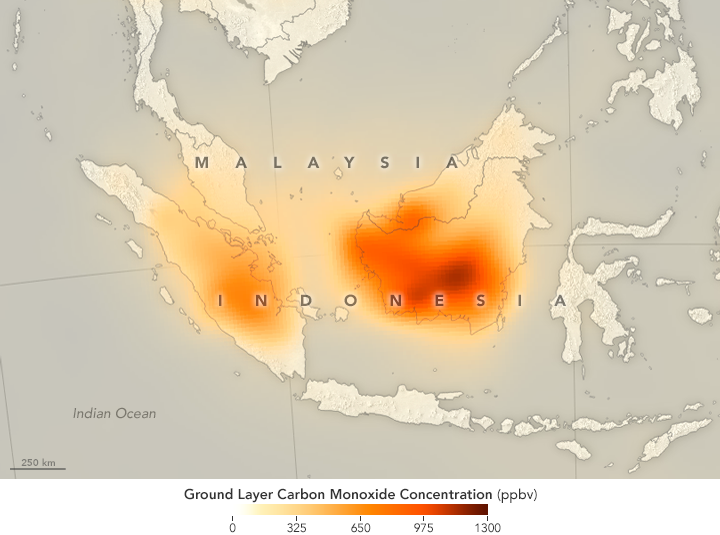
While some NASA satellite instruments captured natural-color images of the smoky pall, others focused on gases that are invisible to human eyes. For instance, the Measurement of Pollution in the Troposphere (MOPITT) sensor on Terra can detect carbon monoxide, an odorless, colorless, and poisonous gas. As shown by the map above, the concentration of carbon monoxide near the surface was remarkably high in September 2015 over Sumatra and Kalimantan.
“The 2015 Indonesian fires produced some of the highest concentrations of carbon monoxide that we have ever seen with MOPITT,” said Helen Worden, a scientist at the National Center for Atmospheric Research. Average carbon monoxide concentrations over Indonesia are usually about 100 parts per billion. In some parts of Borneo in 2015, MOPITT measured carbon monoxide concentrations at the surface up to nearly 1,300 parts per billion.
While all types of wildfires emit carbon monoxide as part of he combustion process, the fires in Indonesia released large amounts of the gas because in many cases the fuel burning was peat, a soil-like mixture of partly decayed plant material that builds up in wetlands, swamps, and partly submerged landscapes.
Read more about studies of Indonesia’s fire season in our new feature: Seeing Through the Smoky Pall.
NASA Earth Observatory map by Joshua Stevens and Jesse Allen, using data from the MOPITT Teams at the National Center for Atmospheric Research and the University of Toronto. Caption by Adam Voiland.
- Instrument(s):
- Terra – MOPITT


