Global & Disaster Medicine

Archive for the ‘Earthquake’ Category

A 6.9M earthquake struck Lombok on Sunday, killing at least 82 people and shaking neighboring Bali.

ShakeMap Intensity image

https://www.youtube.com/watch?v=RIcWevuVyrA


M 6.4 – 5km N of Lelongken, Indonesia: At least 14 dead and over 160 injured.

ShakeMap Intensity image


6/21/1990: A 7.7M earthquake near the Caspian Sea in Iran kills more than 50,000 and injures another 135,000 people

History Channel

World History Project

ShakeMap Intensity image


The 5.3M earthquake Osaka during morning rush hour Monday, killing at least 4 and injuring 214

CNN

https://www.youtube.com/watch?v=NEeypX-zacc


A strong earthquake hit the Japanese city of Osaka during morning rush hour Monday, killing at least three people and injuring 214

Magnitude Mw 5.6
Region NEAR S. COAST OF WESTERN HONSHU
Date time 2018-06-17 22:58:34.4 UTC
Location 34.84 N ; 135.53 E
Depth 14 km
Distances 16 km N of Ōsaka-shi, Japan / pop: 2,593,000 / local time: 07:58:34.4 2018-06-18
4 km NW of Ibaraki, Japan / pop: 274,000 / local time: 07:58:34.4 2018-06-18
Global view

Source parameters reviewed by a seismologist

Seismotectonics of Japan and Vicinity

The North America plate, Pacific plate, Philippine Sea plate, and Eurasia plate all influence the tectonic setting of Japan, Taiwan, and the surrounding area. Some authors divide the edges of these plates into several microplates that together take up the overall relative motions between the larger tectonic blocks, including the Okhotsk microplate in northern Japan, the Okinawa microplate in southern Japan, the Yangzee microplate in the area of the East China Sea, and the Amur microplate in the area of the Sea of Japan.

The seafloor expression of the boundary between the Pacific and North America plates lies 300 km off the east coasts of Hokkaido and Honshu at the Kuril-Kamchatka and Japan trenches. The subduction of the Pacific plate beneath the North America plate, at rates of 83-90 mm/yr, generates abundant seismicity, predominantly as a result of interplate slip along the interface between the plates. The 1958 M 8.4 Etorofu, 1963 M 8.6 Kuril, 2003 M 8.3 Tokachi-Oki, and the 2011 M 9.0 Tohoku earthquakes all exemplify such megathrust seismicity. The 1933 M 8.4 Sanriku-Oki earthquake and the 1994 M 8.3 Shikotan earthquake are examples of intraplate seismicity, caused by deformation within the lithosphere of the subducting Pacific plate (Sanriku-Oki) and of the overriding North America plate (Shikotan), respectively.

At the southern terminus of the Japan Trench the intersection of the Pacific, North America, and Philippine Sea plates forms the Boso Triple Junction, the only example of a trench-trench-trench intersection in the world. South of the triple junction the Pacific plate subducts beneath the Philippine Sea plate at the Izu-Ogasawara trench, at rates of 45-56 mm/yr. This margin is noteworthy because of the steep dip of the subducting Pacific plate (70° or greater below depths of 50 km depth), and because of its heterogeneous seismicity; few earthquakes above M 7 occur at shallow depths, yet many occur below 400 km. The lack of large shallow megathrust earthquakes may be a result of weak coupling at the plate interface, or simply a reflection of an incomplete earthquake catalog with respect to the length of typical seismic cycles.

The northernmost section of the Philippine Sea plate shares a 350 km boundary with the North America plate that runs approximately east-west from the Boso Triple Junction towards the Izu Peninsula. This short boundary is dominated by the subduction of the Philippine Sea plate beneath Japan along the Sagami Trough, but also includes small sections of transform motion.

The subduction of the Philippine Sea plate under the Eurasia plate begins at the Suruga Trough, immediately southwest of the Izu peninsula. In the northern Tōkai, Tonankai and Nankai sections of this subduction zone, historical data indicate M 8+ earthquake recurrence intervals of 100-150 years. The Tonankai and Nankai sections last ruptured in M 8.1 earthquakes in 1944 and 1946, respectively, while the Tōkai section last broke in 1854. In the 1980’s studies began to forecast the imminence of a large earthquake in the Tōkai region, and warned of its potential impact on the cities of Tokyo and Yokohama (the two largest cities in Japan); to date, the expected event has not occurred.

The boundary between the Philippine Sea and Eurasia plates continues south and southwestwards from the Suruga Trough, extending 2000 km along the Nankai and Ryukyu trenches before reaching the island of Taiwan. Along the Ryukyu Trench, the Philippine Sea plate exhibits trench normal subduction at rates increasing from 48 mm/yr in the northeast to 65 mm/yr in the southwest. Convergence and the associated back-arc deformation west of the oceanic trench creates the Ryukyu Islands and the Okinawa Trough. The largest historic event observed along this subduction zone was the M 8.1 Kikai Island earthquake in 1911.

In the vicinity of Taiwan the structure of the Philippine Sea: Eurasia plate boundary and the associated pattern of seismicity becomes more complex. 400 km east of Taiwan a clockwise rotation in the trend of the margin (from NE-SW to E-W), paired with an increase in subduction obliquity creates a section of the plate boundary that exhibits dextral transform and oblique thrusting motions. South of Taiwan the polarity of subduction flips; the Eurasia plate subducts beneath the Philippine Sea plate. Debate surrounds contrasting models of the plate boundary position between the zones of oppositely verging subduction, and the boundary’s relation to patterns of seismicity. Many studies propose that crustal thickening causes the majority of regional seismicity, while others attribute seismicity to deformation associated with subduction. Another resolution proposes a tear in the Philippine Sea plate and a complex assortment of subduction, transform, and collisional motion. All the models concede that seismicity around the island of Taiwan is anomalously shallow, with few earthquakes deeper than 70km.

While there are no instances of an earthquake M>8 in the modern record, Taiwan and its surrounding region have experienced eight M>7.5 events between 1900 and 2014. The dominance of shallow M<8 earthquakes suggests fairly weak plate boundary coupling, with most earthquakes caused by internal plate deformation. The 1935 M 7.1 Hsinchu-Taichung earthquake and the 1999 M 7.6 Chi-Chi Earthquake both exemplify the shallow continental crust thrust faulting that dominates regional seismicity across the island. A major tectonic feature of the island is the Longitudinal Valley Fault, which ruptures frequently in small, shallow earthquakes. In 1951, the Longitudinal Valley Fault hosted twelve M≥6 events known as the Hualien-Taitung earthquake sequence.

Large earthquakes in the vicinity of Japan and Taiwan have been both destructive and deadly. The regions high population density makes shallow earthquakes especially dangerous. Since 1900 there have been 13 earthquakes (9 in Japan, 4 in Taiwan) that have each caused over 1000 fatalities, leading to a total of nearly 200,000 earthquake related deaths. In January 1995 an earthquake that ruptured a southern branch of the Japan Median Tectonic Line near the city of Kobe (population 1.5 million) killed over 5000 people. The 1923 Kanto earthquake shook both Yokohama (population 500,000, at that time) and Tokyo (population 2.1 million), killing 142,000 people. The earthquake also started fires that burned down 90% of the buildings in Yokohama and 40% of the buildings in Tokyo. Most recently, the M9.0 Tohoku earthquake, which ruptured a 400 km stretch of the subduction zone plate boundary east of Honshu, and the tsunami it generated caused over 20,000 fatalities.

More information on regional seismicity and tectonics


San Francisco: Experts consider these buildings vulnerable to collapse only in extreme shaking caused by rare and powerful earthquakes, similar to the one that struck San Francisco in 1906.

NY Times

USGS document:  HayWired

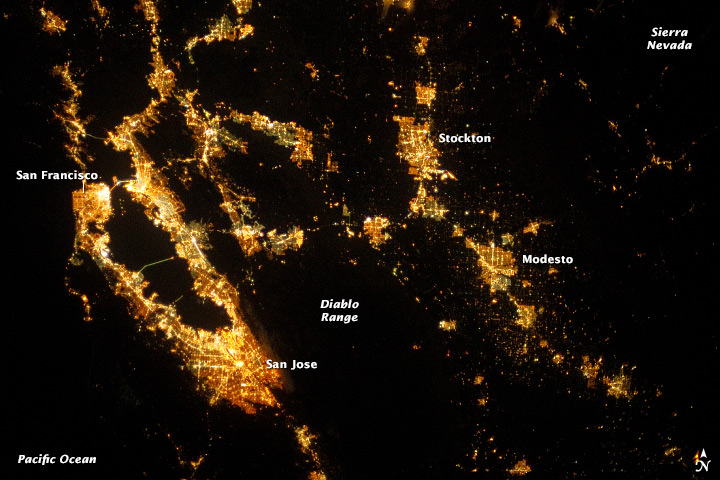
San Francisco Region at Night

Abstract

The HayWired Earthquake Scenario—Engineering Implications is the second volume of U.S. Geological Survey (USGS) Scientific Investigations Report 2017–5013, which describes the HayWired scenario, developed by USGS and its partners. The scenario is a hypothetical yet scientifically realistic earthquake sequence that is being used to better understand hazards for the San Francisco Bay region during and after a magnitude-7 earthquake (mainshock) on the Hayward Fault and its aftershocks.

Analyses in this volume suggest that (1) 800 deaths and 16,000 nonfatal injuries result from shaking alone, plus property and direct business interruption losses of more than $82 billion from shaking, liquefaction, and landslides; (2) the building code is designed to protect lives, but even if all buildings in the region complied with current building codes, 0.4 percent could collapse, 5 percent could be unsafe to occupy, and 19 percent could have restricted use; (3) people expect, prefer, and would be willing to pay for greater resilience of buildings; (4) more than 22,000 people could require extrication from stalled elevators, and more than 2,400 people could require rescue from collapsed buildings; (5) the average east-bay resident could lose water service for 6 weeks, some for as long as 6 months; (6) older steel-frame high-rise office buildings and new reinforced-concrete residential buildings in downtown San Francisco and Oakland could be unusable for as long as 10 months; (7) about 450 large fires could result in a loss of residential and commercial building floor area equivalent to more than 52,000 single-family homes and cause property (building and content) losses approaching $30 billion; and (8) combining earthquake early warning (ShakeAlert) with “drop, cover, and hold on” actions could prevent as many as 1,500 nonfatal injuries out of 18,000 total estimated nonfatal injuries from shaking and liquefaction hazards.

Suggested Citation

Detweiler, S.T., and Wein, A.M., eds., 2018, The HayWired earthquake scenario—Engineering implications: U.S. Geological Survey Scientific Investigations Report 2017–5013–I–Q, 429 p., https://doi.org/10.3133/sir20175013v2.

“……Engineers have known about a major defect in certain steel-frame buildings since 1994, when shaking from the Northridge earthquake in Los Angeles fractured critical joints in more than 60 buildings, bringing at least one very close to collapse. The building code was rewritten to eliminate the flawed technique.….”

1. Hartford Building, 650 California

2. Beal Bank Building, 180 Sansome

3. Bechtel Building, 50 Beale

4. 44 Montgomery

5. 425 California Street

6. 555 California Street

7. McKesson Plaza, One Post

8. Pacific Gas & Electric Building, 77 Beale

9. One Embarcadero Center, 355 Clay

10. Transamerica Pyramid, 600 Montgomery

11. 100 Pine Center, 100 Pine


USGS: Kilauea Update

HAWAIIAN VOLCANO OBSERVATORY DAILY UPDATE
U.S. Geological Survey
Saturday, May 5, 2018, 11:54 AM HST (Saturday, May 5, 2018, 21:54 UTC)

KILAUEA VOLCANO (VNUM #332010)
19°25’16” N 155°17’13” W, Summit Elevation 4091 ft (1247 m)
Current Volcano Alert Level: WARNING
Current Aviation Color Code: ORANGE

USGS

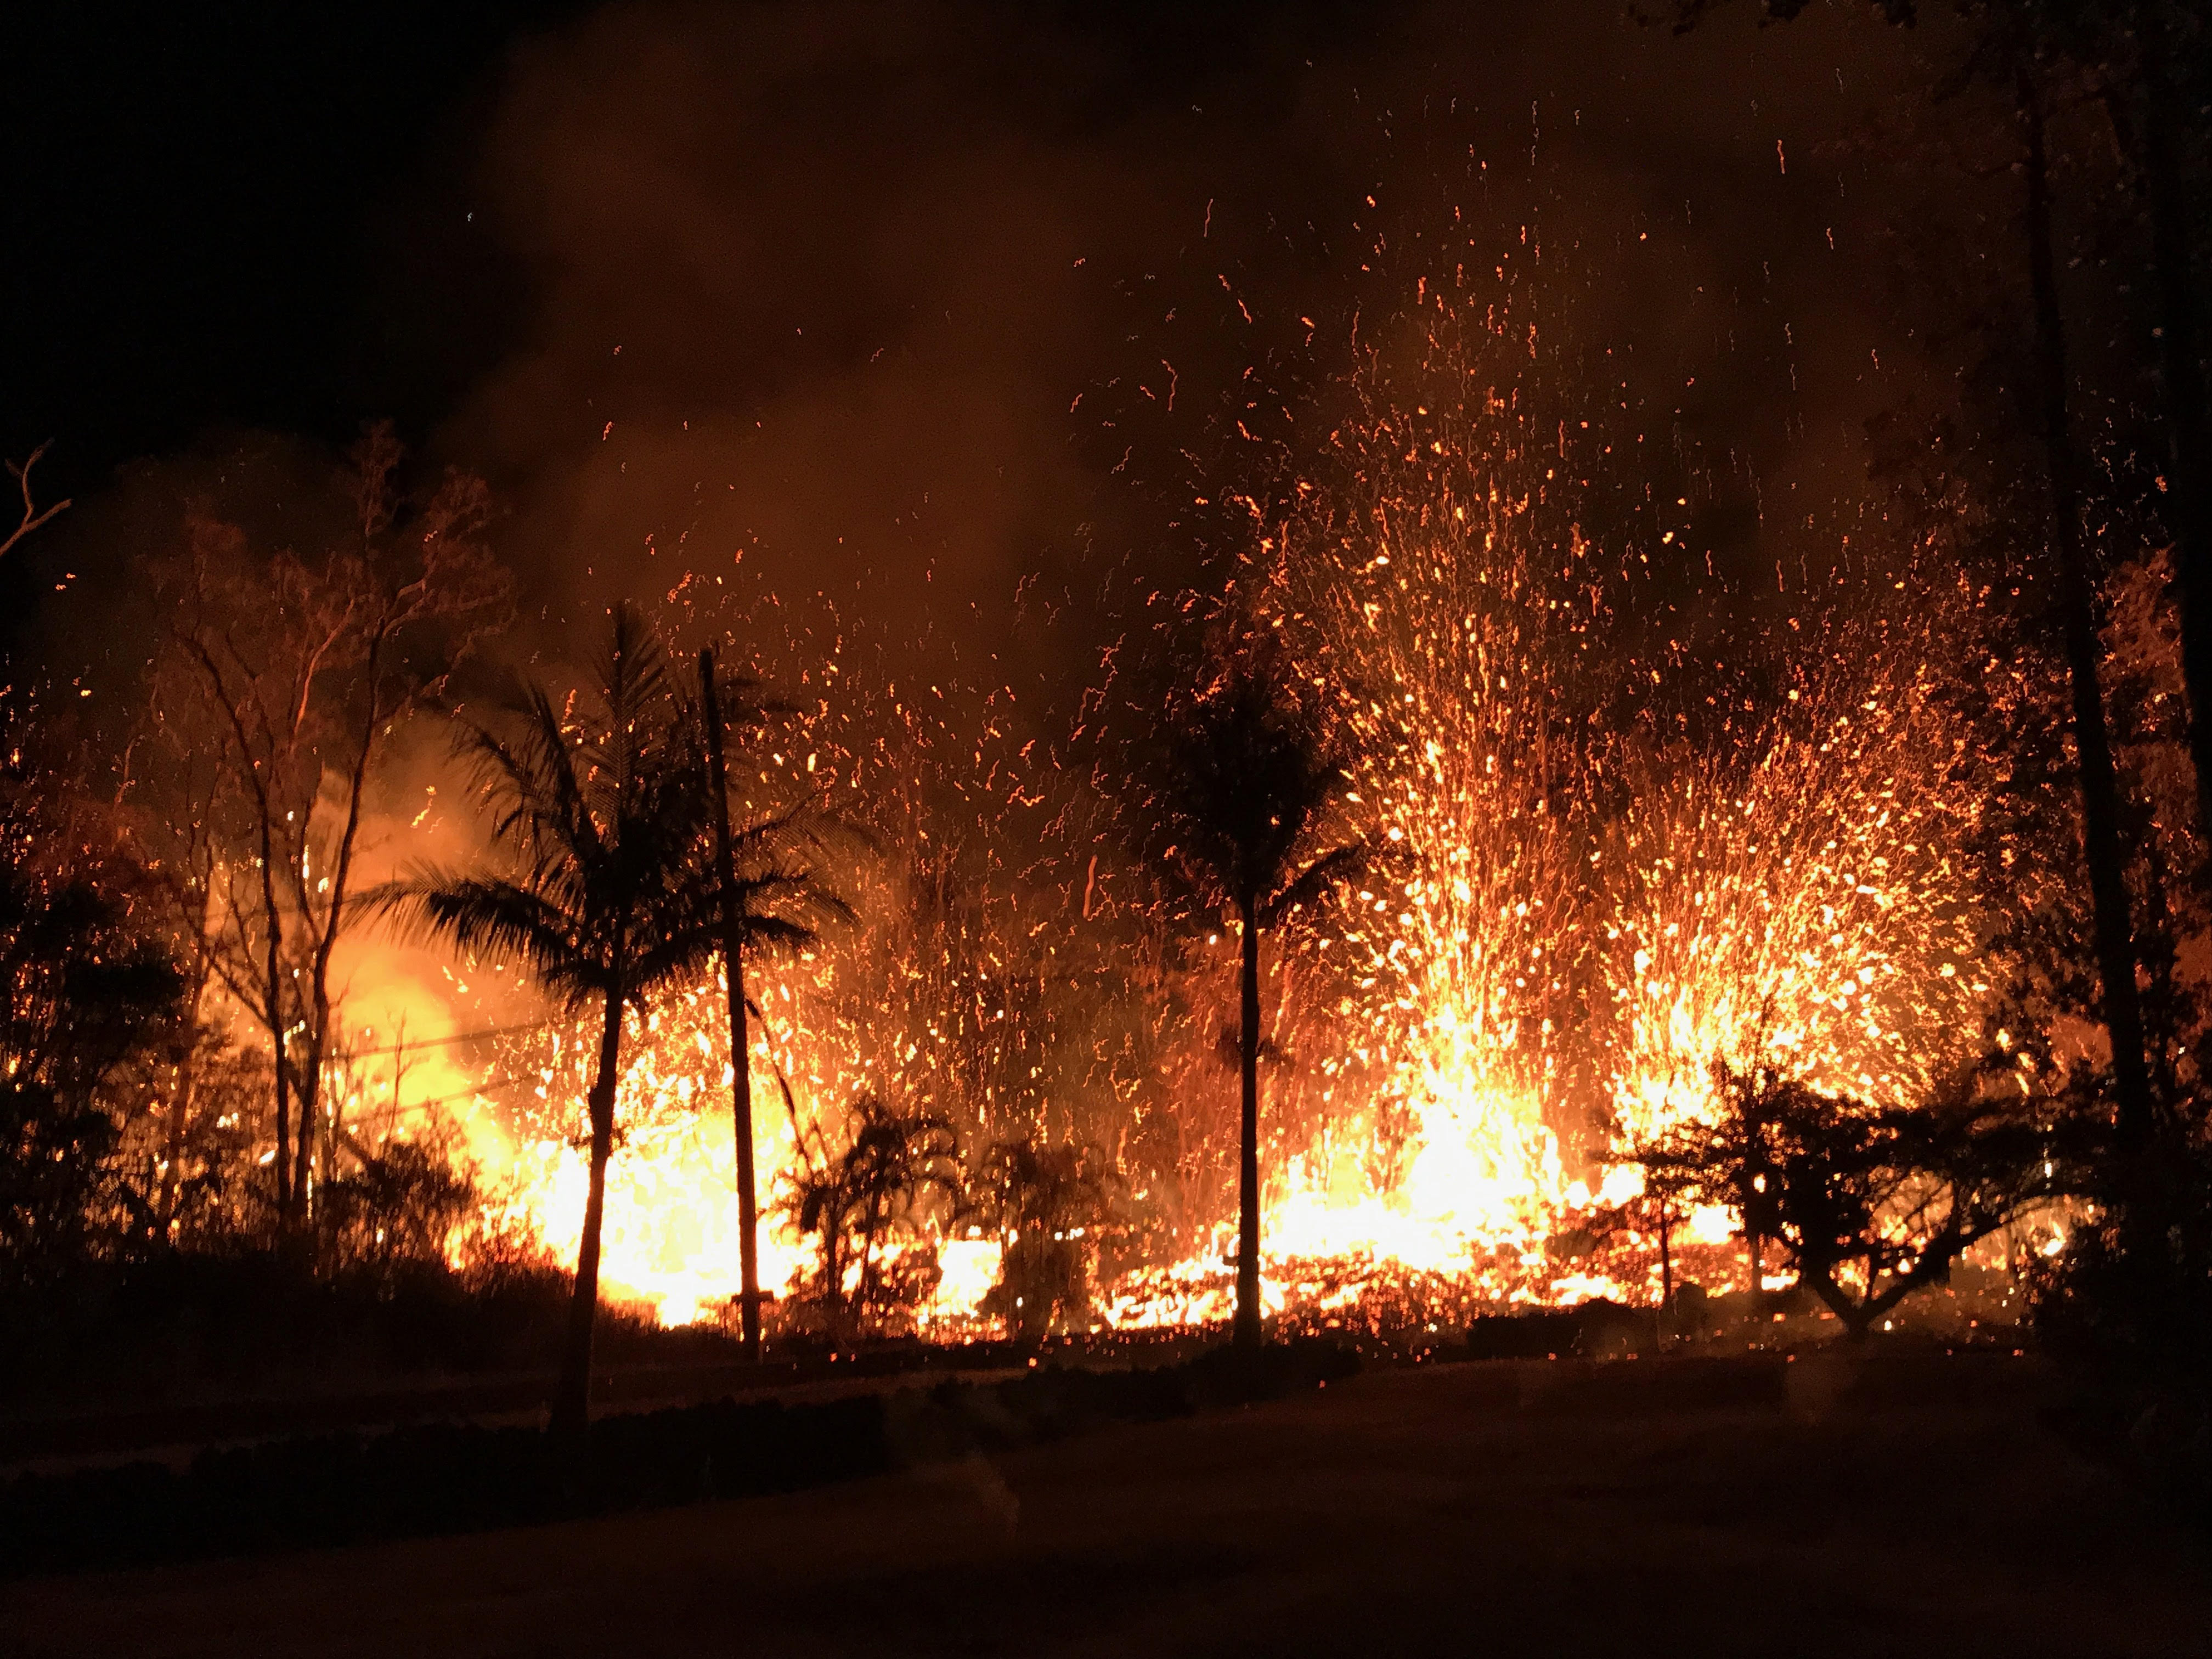
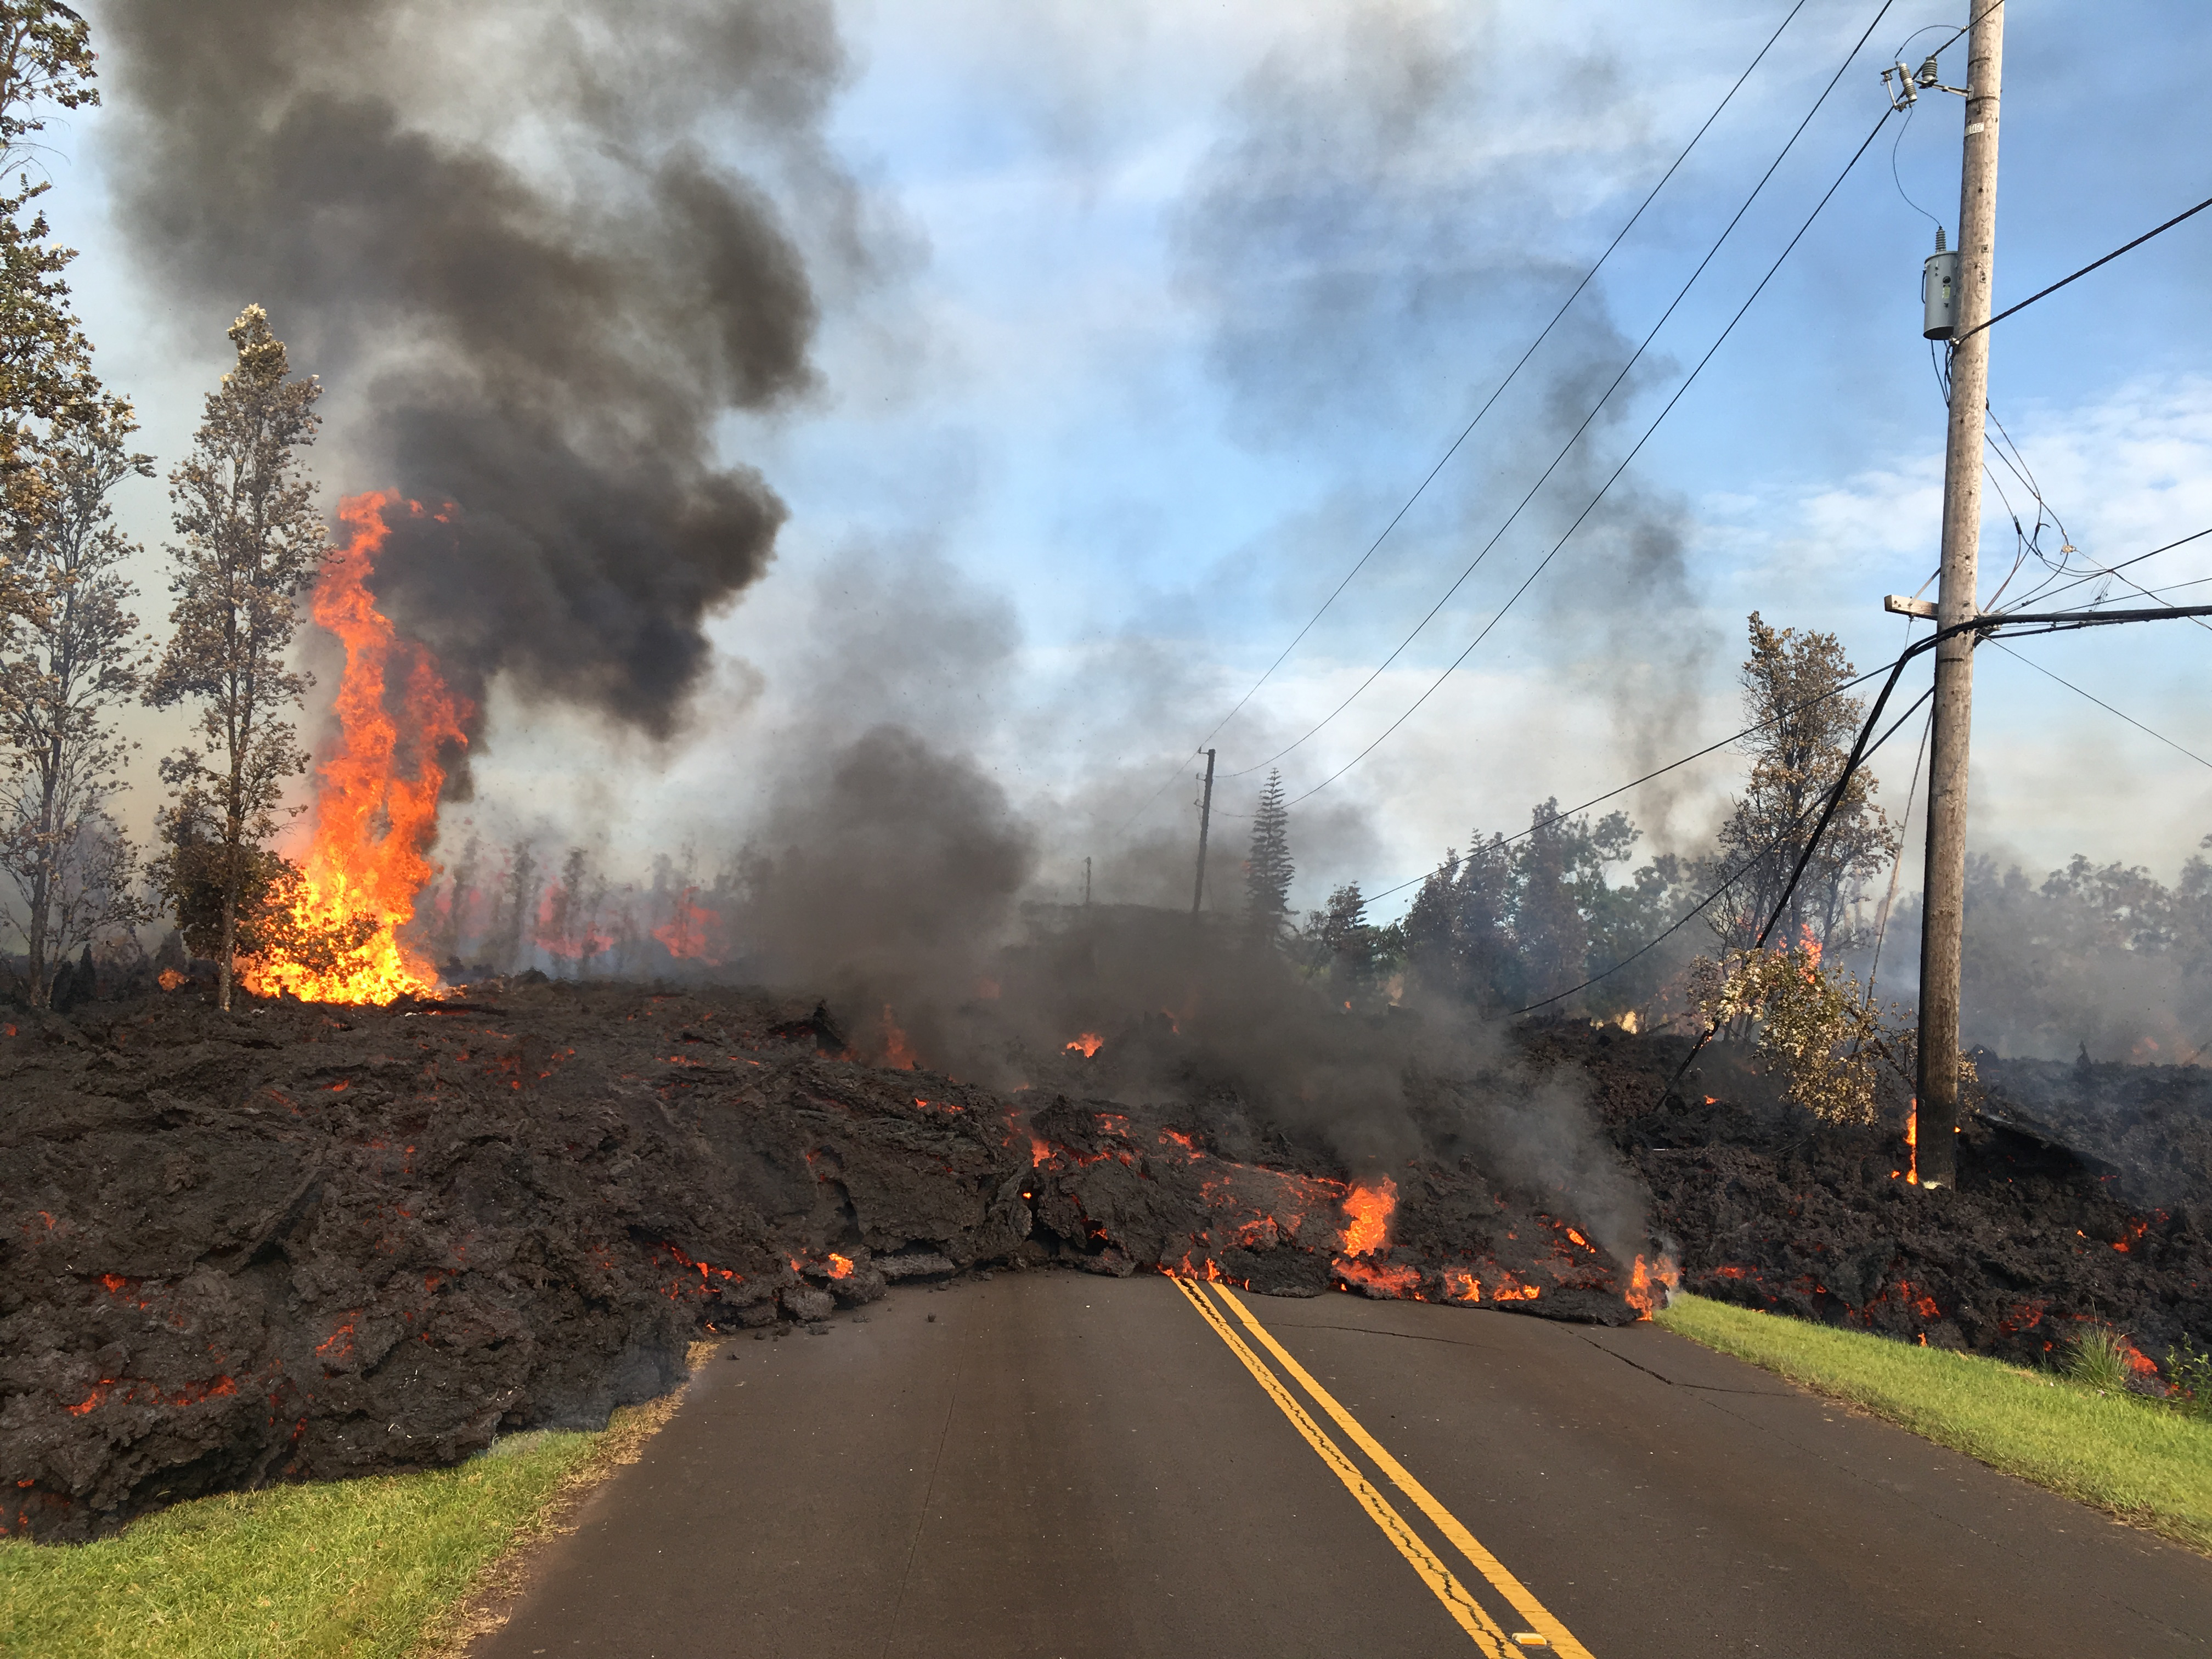
Summary: Active eruption of lava and gas continues along Kīlauea Volcano’s lower East Rift Zone within the Leilani Estates subdivision. Additional fissure vents producing spatter and small lava flows developed early this morning, and additional outbreaks in the area are likely. Deflationary tilt at the summit of the volcano continues and the lava lake level continues to drop. There is no active lava in the Puʻu ʻŌʻō area. Aftershocks from yesterday’s M6.9 earthquake continue and more should be expected, with larger aftershocks potentially producing rockfalls and associated ash clouds above Puʻu ʻŌʻō and Halemaʻumaʻu Crater.

Photos and maps of activity will be posted to the HVO web site as soon as possible. https://volcanoes.usgs.gov/volcanoes/kilauea/multimedia_chronology.html

USGS

Residents of the Puna District should remain alert, review individual, family, and business emergency plans, and watch for further information about the status of the volcano.

Hawaii County Civil Defense messages regarding conditions, warning, and evacuations may be found at http://www.hawaiicounty.gov/active-alerts/.

Summit Observations: Deflationary tilt at the summit continues. In concert, the summit lava lake is dropping. Tremor amplitude is fluctuating with lava lake spattering. No large rockfalls or ash plumes related to rockfalls into the lava lake, such as occurred yesterday during the large earthquake sequence, have occurred. Elevated summit sulfur dioxide emission rates persist. Gas emissions remain elevated. Current webcam views are here: https://volcanoes.usgs.gov/volcanoes/kilauea/multimedia_webcams.html

Puʻu ʻŌʻō Observations: Seismicity remains elevated at Puʻu ʻŌʻō but tiltmeters near the cone show no significant deformation overnight. No lava is active in the area and the 61g lava flow is no longer being fed. The summit crater of the cone will likely continue to collapse intermittently producing small plumes of ash. Yesterday, there were several vigorous episodes of ash emission in response to collapse, including immediately after the nearby M6.9 earthquake.

Hazard Analysis: Additional fissure outbreaks producing spatter and lava flows are likely. Locations cannot be forecast with certainty, but new outbreaks thus far have been preceded by ground cracking, then strong steam and volcanic gas release. Areas uprift and downrift of the current fissure zone are the most likely to see further outbreaks.

Areas downslope of an erupting fissure or vent are at risk of lava inundation. Currently, lava flows from active fissures are sluggish and not moving very quickly or far. The general area of the Leilani subdivision remains at greatest risk. However, as the eruption progresses, other areas of the lower East Rift Zone may also be at risk.
High levels of volcanic gas including sulphur dioxide are being emitted from the fissure vents. In addition, smoke from burning houses and burning asphalt is a health concern and should be avoided.

As the lava lake level inside Halemaʻumaʻu drops, rockfalls from the enclosing walls may increase in frequency prompting explosions of spatter from the lake onto the nearby crater rim and lofting plumes of ash. Dustings of ash from these events can occur downwind. Yesterday’s strong earthquakes were responsible for some of these plumes and associated ashfall, both from Kīlauea Volcano’s summit lava lake and the Puʻu ʻŌʻō vent.

Additional aftershocks from yesterday’s M6.9 earthquake are expected and some may be strong. Residents are advised to review earthquake preparedness by consulting available resources such as: https://www.shakeout.org/hawaii/dropcoverholdon/


Earthquakes, as big as 6.9M, have hit Hawaii’s Big Island, one day after the eruption of the Kilauea volcano.

ShakeMap Intensity image

BBC


Possibility of volcanic eruptions grows in Hawaii with increased low magnitude earthquake activity

Hawaii County Civil Defense Agency

“This is a Civil Defense message for Wednesday May 2, 2018 at 6:00 PM.

The Hawaiian Volcanoes Observatory reports continuous low magnitude earthquake activity along the east rift zone in lower Puna which includes Leilani Estates, Nanawale Estates, to the coastal area of Kapoho.

Due to this activity Hawaiian Volcanoes Observatory indicates an eruption is possible. Because it is not possible to predict where an eruption could occur, the areas that could be affected are Nanawale Estates, Leilani Estates or Kapoho.

Due to the possibility of an eruption, the following are issued:

Prepare and review your emergency plans in case you need to evacuate.
Stay informed by listening to local radio stations for Civil Defense updates or call Civil Defense at 935-0031.
Hawaiian Volcanoes Observatories and your Hawaii County Civil Defense will continue to monitor the situation. You will be informed of any conditions that affect your safety.

This is your Hawai’i County Civil Defense Agency.”

May 2, 2018


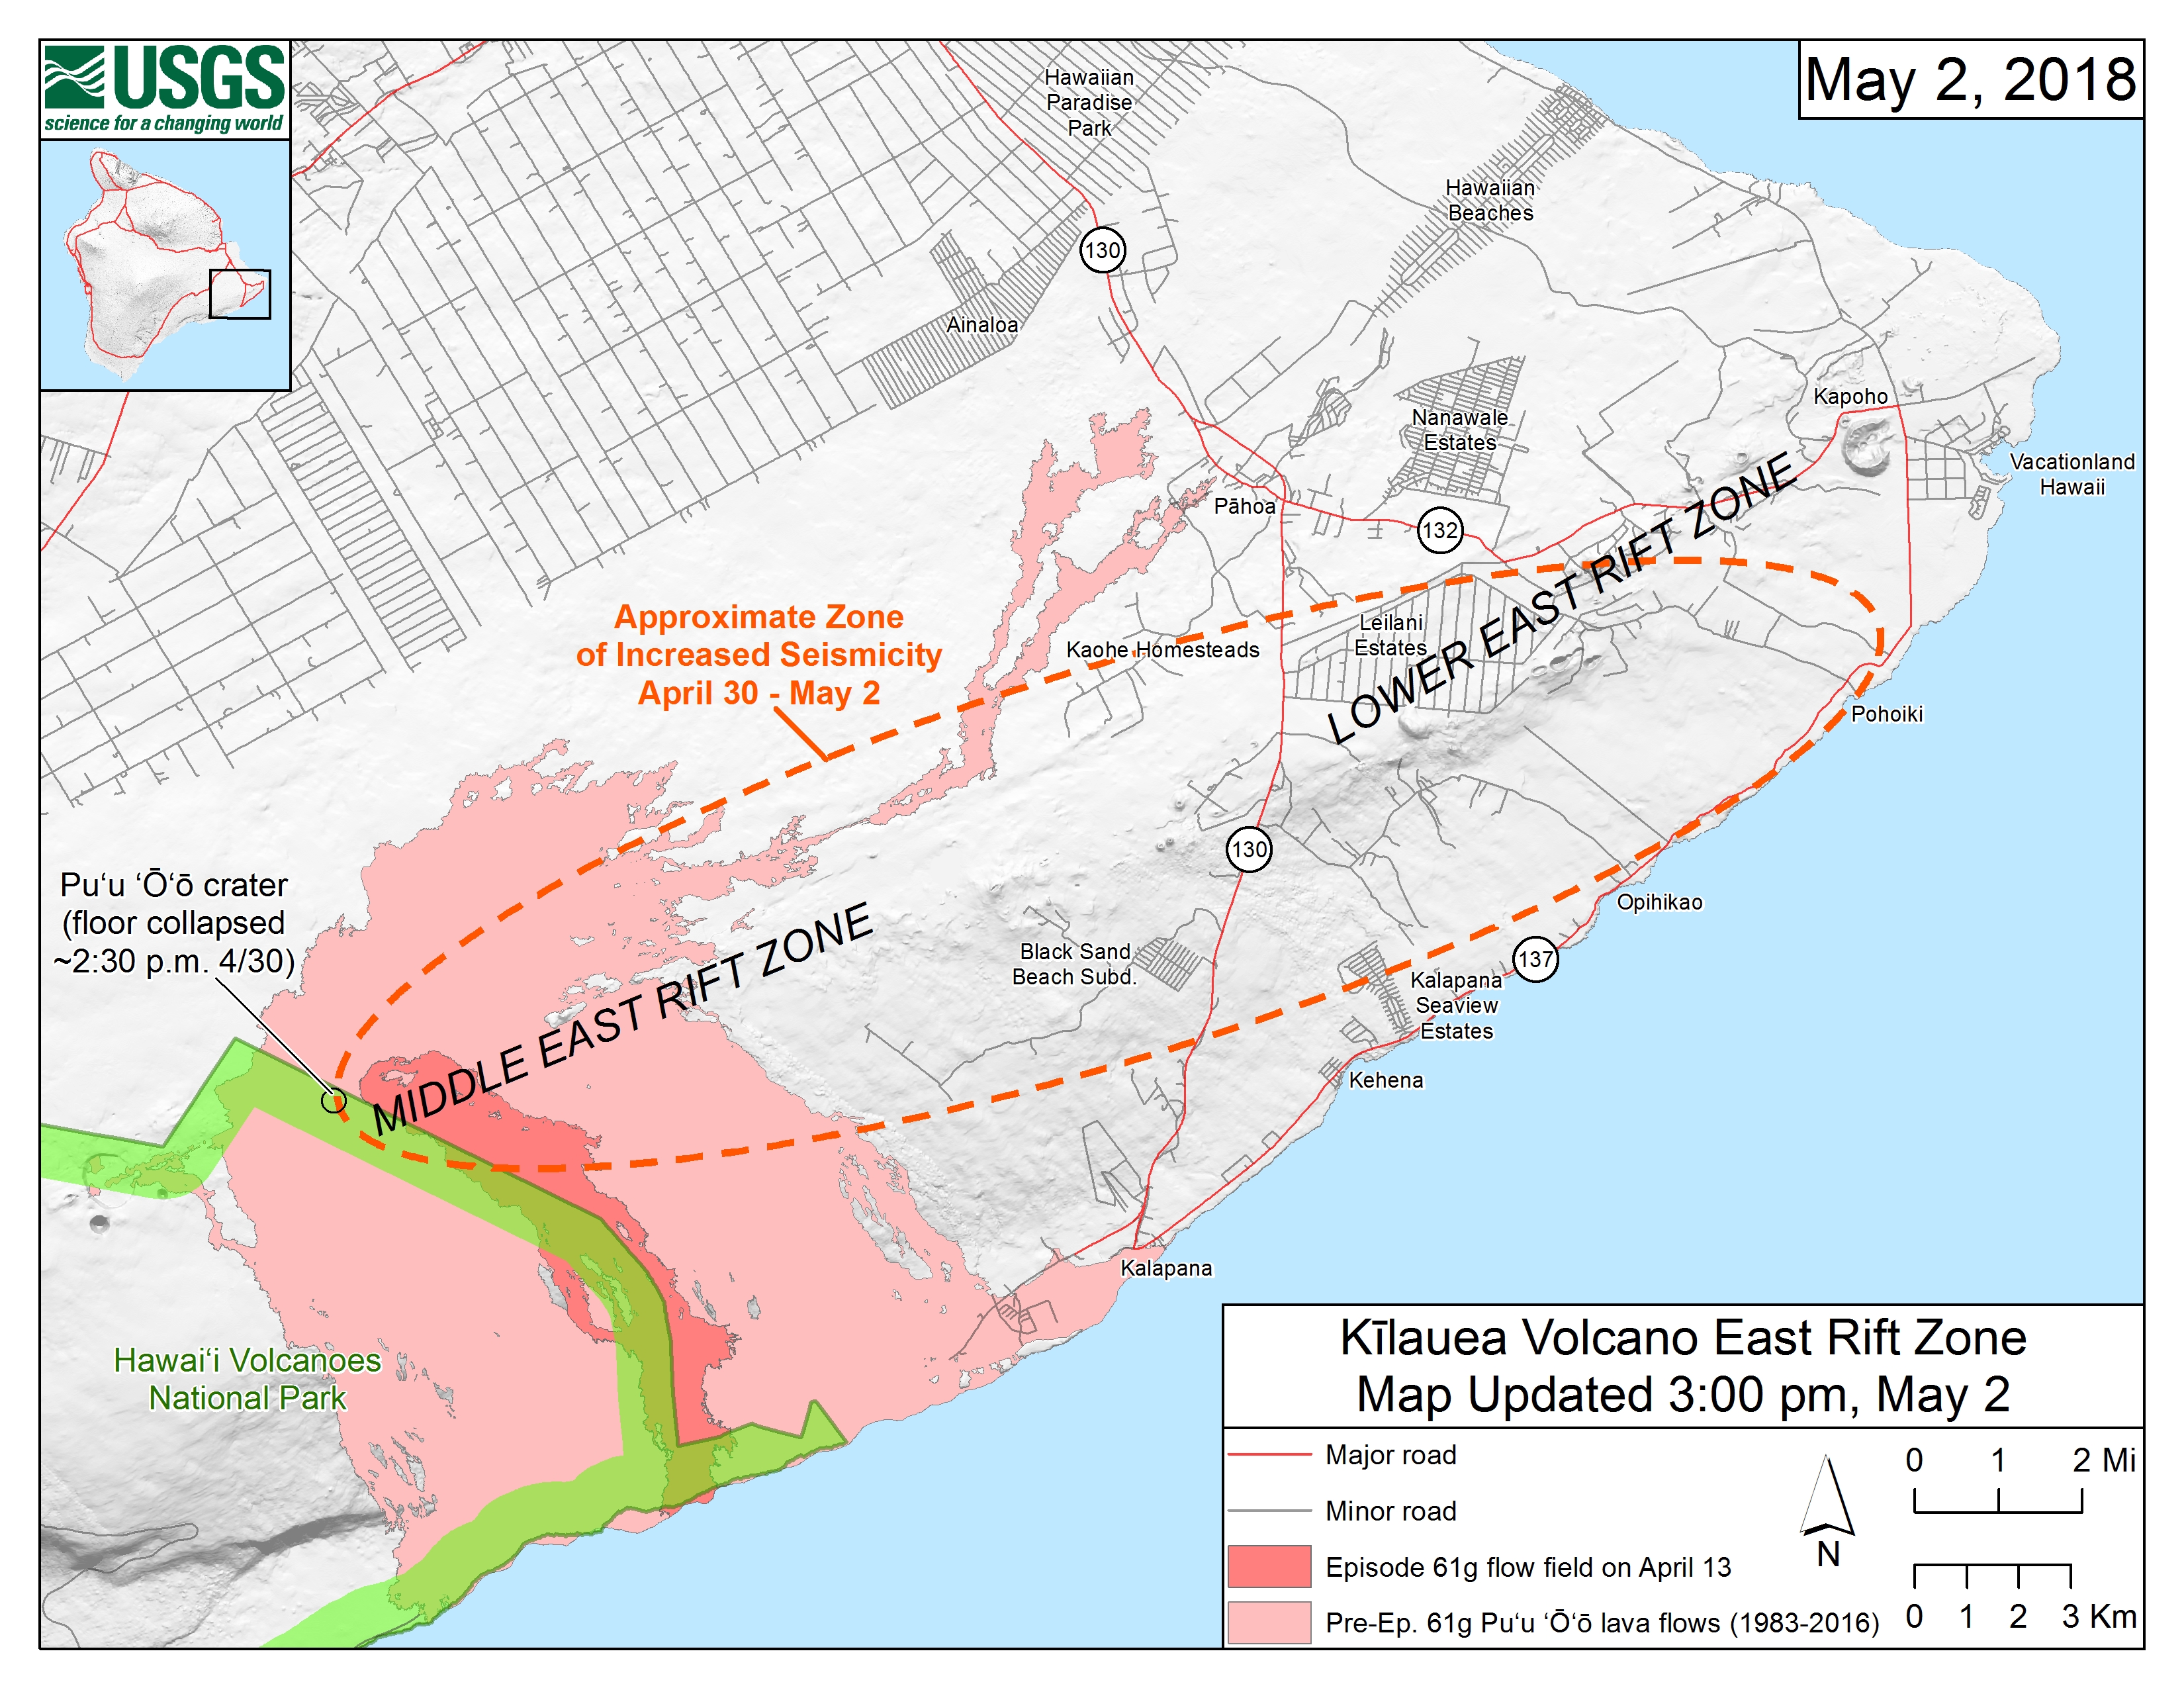
Map of ongoing intrusion and earthquake activity along Kīlauea’s East Rift Zone

Starting on the afternoon of Monday, April 30, 2018, magma beneath Pu‘u ‘Ō‘ō drained and triggered the collapse of the crater floor. Within hours, earthquakes began migrating east of Pu‘u ‘Ō‘ō, signaling an intrusion of magma along the middle and lower East Rift Zone. As of about noon on Wednesday, May 2, these earthquakes continue along the lower East Rift Zone, with many reports of earthquakes felt by residents in nearby subdivisions. The orange dashed line marks the approximate area within which most of the earthquakes are located based on automatic earthquake locations and analysis by seismologists. All earthquake locations are preliminary. For more details on the hazards associated with this ongoing event, see this link: https://volcanoes.usgs.gov/volcanoes/kilauea/status.html (see large map)

May 1, 2018


April 30th, 2018, Pu‘u ‘Ō‘ō crack

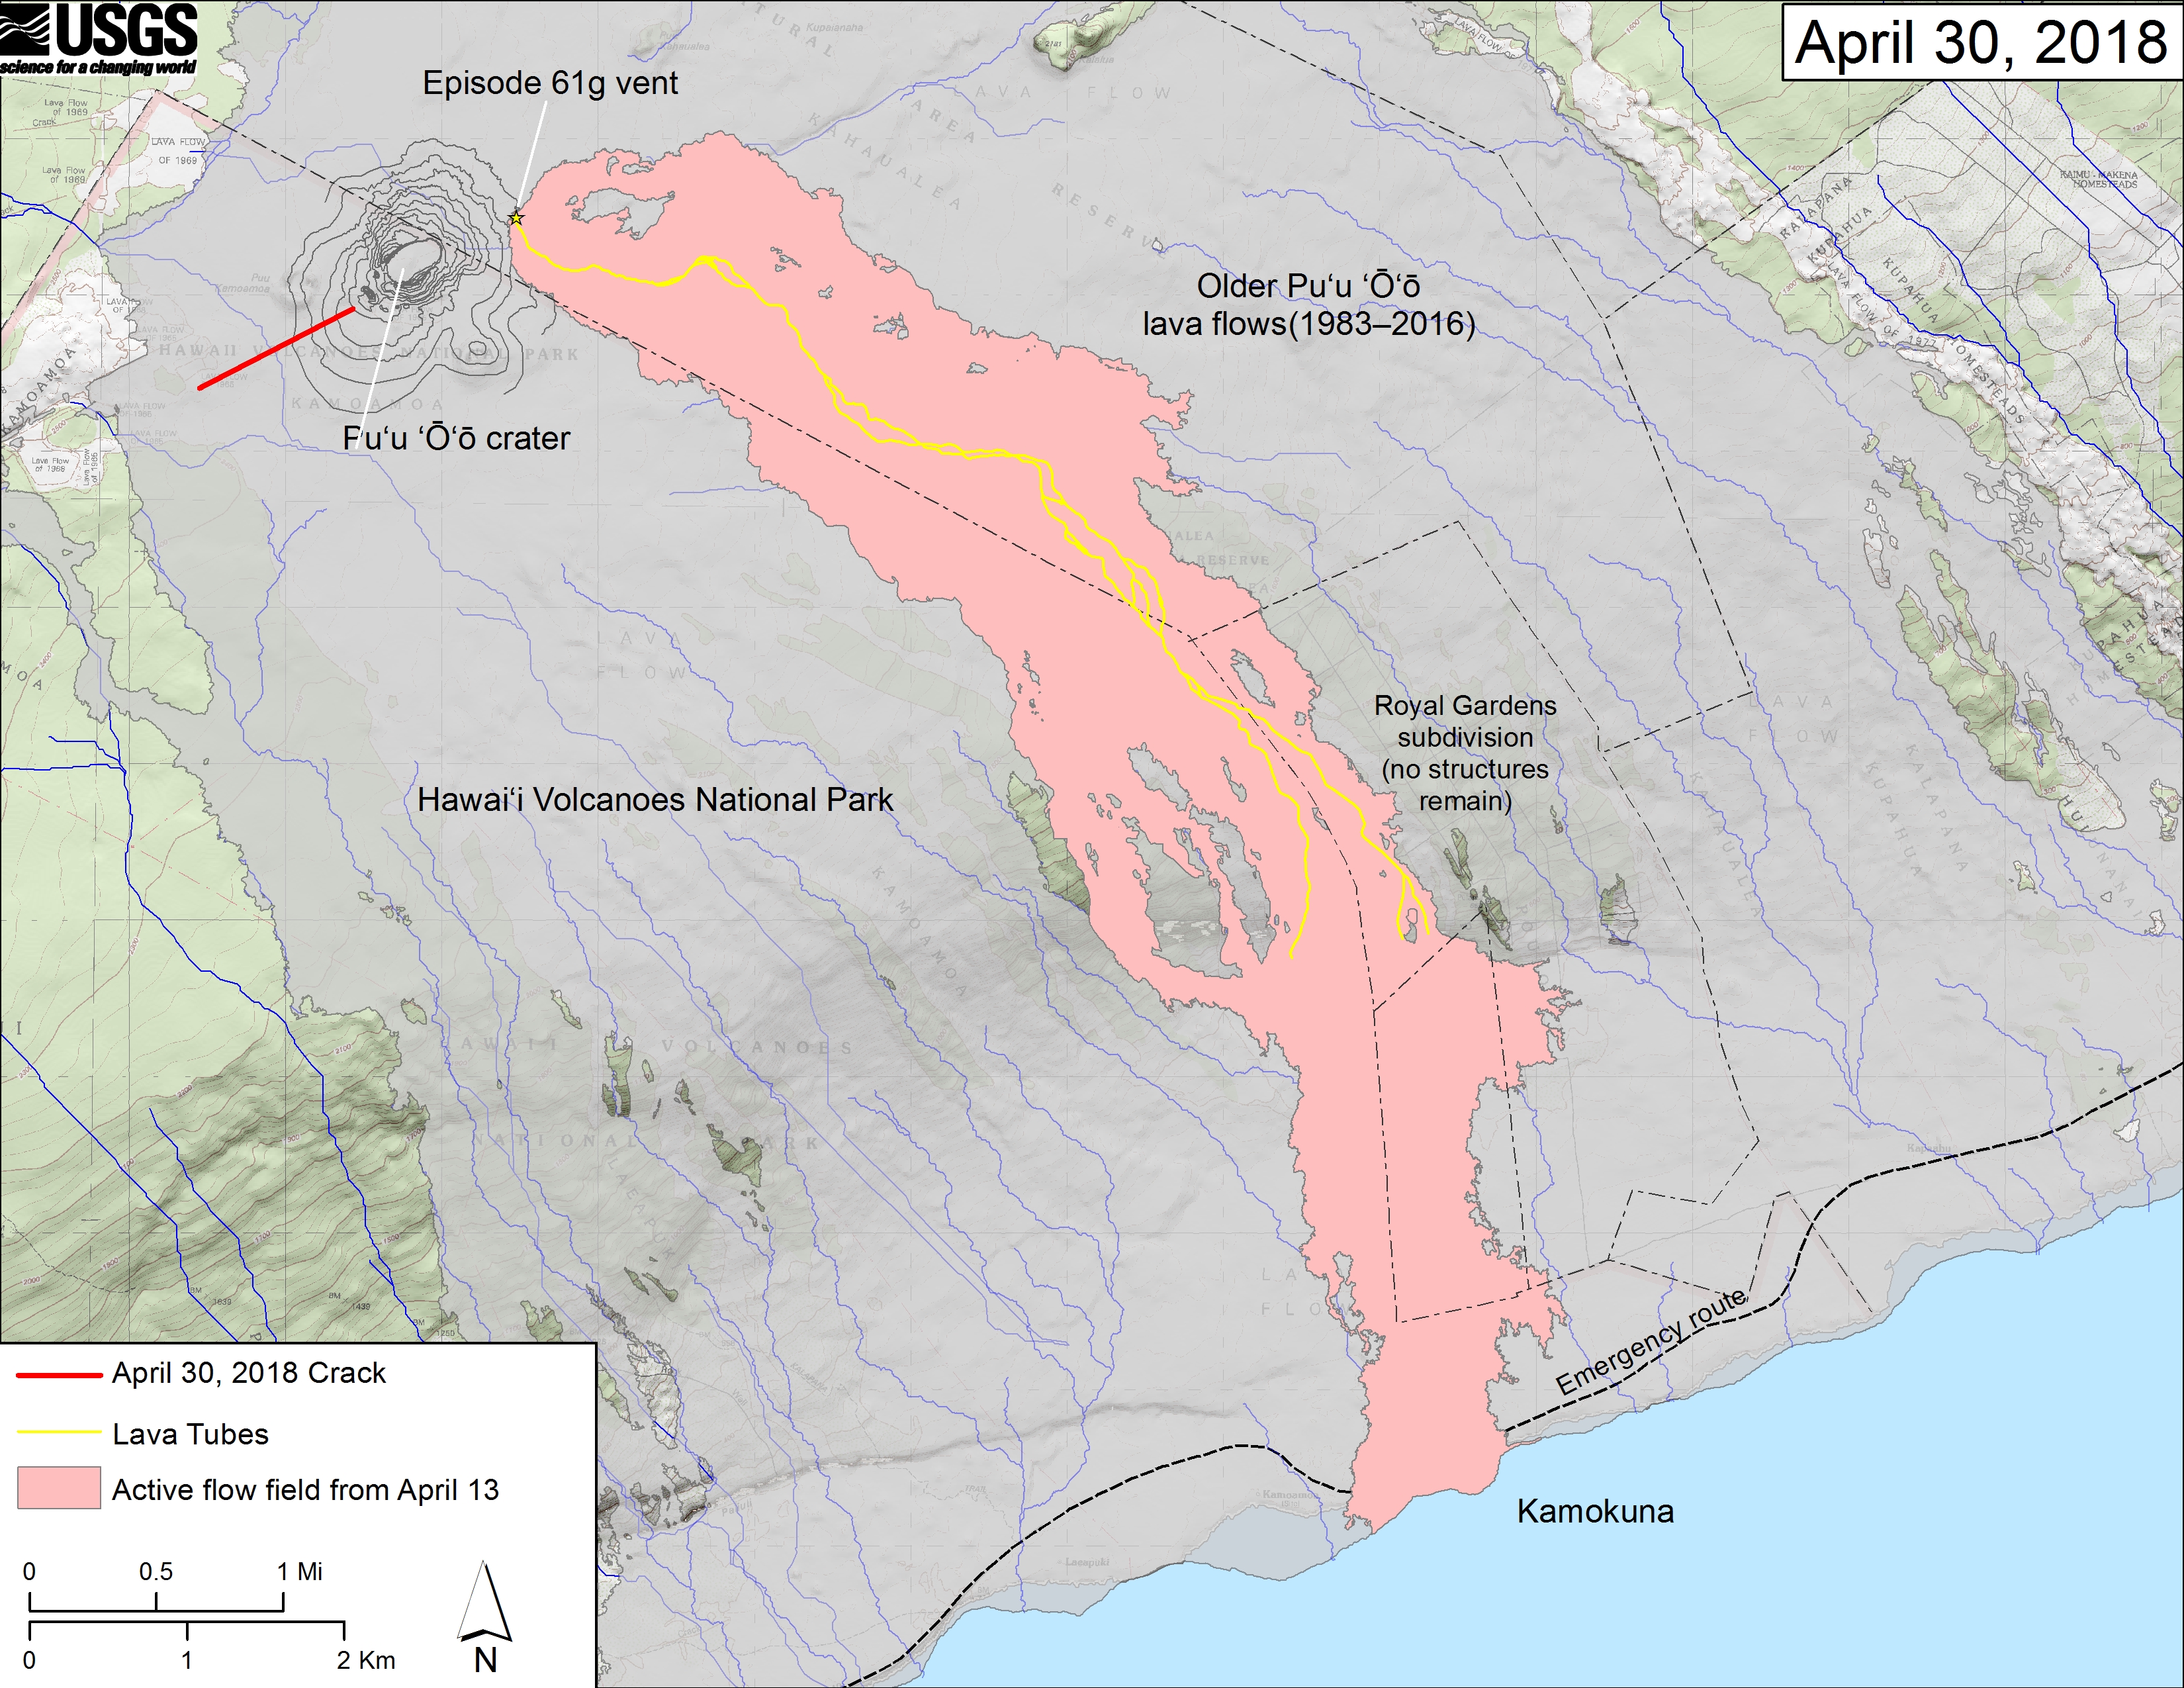
This map shows recent changes to Kīlauea’s East Rift Zone lava flow field and Pu‘u ‘Ō‘ō cone. The 61g flow field, as of April 13, 2018, is shown in pink. The crack that formed on the west side of Pu‘u ‘Ō‘ō on April 30th, 2018, during or immediately after the crater floor collapse is shown as a solid red line. Older Pu‘u ‘Ō‘ō lava flows (1983–2016) are shown in gray. The yellow line is the trace of the active lava tubes. The Kamokuna ocean entry is inactive. The blue lines over the Pu‘u ‘Ō‘ō flow field are steepest-descent paths calculated from a 2013 digital elevation model (DEM), while the blue lines on the rest of the map are steepest-descent paths calculated from a 1983 DEM (for calculation details, see http://pubs.usgs.gov/of/2007/1264/). Steepest-descent path analysis is based on the assumption that the DEM perfectly represents the earth’s surface. DEMs, however, are not perfect, so the blue lines on this map can be used to infer only approximate flow paths. The base map is a partly transparent 1:24,000-scale USGS digital topographic map draped over the 1983 10-m digital elevation model (DEM). (see large map) (see large map) (see large map) (see large map)


The 2016 Earthquake in Ecuador and the Zika Outbreak

The 2016 Earthquake in Ecuador: Zika Outbreak After a Natural Disaster
Diana Pacheco Barzallo, Andrea Pacheco Barzallo, and Eulalia Narvaez

Health Security, Vol. 16, No. 2, April 2018: 127-134.]

“……Our results suggest that the earthquake increased the reported cases of Zika by 0.509 per epidemiologic week (data per 10,000 population), and we argue that the destroyed built environment along with other factors created a disease focus, where the virus spread easily. Because of its potential complications and devastating long-term effects, Zika represents a national threat……”


Categories

Recent Posts

Archives

Admin