Archive for the ‘Fires/Wildfires’ Category
Wildfires across Kansas have led to evacuations and are threatening at least 2 communities.
Wednesday, April 6th, 20163/25/1911: The Triangle Shirtwaist Company factory in New York City burns down, killing 145 workers, mostly immigrants
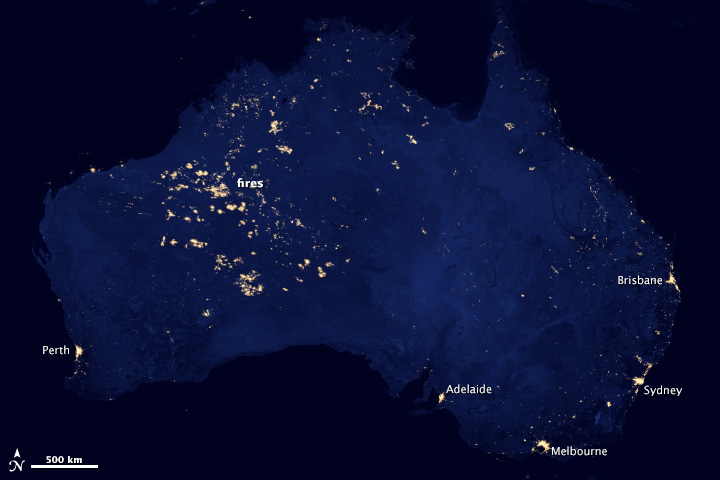
Friday, March 25th, 2016An major bushfire in western Australia destroyed nearly 100 homes and left three people unaccounted for
Friday, January 8th, 2016China: Arson is suspected in a deadly bus fire that killed at least 17 and injured at least 30.
Wednesday, January 6th, 2016
Dubai: A 63-story luxury hotel engulfed in flames; 14 injured.
Friday, January 1st, 2016** not immediately clear what caused the fire;
Russia: At least 23 people have been killed and dozens left injured in a fire at a neurological hospital in the village of Alferovka
Sunday, December 13th, 2015https://www.youtube.com/watch?v=oJshT1OiJwQ
https://www.youtube.com/watch?v=klxQYpVL1SE
51 saved.
NASA: Fires Put a Carbon Monoxide Cloud over Indonesia
Sunday, December 13th, 2015
In September and October 2015, tens of thousands of fires sent clouds of toxic gas and particulate matter into the air over Indonesia. Despite the moist climate of tropical Asia, fire is not unusual during those months. For the past few decades, people have used fire to clear land for farming and to burn away leftover crop debris. What was unusual in 2015 was how many fires burned and how many escaped their handlers and went uncontrolled for weeks and even months.
To study the fires, scientists in Indonesia and around the world have been using many different tools—from sensors on the ground to data collected by satellites. The goal is to better understand why the fires became so severe, how they are affecting human health and the atmosphere, and what can be done to prepare for similar surges in fire activity in the future.
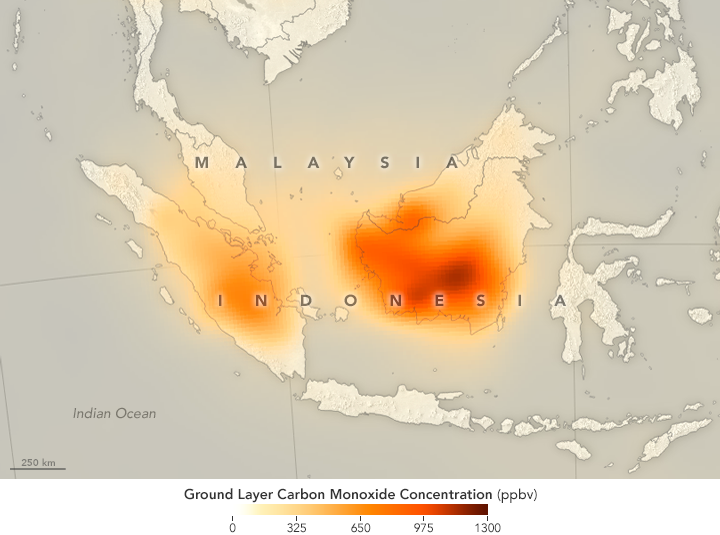
While some NASA satellite instruments captured natural-color images of the smoky pall, others focused on gases that are invisible to human eyes. For instance, the Measurement of Pollution in the Troposphere (MOPITT) sensor on Terra can detect carbon monoxide, an odorless, colorless, and poisonous gas. As shown by the map above, the concentration of carbon monoxide near the surface was remarkably high in September 2015 over Sumatra and Kalimantan.
“The 2015 Indonesian fires produced some of the highest concentrations of carbon monoxide that we have ever seen with MOPITT,” said Helen Worden, a scientist at the National Center for Atmospheric Research. Average carbon monoxide concentrations over Indonesia are usually about 100 parts per billion. In some parts of Borneo in 2015, MOPITT measured carbon monoxide concentrations at the surface up to nearly 1,300 parts per billion.
While all types of wildfires emit carbon monoxide as part of he combustion process, the fires in Indonesia released large amounts of the gas because in many cases the fuel burning was peat, a soil-like mixture of partly decayed plant material that builds up in wetlands, swamps, and partly submerged landscapes.
Read more about studies of Indonesia’s fire season in our new feature: Seeing Through the Smoky Pall.
NASA Earth Observatory map by Joshua Stevens and Jesse Allen, using data from the MOPITT Teams at the National Center for Atmospheric Research and the University of Toronto. Caption by Adam Voiland.
- Instrument(s):
- Terra – MOPITT
In September and October 2015, tens of thousands of fires sent clouds of toxic gas and particulate matter into the air over Indonesia.
Friday, December 11th, 2015In September and October 2015, tens of thousands of fires sent clouds of toxic gas and particulate matter into the air over Indonesia. Despite the moist climate of tropical Asia, fire is not unusual during those months. For the past few decades, people have used fire to clear land for farming and to burn away leftover crop debris. What was unusual in 2015 was how many fires burned and how many escaped their handlers and went uncontrolled for weeks and even months.
To study the fires, scientists in Indonesia and around the world have been using many different tools—from sensors on the ground to data collected by satellites. The goal is to better understand why the fires became so severe, how they are affecting human health and the atmosphere, and what can be done to prepare for similar surges in fire activity in the future.
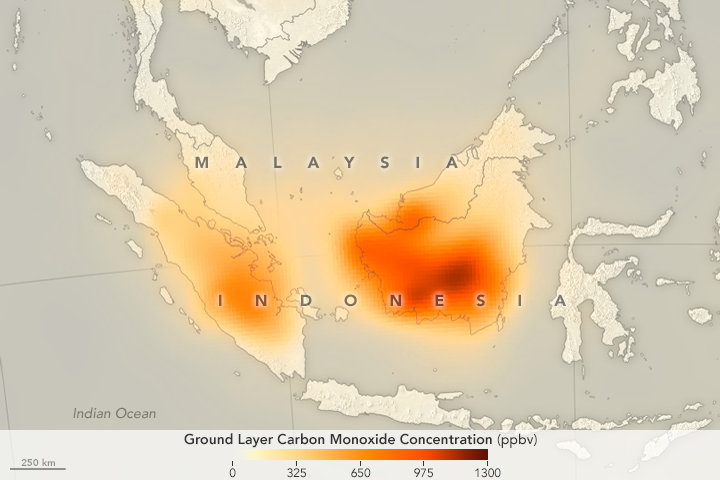
While some NASA satellite instruments captured natural-color images of the smoky pall, others focused on gases that are invisible to human eyes. For instance, the Measurement of Pollution in the Troposphere (MOPITT) sensor on Terra can detect carbon monoxide, an odorless, colorless, and poisonous gas. As shown by the map above, the concentration of carbon monoxide near the surface was remarkably high in September 2015 over Sumatra and Kalimantan.
“The 2015 Indonesian fires produced some of the highest concentrations of carbon monoxide that we have ever seen with MOPITT,” said Helen Worden, a scientist at the National Center for Atmospheric Research. Average carbon monoxide concentrations over Indonesia are usually about 100 parts per billion. In some parts of Borneo in 2015, MOPITT measured carbon monoxide concentrations at the surface up to nearly 1,300 parts per billion.
While all types of wildfires emit carbon monoxide as part of he combustion process, the fires in Indonesia released large amounts of the gas because in many cases the fuel burning was peat, a soil-like mixture of partly decayed plant material that builds up in wetlands, swamps, and partly submerged landscapes.
Read more about studies of Indonesia’s fire season in our new feature: Seeing Through the Smoky Pall.
NASA Earth Observatory map by Joshua Stevens and Jesse Allen, using data from the MOPITT Teams at the National Center for Atmospheric Research and the University of Toronto. Caption by Adam Voiland.
- Instrument(s):
- Terra – MOPITT


