Archive for the ‘Fires/Wildfires’ Category
The Camp Fire’s death toll has increased to 88, with 203 remain missing
Tuesday, November 27th, 2018“……The wildfire, the deadliest and most destructive in California’s history, was contained on Sunday after burning for 17 days. It ravaged 153,336 acres (240 square miles). …..”
11/18/1987: A fire in King’s Cross underground station kills 30 commuters and injures scores of others.
Sunday, November 18th, 2018https://www.youtube.com/watch?v=sj21xNbNKBQ
San Francisco’s air quality index hits 271
Saturday, November 17th, 2018Here’s the full list, with each city’s Fine particulate matter (PM2.5) reading within the last hour (11/16/18):
1. Stockton, CA (157.4)
2. San Francisco, CA (137.9)
3. Oakland, CA (135.6)
4. Patna, India (132.6)
5. Sacramento, CA (129.4)
6. Varanasi, India (116.2)
7. Muzaffarpur, India (114.7)
8. San Jose, CA (113.4)
9. Turpan, China (109.2)
10. Darbhanga, India (106.4)
The list of people who are unaccounted for as a result of the Camp Fire in Northern California has 1,011 entries.
Saturday, November 17th, 201842 deaths & 200 missing: Camp Fire becomes deadliest in California’s history
Tuesday, November 13th, 2018“…..The Camp Fire, which decimated Paradise, has already burned about 117,000 acres and is only about 30 percent contained.….”
NASA: Wildfire Smoke Moving from California to the Rest of the USA
Monday, November 12th, 2018By the time the U.S. Forest Service declared the Mendocino Complex Fire 100 percent contained in mid-September 2018, it had burned for nearly two months, destroyed 157 homes, and scorched more than 459,000 acres, making it the largest wildfire in California history. Wildfires in the state burned more than 1.3 million acres from January 1 through November 4, shrouding the region and, at times, whole swaths of the country, in smoke.
In the past, the behavior of such wildfires and their smoke plumes was notoriously difficult to forecast. “It was a challenge for the atmospheric models to know where a fire was, how active it was, and how much emissions it was putting into the atmosphere,” said Andy Edman, who oversees Western region wildfires for the National Weather Service. “It was sort of like having a family reunion. Most everyone is going to be acting normal, but wildfire behavior can be like your crazy uncle—erratic and difficult to predict.”
But a new experimental model that relies on data from National Oceanic and Atmospheric Administration (NOAA) and NASA satellites has proven remarkably good at simulating the behavior of wildfire smoke. The High-Resolution Rapid Refresh Smoke model, or HRRR-Smoke, builds on NOAA’s existing HRRR weather model, which forecasts rain, wind, and thunderstorms. It ingests real-time data from the Joint Polar Satellite System’s Suomi-NPP and NOAA-20 polar-orbiting satellites, as well as NASA’s Terra and Aqua satellites.
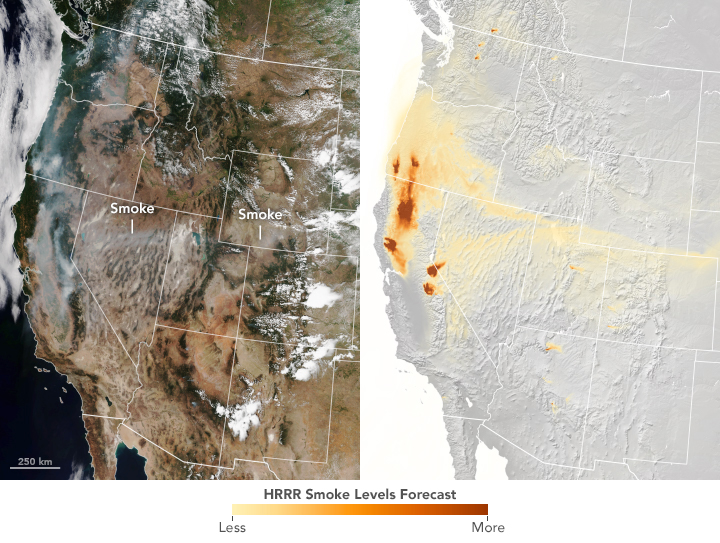
The image on the top left, captured by the Visible Infrared Imaging Radiometer Suite (VIIRS) on Suomi-NPP, shows the Western United States in natural color in the afternoon on August 6, 2018, at the height of the Mendocino Complex Fire. On the top right is a HRRR-Smoke simulation from the same region at the same time.
Central to HRRR-Smoke is an important metric called fire radiative power. FRP is a measurement of the amount of heat released by a given fire in megawatts. A large fire, for example, might reach about 4,000 megawatts per pixel (750×750 meters). Calculating radiative power and where it is distributed can help scientists pinpoint the active front of a fire and predict the density and trajectory of the smoke it will emit.
The HRRR-smoke model combines FRP data with observations of wind speed, rain, and atmospheric temperature. It also includes vegetation maps because the more scientists know about what is burning, the better the simulation. (For instance, sagebrush burns differently than ponderosa pine.) These measurements are mapped to a three-dimensional grid that extends nearly 16 miles into the atmosphere. What results is a detailed forecast of the amount of smoke produced, the direction it should travel, and its plume height. HRRR-Smoke generates forecasts four times per day and looks ahead by 36 hours.
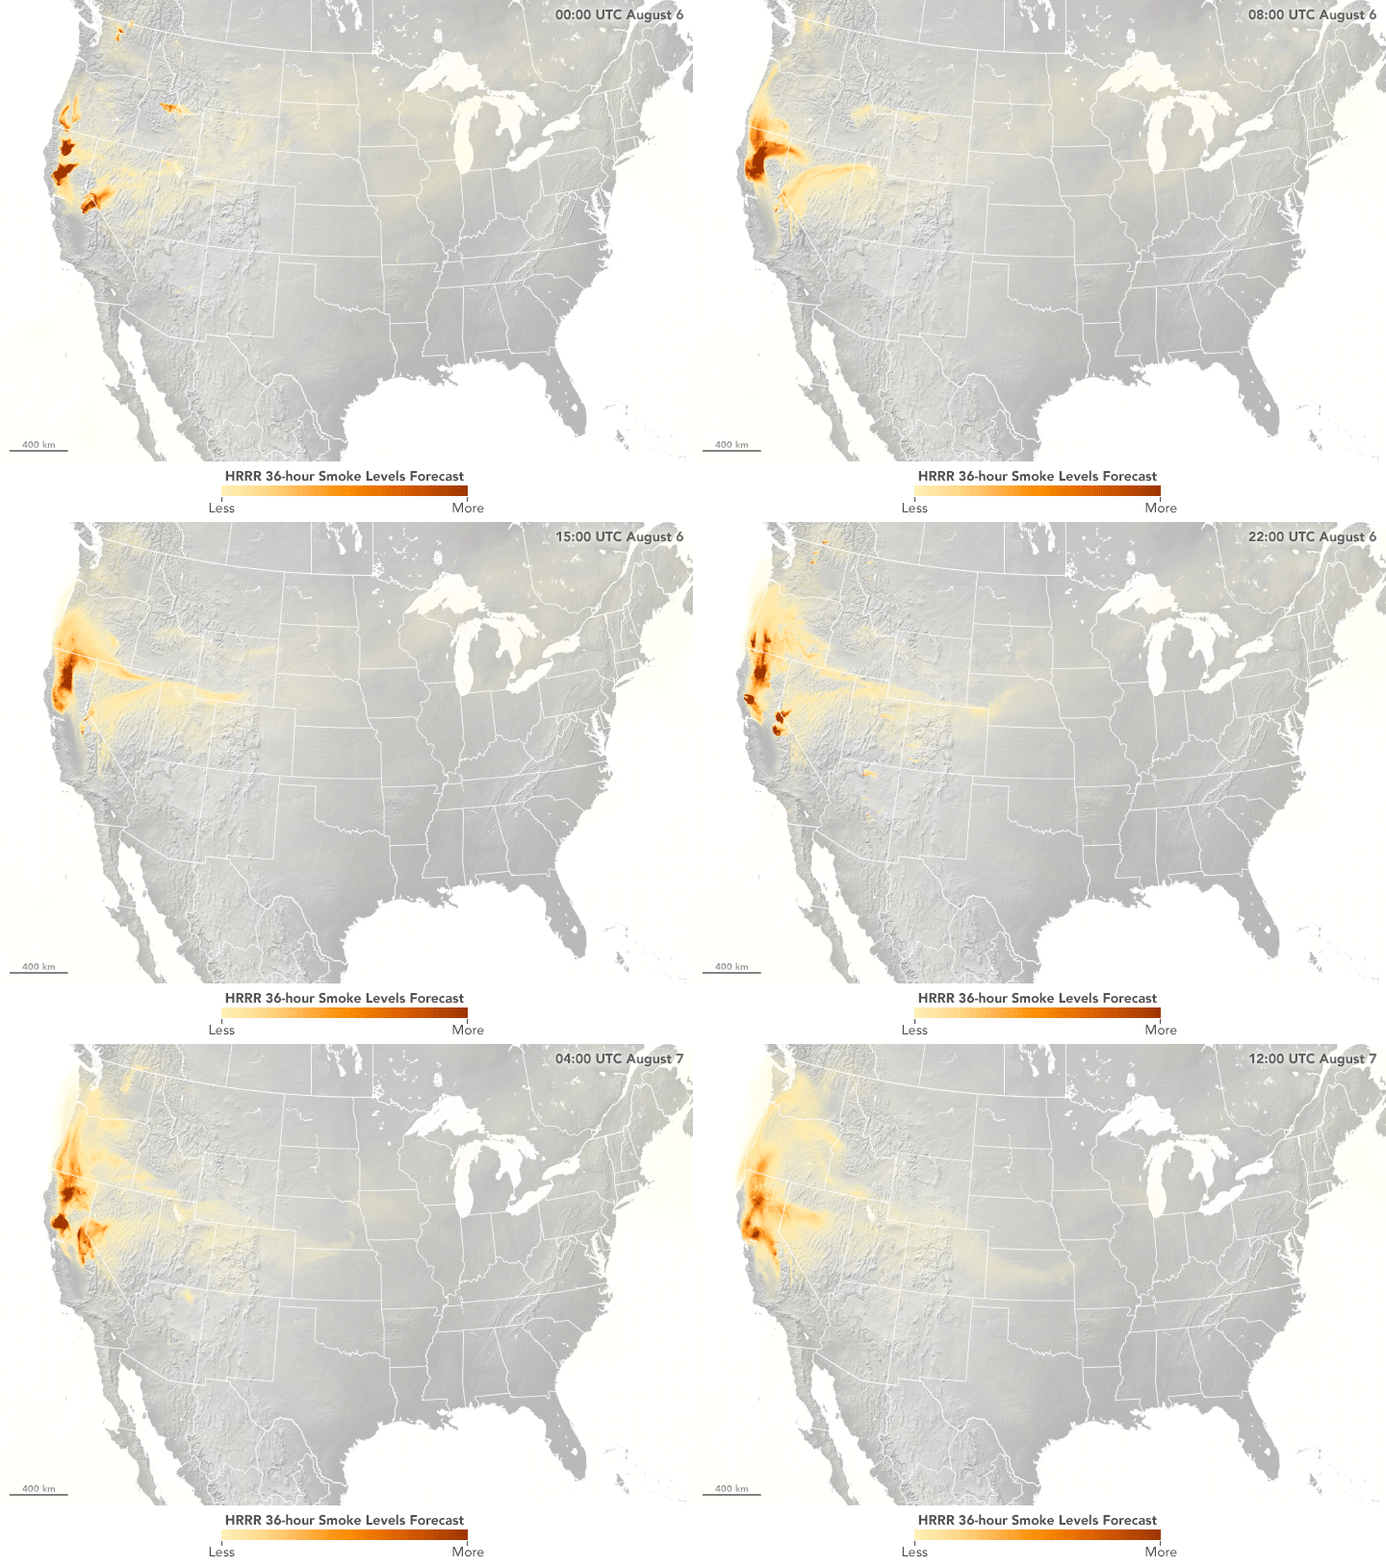
The forecasts include two key sets of predictions. “Near-surface smoke” refers to the smoke that will hover within 8 meters (26 feet) of the ground—the kind responsible for burning eyes and aggravated asthma. “Vertically integrated smoke” depicts all of the smoke in a vertical column, including smoke high in Earth’s atmosphere. That is the smoke you see at sunrise and sunset. The animation below shows a 36-hour forecast of vertically integrated smoke on August 6, 2018.

8/6-7/18
“Near-surface smoke is one indicator of air pollution, but the smoke could also be at much higher altitudes,” said Ravan Ahmadov, the main developer of the HRRR-smoke model, and a research scientist at NOAA’s Earth Systems Research Laboratory and the Cooperative Institute for Research in Environmental Sciences. “That’s important to know, because the smoke could affect visibility for aviation.” High-altitude smoke can also block incoming sunlight, which can cool air temperatures and interfere with solar energy production.
HRRR-Smoke is being used increasingly by forecasters and government agencies, but also by some local groups. During California’s Ferguson fire, the Department of Transportation used HRRR-Smoke simulations as part of its decision-making to suspend Amtrak rail service in the region. Likewise, the model was part of the National Park Service calculus when it closed parts of Yosemite.
On a local scale, schools in Utah referred to model forecasts when they opted to keep kids inside during recess and to cancel football games due to fires burning south of Provo. In Oregon, a youth swimming coach moved outdoor practice to an indoor pool after hearing the forecast.
“When we can tell people that the smoke is going to move in and hang around for a day, they can take smart actions to anticipate the event,” Edman said. “If you have a child with asthma, you’ll know to take precautions.”
The HRRR-Smoke model is still evolving. One limitation, Ahmadov said, is that each polar orbiting satellite passes each location in the continental United States just twice a day, and fires can spread and evolve rapidly during the time between those observations. He hopes to eventually incorporate data from geostationary satellites like GOES-16 and GOES-17, which have a lower spatial resolution but would scan the fires more often. The ultimate goal is to add smoke to the regular HRRR model used by the National Weather Service.
“In the next couple of years, I think we are going to see a lot of small, incremental improvements,” Edman said. “The model is not perfect, but all of the components came together this year, and the forecasts were pretty darn good.”
NASA Earth Observatory images by Lauren Dauphin, using VIIRS data from the Suomi National Polar-orbiting Partnership and HRRR-Smoke data. Story by Jenny Marder, Joint Polar Satellite System.
NASA: Camp Fire Photos from Space
Sunday, November 11th, 201811/8/18
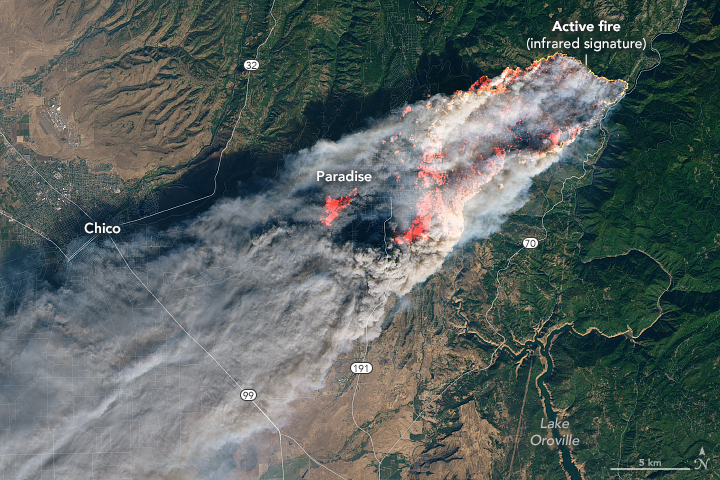
On November 8, 2018, the Camp Fire erupted 90 miles (140 kilometers) north of Sacramento, California. As of 10 a.m. Pacific Standard Time on November 9, the fire had consumed 70,000 acres of land and was five percent contained, or surrounded by a barrier.
The Operational Land Imager on Landsat 8 acquired this image on November 8, 2018, around 10:45 a.m. local time (18:45 Universal Time). The image was created using Landsat bands 4-3-2 (visible light), along with shortwave-infrared light to highlight the active fire. The fire started around 6:30 a.m. Pacific Standard Time, and by 8:00 p.m., it had burned 20,000 acres of land.
11/9/18
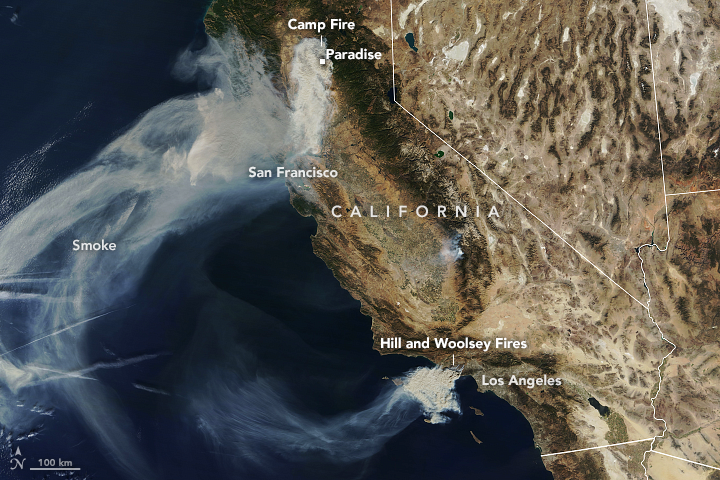
Strong winds pushed the fire to the south and southwest overnight, tripling its size and spreading smoke over the Sacramento Valley. The Moderate Resolution Imaging Spectrometer (MODIS) on NASA’s Terra satellite captured the natural-color image above on November 9. The High-Resolution Rapid Refresh Smoke model, using data from National Oceanic and Atmospheric Administration (NOAA) and NASA satellites, shows the smoke should continue to spread west. The image also shows two more fires in southern California, the Hill and Woolsey Fires.
More than 2,000 personnel have been sent to fight the Camp Fire, which is predicted to be fully contained by November 30. Firefighters are having difficulty containing it due to strong winds, which fan the flames and carry burning vegetation downwind. The area also has heavy and dry fuel loads, or flammable material.
State and local officials have closed several major highways, including portions of Highway 191. They also ordered evacuations in several towns, including Concow and Paradise, where the fatal fire burned through the town.
NASA Earth Observatory image by Joshua Stevens, using Landsat data from the U.S. Geological Survey, and MODIS data from NASA EOSDIS/LANCE and GIBS/Worldview. Story by Kasha Patel.
California wildfire: Death toll up to 23
Sunday, November 11th, 2018“……The Camp Fire burned down more than 6,700 homes and businesses in Paradise…..
Several of the bodies discovered earlier this week were found in or near burned out cars, police have said. The flames descended on Paradise so fast that many people were forced to abandon their vehicles and run for their lives down the sole road through the mountain town.
An additional 35 people have been reported missing and three firefighters have been injured……..”


