Archive for the ‘Influenza’ Category
2016-2017 Influenza Season Week 14 ending April 8, 2017
Saturday, April 15th, 2017Synopsis:
During week 14 (April 2-8, 2017), influenza activity decreased but remained elevated in the United States.
- Viral Surveillance: The most frequently identified influenza virus type reported by public health laboratories during week 14 was influenza B. The percentage of respiratory specimens testing positive for influenza in clinical laboratories decreased.
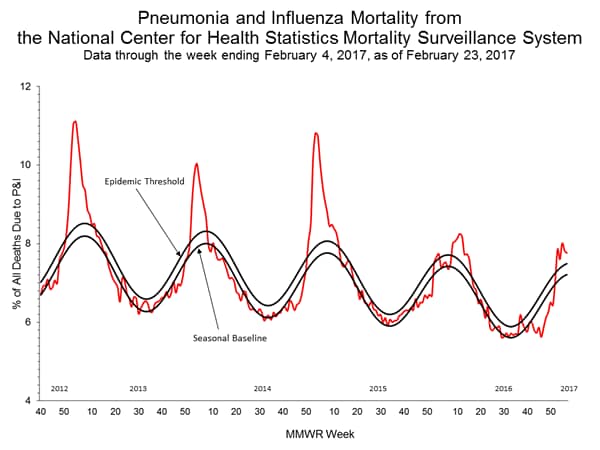
- Pneumonia and Influenza Mortality: The proportion of deaths attributed to pneumonia and influenza (P&I) was below the system-specific epidemic threshold in the National Center for Health Statistics (NCHS) Mortality Surveillance System.
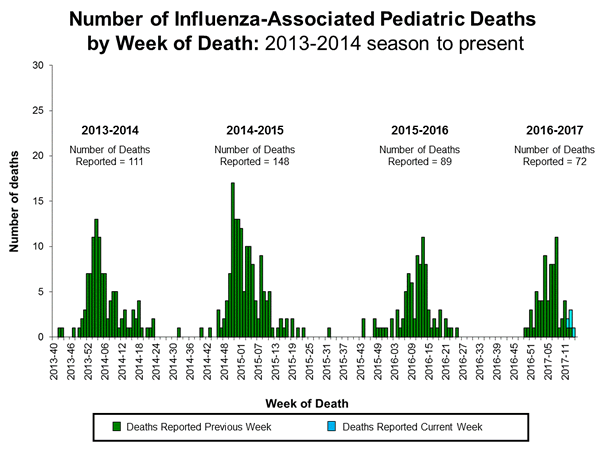
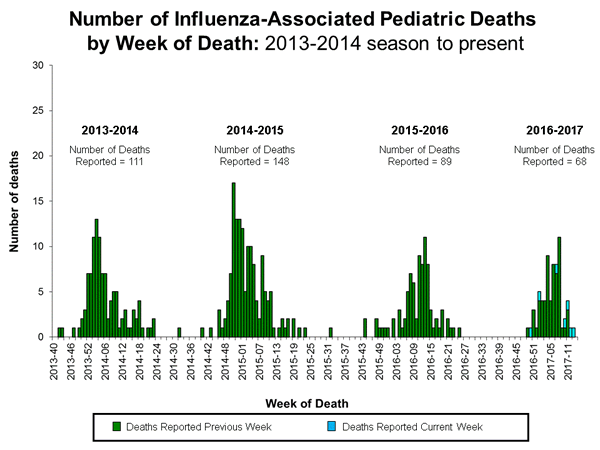
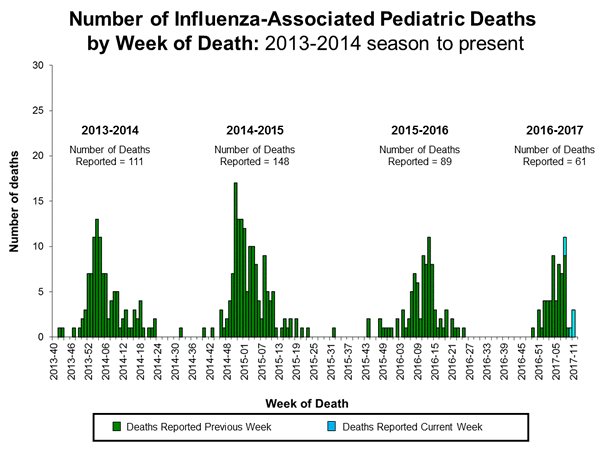
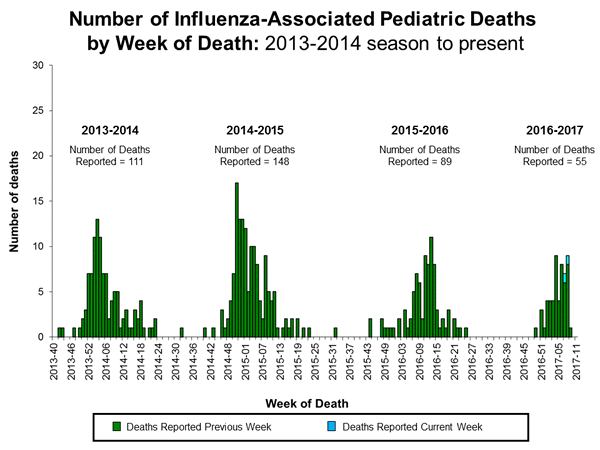
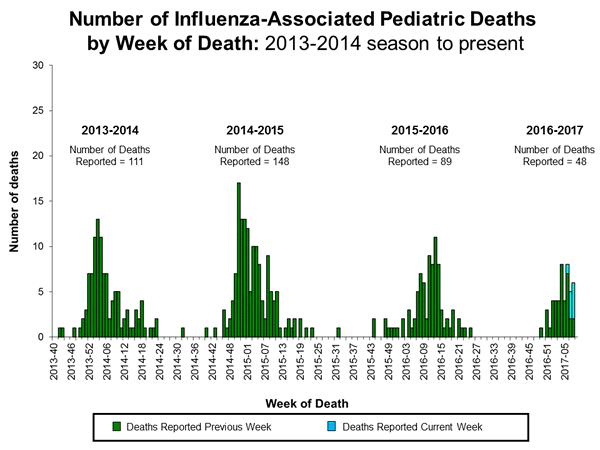
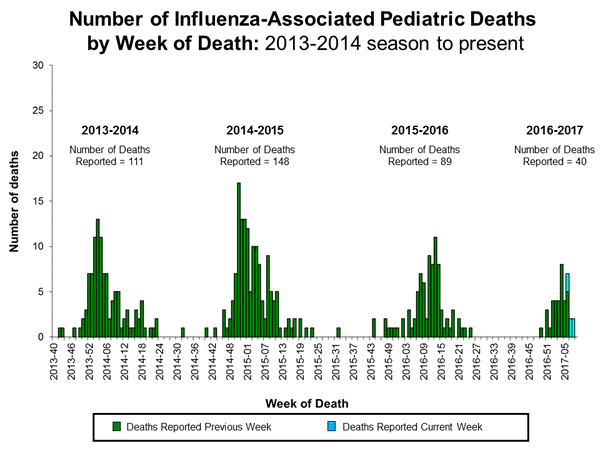
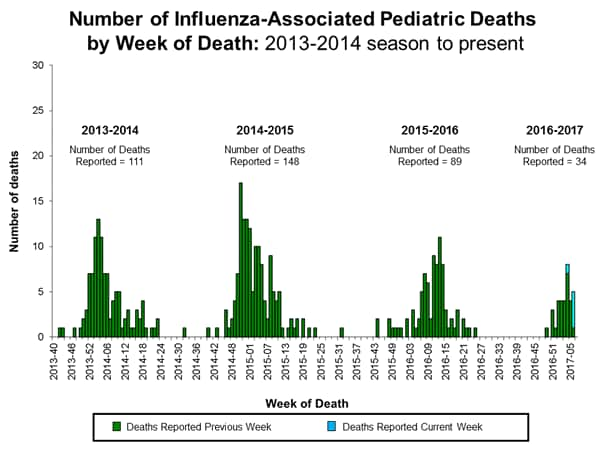
- Influenza-associated Pediatric Deaths: Five influenza-associated pediatric deaths were reported, four that occurred during the 2016-2017 season and one that occurred during the 2010-2011 season.
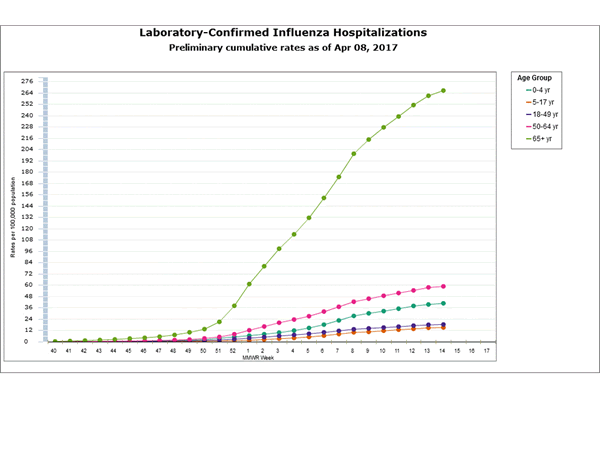
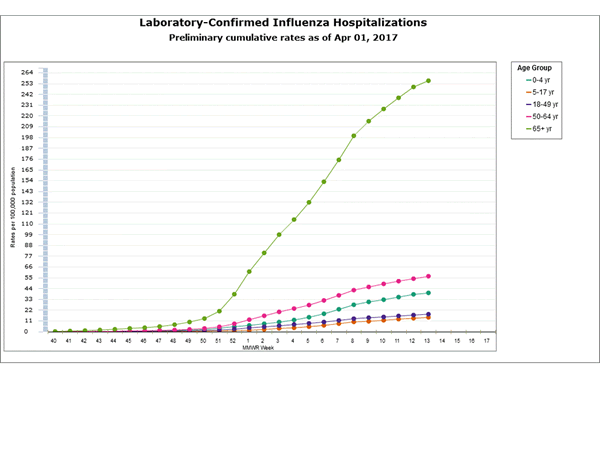
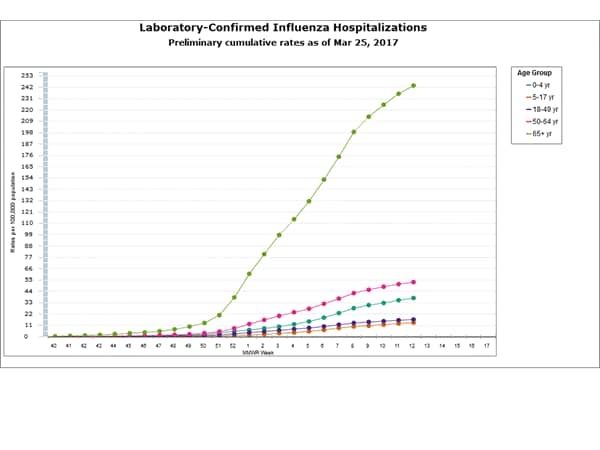
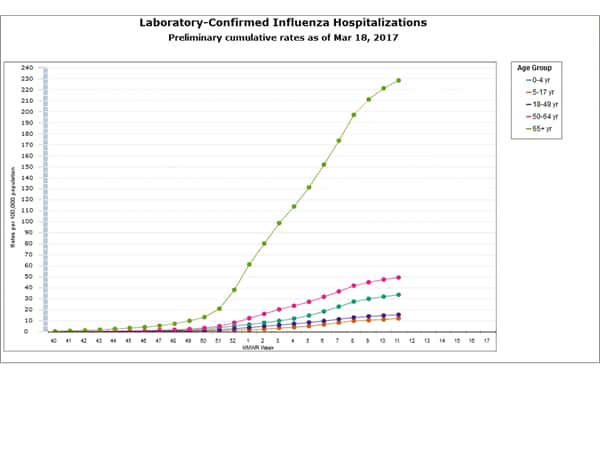
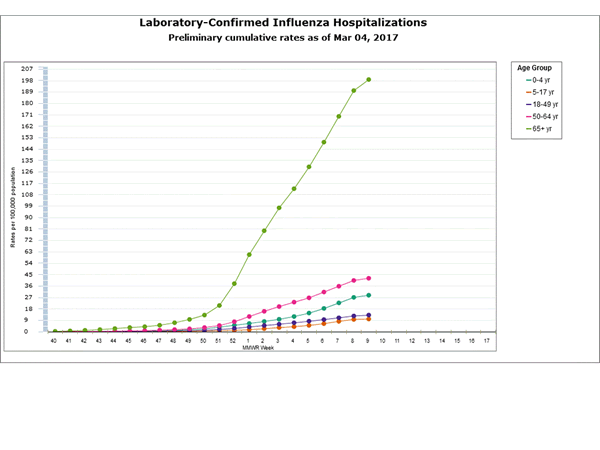
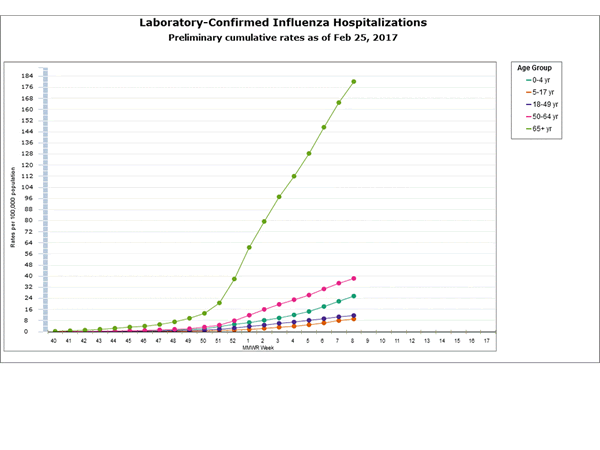
- Influenza-associated Hospitalizations: A cumulative rate for the season of 59.4 laboratory-confirmed influenza-associated hospitalizations per 100,000 population was reported.
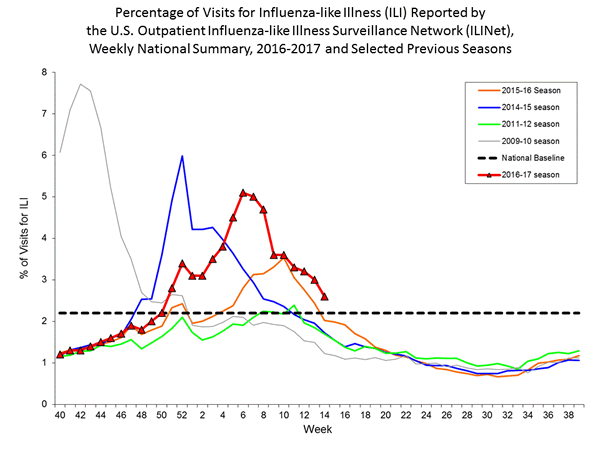
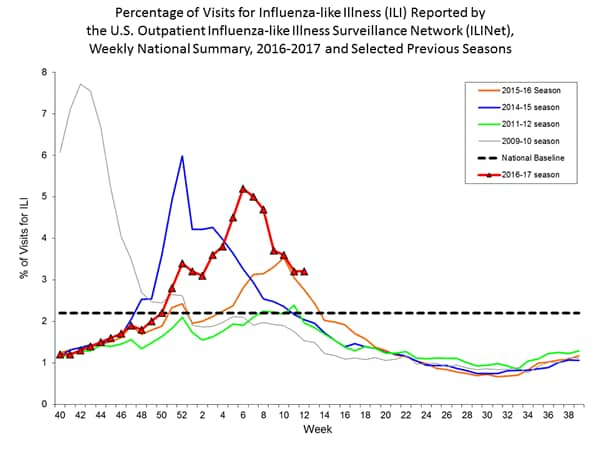
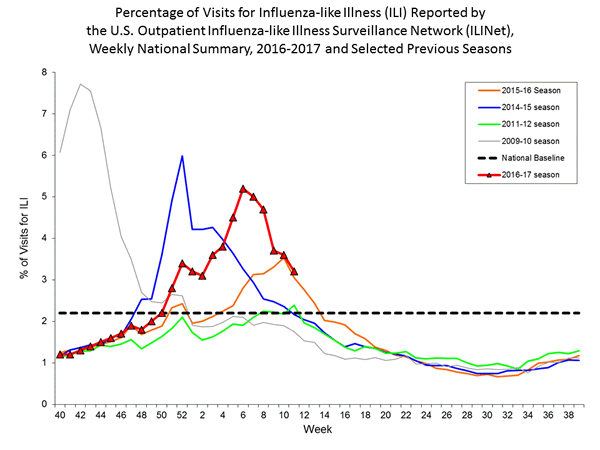
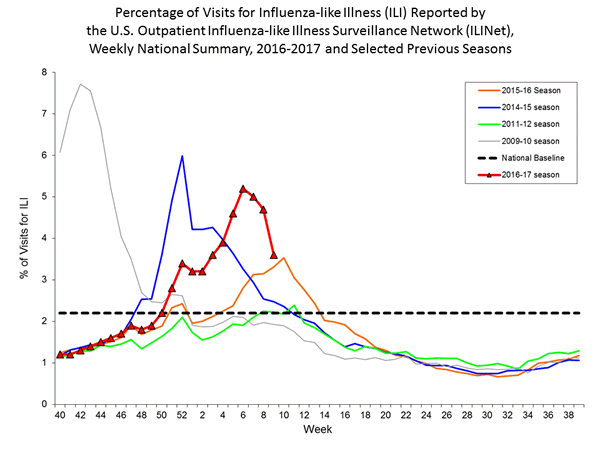
- Outpatient Illness Surveillance: The proportion of outpatient visits for influenza-like illness (ILI) was 2.6%, which is above the national baseline of 2.2%. Five of ten regions reported ILI at or above their region-specific baseline levels. Two states experienced high ILI activity; seven states experienced moderate ILI activity; New York City and 11 states experienced low ILI activity; Puerto Rico and 30 states experienced minimal ILI activity; and the District of Columbia had insufficient data.
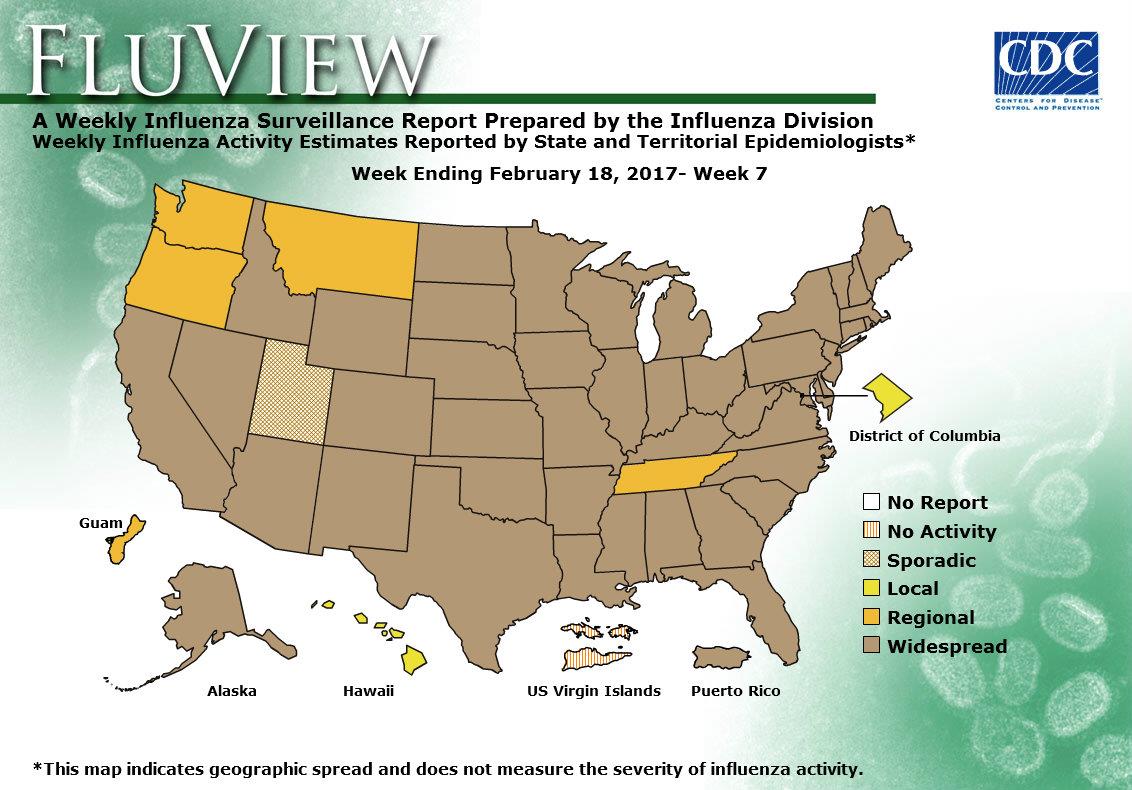
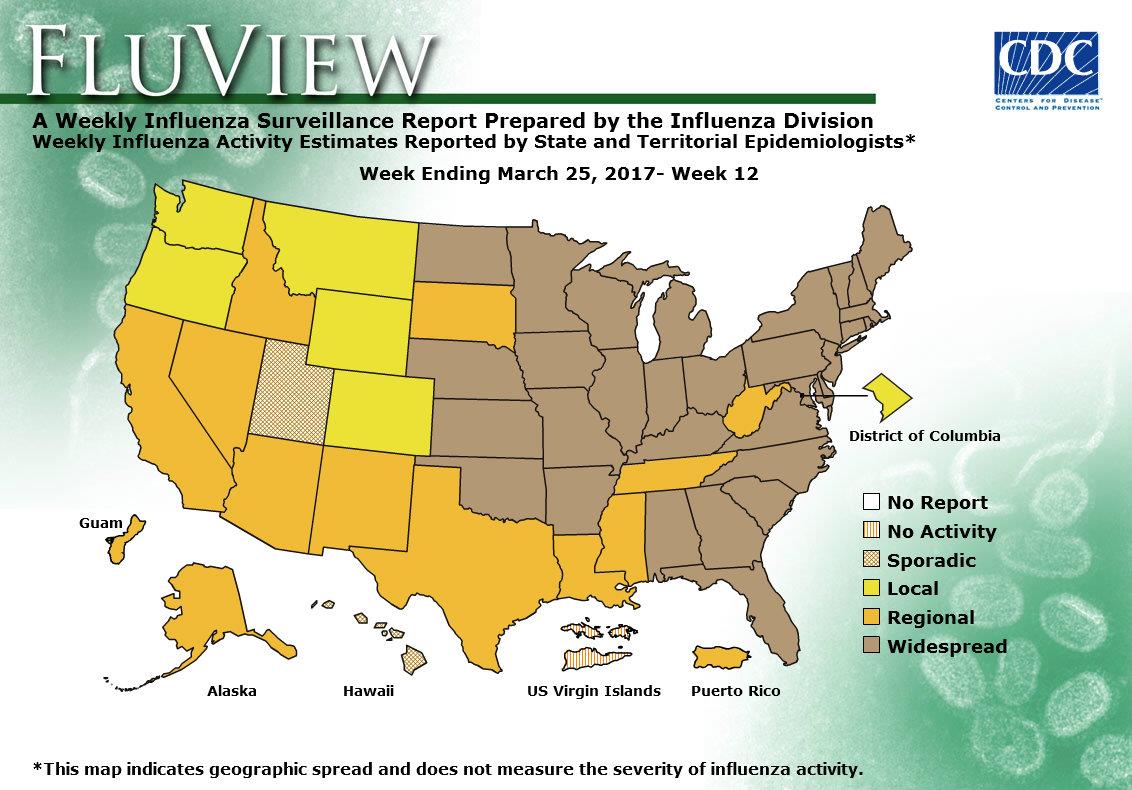
- Geographic Spread of Influenza: The geographic spread of influenza in 18 states was reported as widespread; Guam, Puerto Rico, and 18 states reported regional activity; the District of Columbia and 12 states reported local activity; two states reported sporadic activity; and the U.S. Virgin Islands reported no activity.
2016-2017 Influenza Season Week 13 ending April 1, 2017
Saturday, April 8th, 2017CDC
All data are preliminary and may change as more reports are received.
Synopsis:
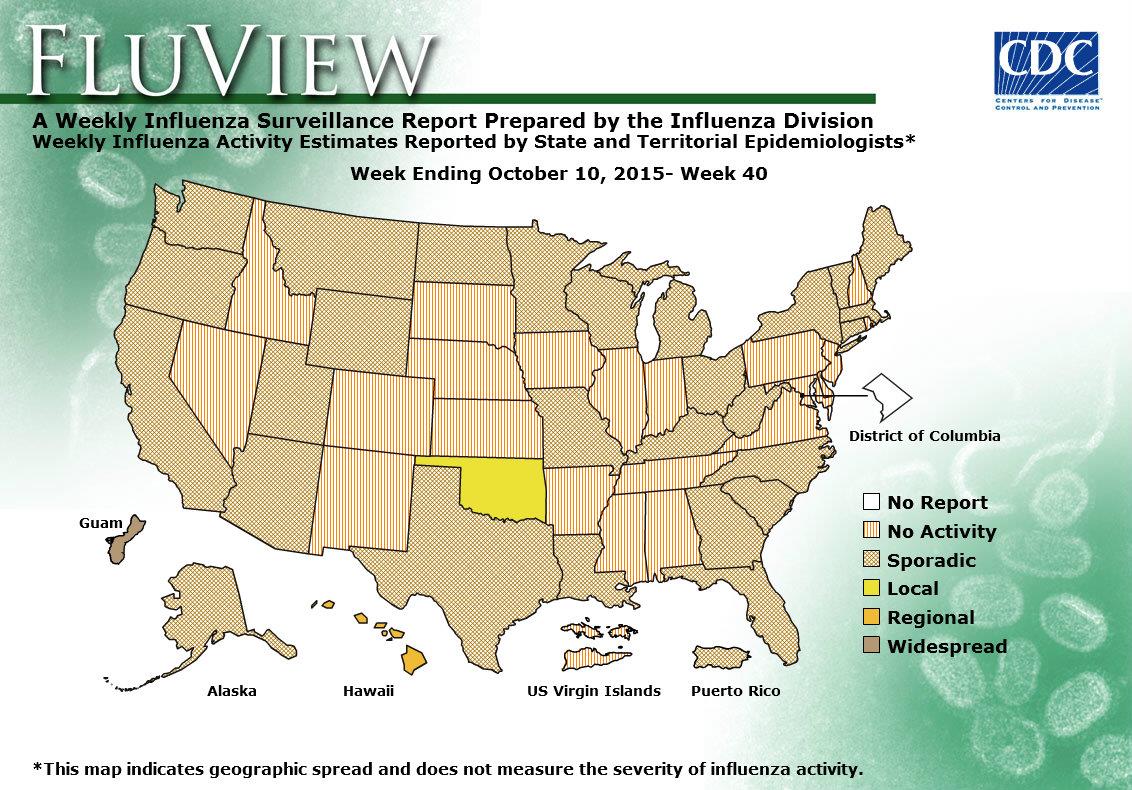
During week 13 (March 26-April 1, 2017), influenza activity decreased but remained elevated in the United States.
- Viral Surveillance: The most frequently identified influenza virus type reported by public health laboratories during week 13 was influenza B. The percentage of respiratory specimens testing positive for influenza in clinical laboratories decreased slightly.
- Pneumonia and Influenza Mortality: The proportion of deaths attributed to pneumonia and influenza (P&I) was below the system-specific epidemic threshold in the National Center for Health Statistics (NCHS) Mortality Surveillance System.
- Influenza-associated Pediatric Deaths: Seven influenza-associated pediatric deaths were reported.
- Influenza-associated Hospitalizations: A cumulative rate for the season of 57.2 laboratory-confirmed influenza-associated hospitalizations per 100,000 population was reported.
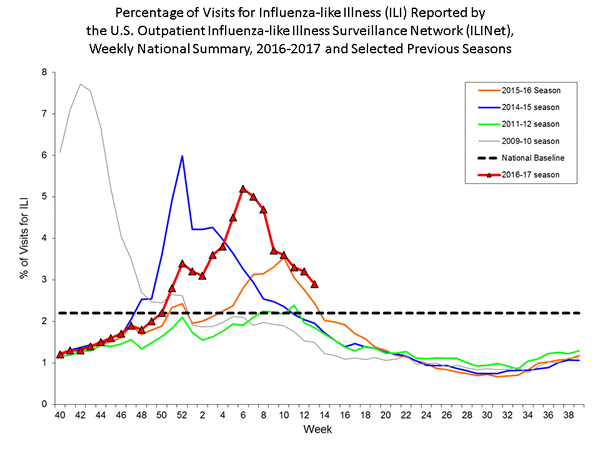
- Outpatient Illness Surveillance: The proportion of outpatient visits for influenza-like illness (ILI) was 2.9%, which is above the national baseline of 2.2%. Six of ten regions reported ILI at or above their region-specific baseline levels. Nine states experienced high ILI activity; five states experienced moderate ILI activity; New York City and nine states experienced low ILI activity; Puerto Rico and 27 states experienced minimal ILI activity; and the District of Columbia had insufficient data.
- Geographic Spread of Influenza: The geographic spread of influenza in 24 states was reported as widespread; Guam, Puerto Rico and 19 states reported regional activity; the District of Columbia and five states reported local activity; two states reported sporadic activity; and the U.S. Virgin Islands reported no activity.
Flu week 12 (March 19-25, 2017) in the United States.
Saturday, April 1st, 2017Synopsis:
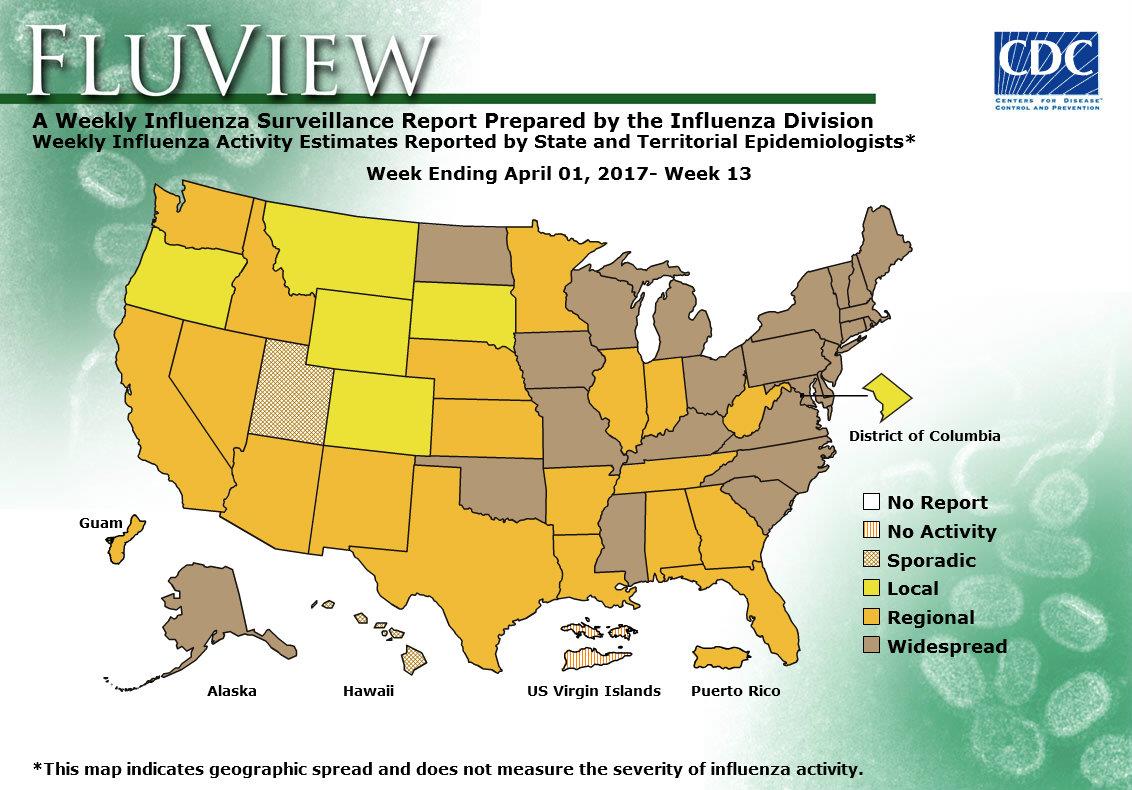
During week 12 (March 19-25, 2017), influenza activity remained elevated in the United States.
- Viral Surveillance: The most frequently identified influenza virus subtype reported by public health laboratories during week 12 was influenza A (H3). The percentage of respiratory specimens testing positive for influenza in clinical laboratories increased slightly.
- Pneumonia and Influenza Mortality: The proportion of deaths attributed to pneumonia and influenza (P&I) was above the system-specific epidemic threshold in the National Center for Health Statistics (NCHS) Mortality Surveillance System.
- Influenza-associated Pediatric Deaths: Six influenza-associated pediatric deaths were reported.
- Influenza-associated Hospitalizations: A cumulative rate for the season of 54.1 laboratory-confirmed influenza-associated hospitalizations per 100,000 population was reported.
- Outpatient Illness Surveillance: The proportion of outpatient visits for influenza-like illness (ILI) was 3.2%, which is above the national baseline of 2.2%. Eight of ten regions reported ILI at or above their region-specific baseline levels. 10 states experienced high ILI activity; eight states experienced moderate ILI activity; eight states experienced low ILI activity; New York City, Puerto Rico, and 24 states experienced minimal ILI activity; and the District of Columbia had insufficient data.
- Geographic Spread of Influenza: The geographic spread of influenza in 31 states was reported as widespread; Guam, Puerto Rico and 12 states reported regional activity; the District of Columbia and five states reported local activity; two states reported sporadic activity; and the U.S. Virgin Islands reported no activity.
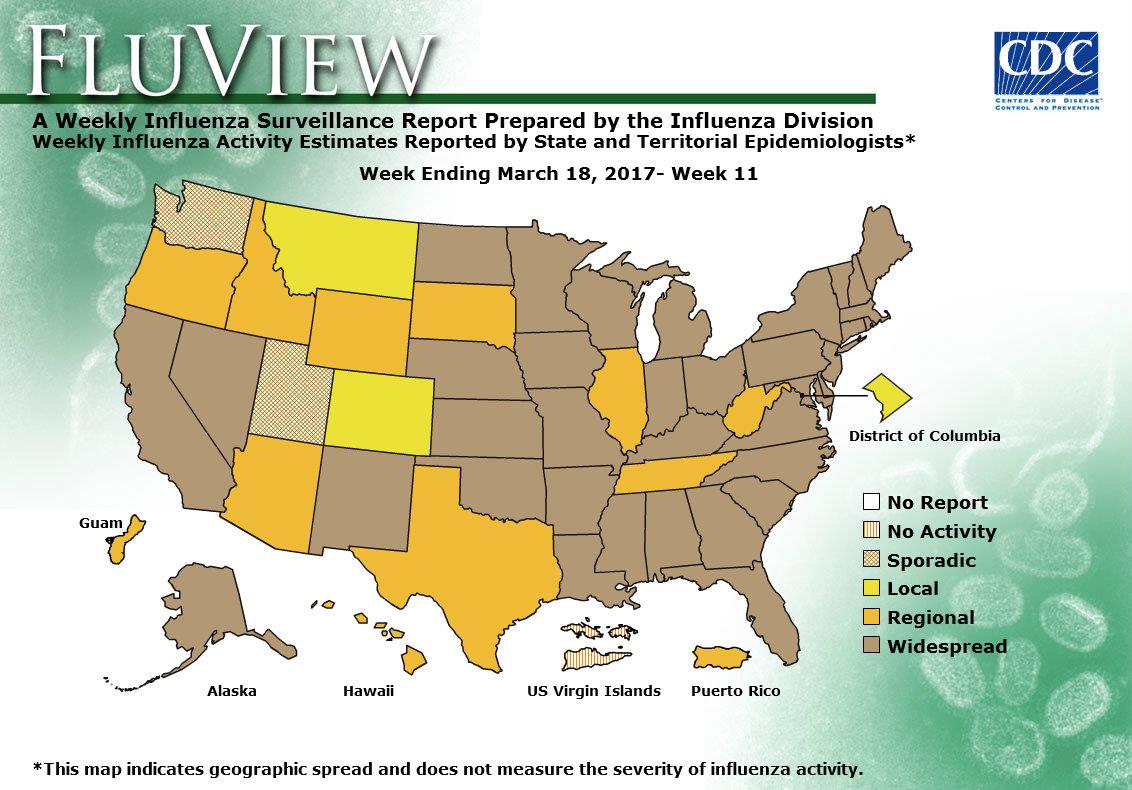
2016-2017 Influenza Season Week 11 ending March 18, 2017
Sunday, March 26th, 2017Synopsis:
During week 11 (March 12-18, 2017), influenza activity decreased, but remained elevated in the United States.
- Viral Surveillance: The most frequently identified influenza virus subtype reported by public health laboratories during week 11 was influenza A (H3). The percentage of respiratory specimens testing positive for influenza in clinical laboratories decreased.
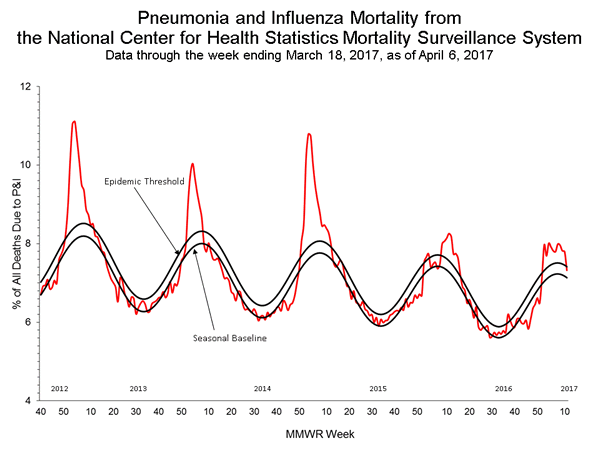
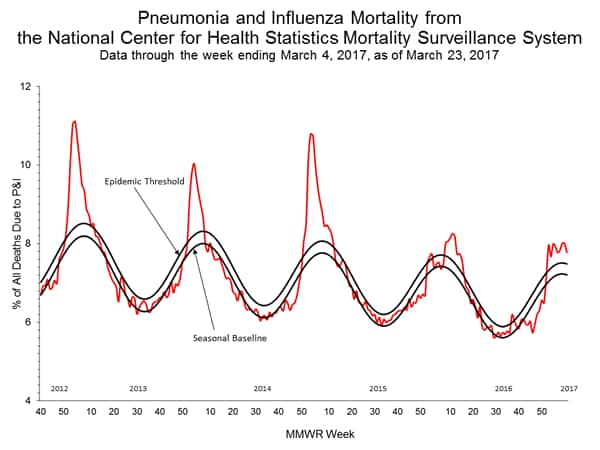
- Pneumonia and Influenza Mortality: The proportion of deaths attributed to pneumonia and influenza (P&I) was above the system-specific epidemic threshold in the National Center for Health Statistics (NCHS) Mortality Surveillance System.
- Influenza-associated Pediatric Deaths: Two influenza-associated pediatric deaths were reported.
- Influenza-associated Hospitalizations: A cumulative rate for the season of 50.4 laboratory-confirmed influenza-associated hospitalizations per 100,000 population was reported.
- Outpatient Illness Surveillance: The proportion of outpatient visits for influenza-like illness (ILI) was 3.2%, which is above the national baseline of 2.2%. Seven of ten regions reported ILI at or above their region-specific baseline levels. 12 states experienced high ILI activity; six states experienced moderate ILI activity; nine states experienced low ILI activity; New York City, Puerto Rico, and 23 states experienced minimal ILI activity; and the District of Columbia had insufficient data.
- Geographic Spread of Influenza: The geographic spread of influenza in 36 states was reported as widespread; Guam, Puerto Rico and 10 states reported regional activity; the District of Columbia and two states reported local activity; two states reported sporadic activity; and the U.S. Virgin Islands reported no activity.
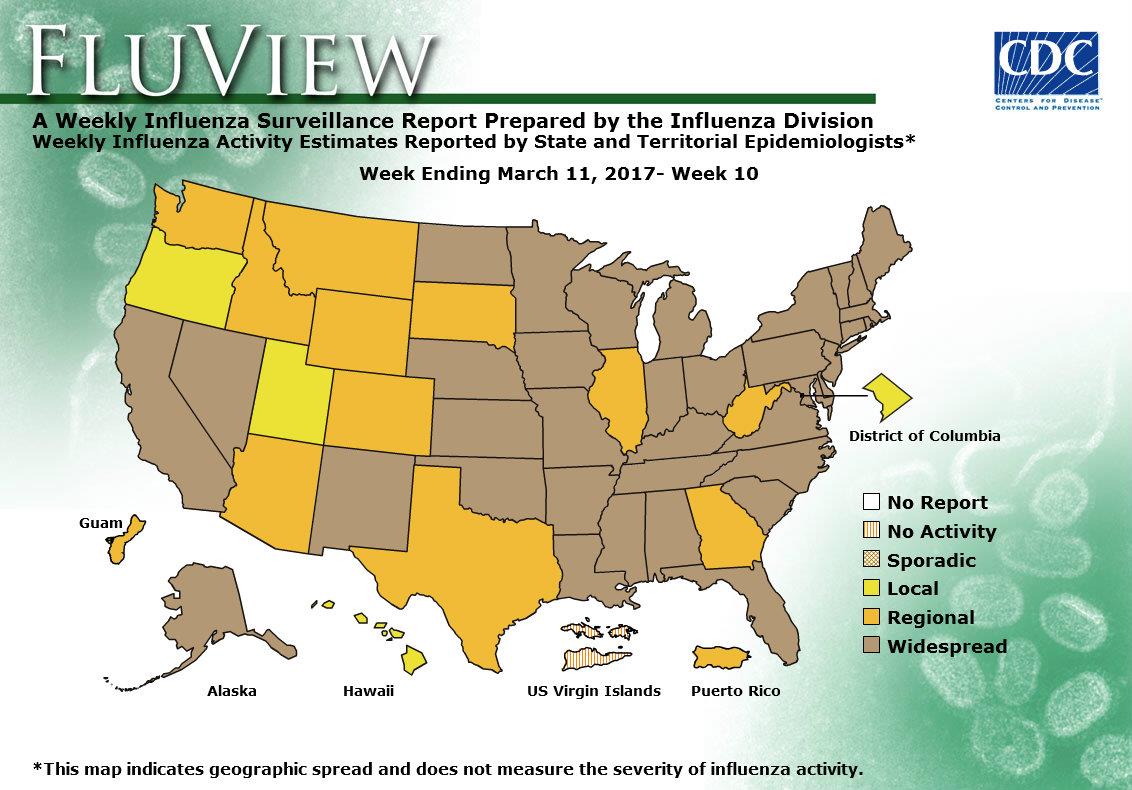
2016-2017 Influenza Season Week 10 ending March 11, 2017
Sunday, March 19th, 2017Synopsis:
During week 10 (March 5-11, 2017), influenza activity decreased, but remained elevated in the United States.
- Viral Surveillance: The most frequently identified influenza virus subtype reported by public health laboratories during week 10 was influenza A (H3). The percentage of respiratory specimens testing positive for influenza in clinical laboratories decreased.
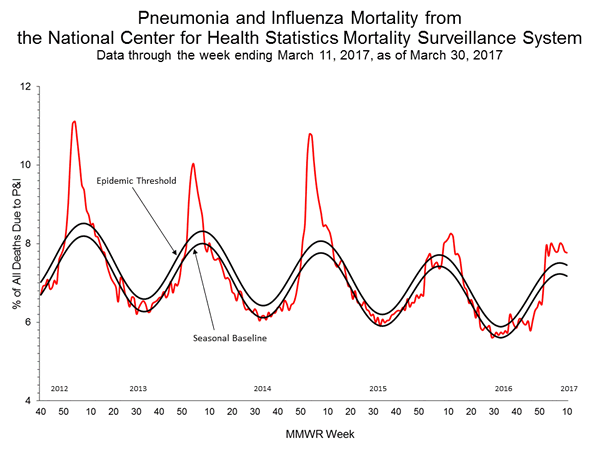
- Pneumonia and Influenza Mortality: The proportion of deaths attributed to pneumonia and influenza (P&I) was above the system-specific epidemic threshold in the National Center for Health Statistics (NCHS) Mortality Surveillance System.
- Influenza-associated Pediatric Deaths: Five influenza-associated pediatric deaths were reported.
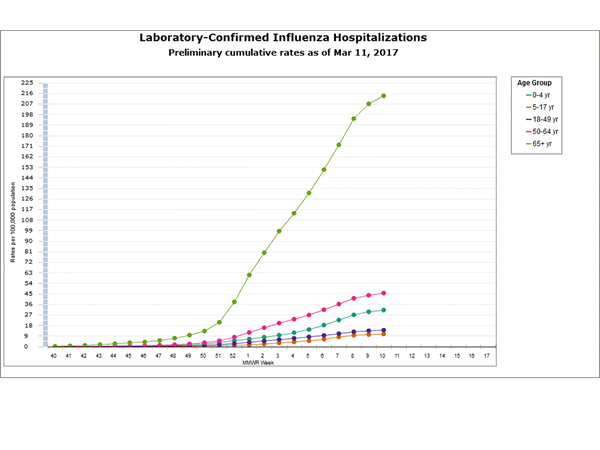
- Influenza-associated Hospitalizations: A cumulative rate for the season of 46.9 laboratory-confirmed influenza-associated hospitalizations per 100,000 population was reported.
- Outpatient Illness Surveillance: The proportion of outpatient visits for influenza-like illness (ILI) was 3.7%, which is above the national baseline of 2.2%. Seven of ten regions reported ILI at or above their region-specific baseline levels. 18 states experienced high ILI activity; seven states experienced moderate ILI activity; five states experienced low ILI activity; New York City, Puerto Rico, and 20 states experienced minimal ILI activity; and the District of Columbia had insufficient data.
- Geographic Spread of Influenza: The geographic spread of influenza in 36 states was reported as widespread; Guam, Puerto Rico and 11 states reported regional activity; the District of Columbia and three states reported local activity; and the U.S. Virgin Islands reported no activity.
CDC: During week 9 (February 26-March 4, 2017), influenza activity decreased, but remained elevated in the United States.
Saturday, March 11th, 2017Synopsis:
During week 9 (February 26-March 4, 2017), influenza activity decreased, but remained elevated in the United States.
- Viral Surveillance: The most frequently identified influenza virus subtype reported by public health laboratories during week 9 was influenza A (H3). The percentage of respiratory specimens testing positive for influenza in clinical laboratories decreased.
- Pneumonia and Influenza Mortality: The proportion of deaths attributed to pneumonia and influenza (P&I) was above the system-specific epidemic threshold in the National Center for Health Statistics (NCHS) Mortality Surveillance System.
- Influenza-associated Pediatric Deaths: Eight influenza-associated pediatric deaths were reported.
- Influenza-associated Hospitalizations: A cumulative rate for the season of 43.5 laboratory-confirmed influenza-associated hospitalizations per 100,000 population was reported.
- Outpatient Illness Surveillance: The proportion of outpatient visits for influenza-like illness (ILI) was 3.6%, which is above the national baseline of 2.2%. Eight of ten regions reported ILI at or above their region-specific baseline levels. 14 states experienced high ILI activity; 12 states experienced moderate ILI activity; eight states experienced low ILI activity; New York City, Puerto Rico, and 16 states experienced minimal ILI activity; and the District of Columbia had insufficient data.
- Geographic Spread of Influenza: The geographic spread of influenza in Puerto Rico and 39 states was reported as widespread; Guam and eight states reported regional activity; the District of Columbia and two states reported local activity; one state reported sporadic activity; and the U.S. Virgin Islands reported no activity.
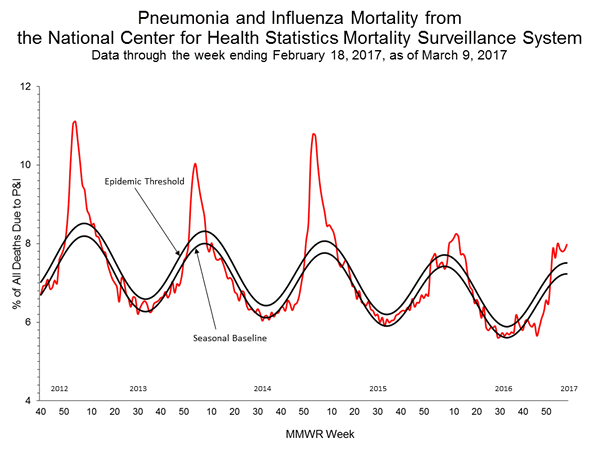
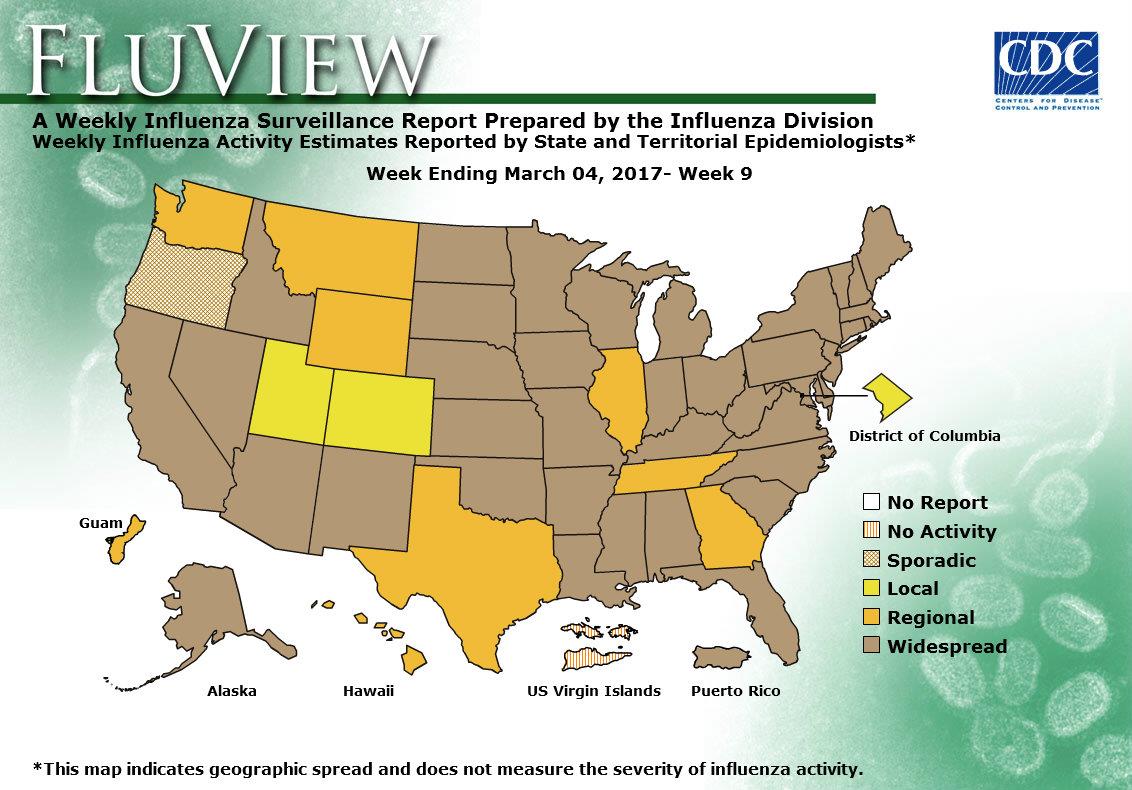
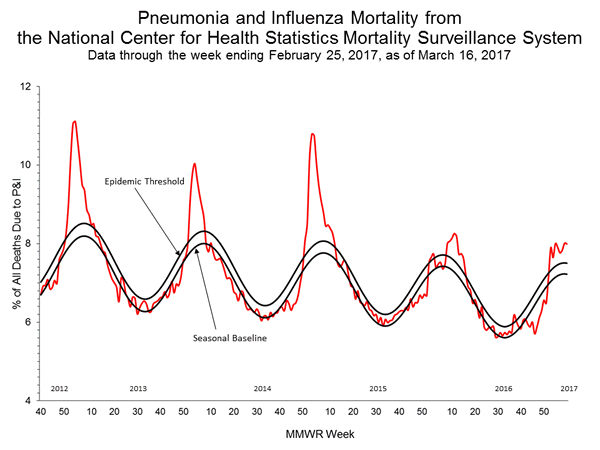
2016-2017 Influenza Season Week 8 ending February 25, 2017: Influenza activity remains elevated in the United States.
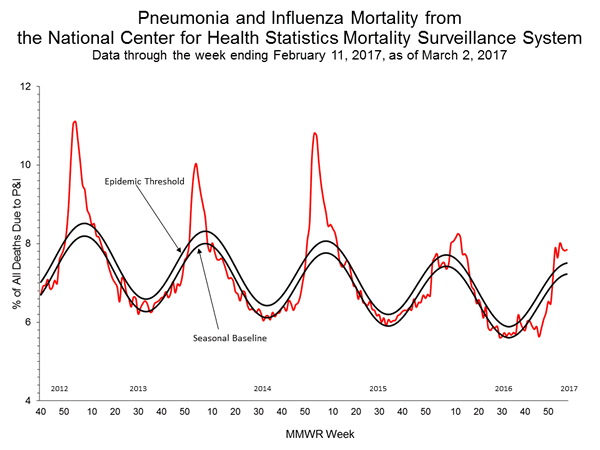
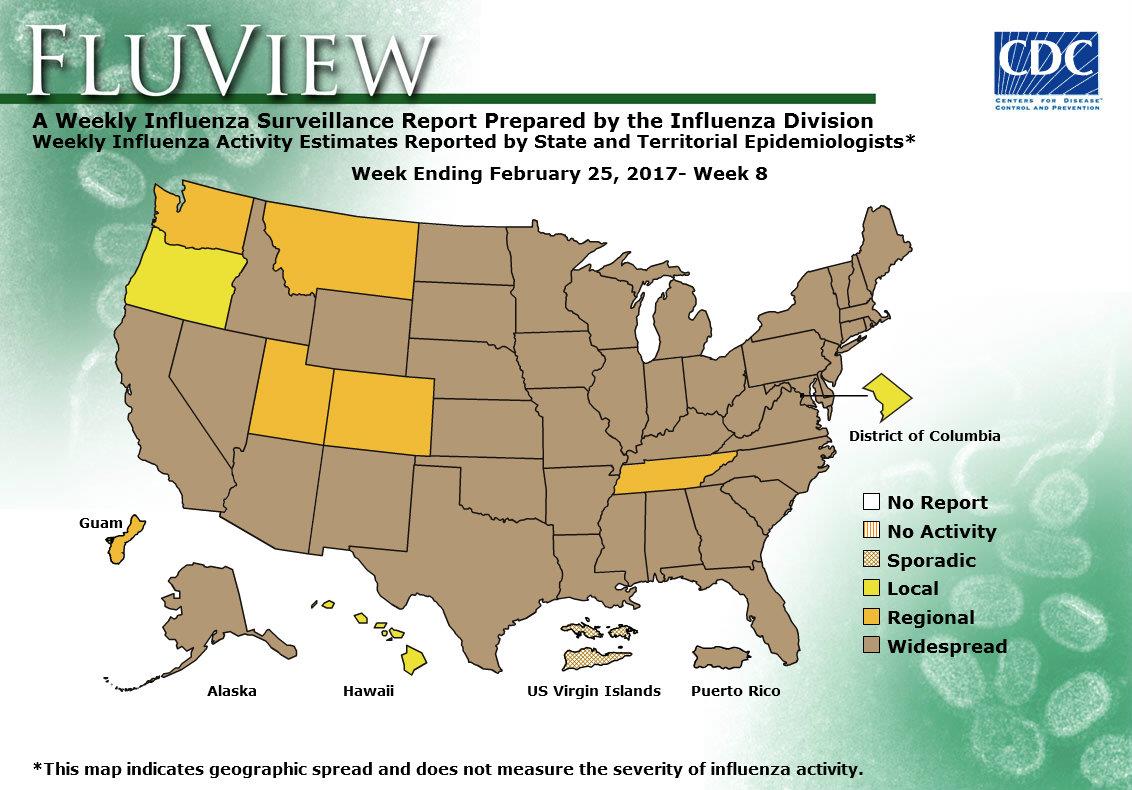
Saturday, March 4th, 2017During week 8 (February 19-25 2017), influenza activity remained elevated in the United States.
- Viral Surveillance: The most frequently identified influenza virus subtype reported by public health laboratories during week 8 was influenza A (H3). The percentage of respiratory specimens testing positive for influenza in clinical laboratories remained elevated.
- Pneumonia and Influenza Mortality: The proportion of deaths attributed to pneumonia and influenza (P&I) was above the system-specific epidemic threshold in the National Center for Health Statistics (NCHS) Mortality Surveillance System.
- Influenza-associated Pediatric Deaths: Six influenza-associated pediatric deaths were reported.
- Influenza-associated Hospitalizations: A cumulative rate for the season of 39.4 laboratory-confirmed influenza-associated hospitalizations per 100,000 population was reported.
- Outpatient Illness Surveillance: The proportion of outpatient visits for influenza-like illness (ILI) was 4.8%, which is above the national baseline of 2.2%. All 10 regions reported ILI at or above their region-specific baseline levels. 27 states experienced high ILI activity; four states experienced moderate ILI activity; New York City, Puerto Rico and six states experienced low ILI activity; 13 states experienced minimal ILI activity; and the District of Columbia had insufficient data.
- Geographic Spread of Influenza: The geographic spread of influenza in Puerto Rico and 43 states was reported as widespread; Guam and five states reported regional activity; the District of Columbia and two states reported local activity; and the U.S. Virgin Islands reported sporadic activity.
“The World Health Organization’s (WHO’s) flu vaccine advisory group today recommended changing one strain—the 2009 H1N1 component—for the Northern Hemisphere’s 2017-18 flu season……Also, the advisors reviewed the latest genetic information about recent avian and other zoonotic flu viruses and recommended two new candidate vaccine viruses for H7N9 avian flu, plus three new ones for other potential pandemic threats….”
Friday, March 3rd, 2017“…..The WHO recommends the following for the Northern Hemisphere’s trivalent vaccines:
- For H1N1, an A/Michigan/45/2015-like virus
- For H3N2, an A/Hong Hong/4801/2014-like virus
- For B, Brisbane/60/2008-like virus (belonging to the Victoria lineage)
For quadrivalent versions that contain two influenza B strains, the WHO experts recommended adding Phuket/3073/2013-like virus, a Yamagata lineage virus that is the second B component of quadrivalent vaccines for both the Southern Hemisphere’s past and the Northern Hemisphere’s current season….”

“…..Today the group said that recent H7N9 viruses fall into the Yangtze River Delta (YRD) or Pearl River Delta (PRD) hemagglutinin lineages, and that two existing candidate vaccine viruses don’t seem to protect against recent YRD-lineage viruses. They proposed a new candidate vaccine virus to protect against those viruses.
Also, they said the newly identified highly pathogenic H7N9 viruses isolated from poultry and people are genetically and antigenically distinct from other H7N9 viruses, including recommended candidate strain, including the newly proposed one. Therefore, the group recommended a new candidate vaccine virus to protect against the highly pathogenic H7N9 strain.
The group also recommended three other candidate pandemic vaccine viruses, two against recent variant H1N1 strains and one against the recent H5N6 virus circulating in Japan and South Korea……”

Markers of Disease Severity in Patients with Spanish Influenza in the Japanese Armed Forces, 1919–1920
Wednesday, March 1st, 2017Kudo K, Manabe T, Izumi S, Takasaki J, Fujikura Y, Kawana A, et al. Markers of disease severity in patients with Spanish influenza in the Japanese Armed Forces, 1919–1920. Emerg Infect Dis. 2017 Apr [date cited]. http://dx.doi.org/10.3201/eid2304.152097
“…..The first and second waves of the Spanish influenza pandemic in Japan affected ≈21 million persons (257,000 deaths) and 2 million persons (127,000 deaths), respectively. ……….
We analyzed medical charts preserved at the former First Army Hospital in Tokyo, Japan, and other affiliated hospitals. We previously described the clinical features of Spanish influenza among patients who were hospitalized at several study sites (2). Recently, additional records of patients affected by the second wave of disease during 1919–1920 were discovered, and these patients were the subjects of this study.
A total of 470 patients hospitalized during January 1919–January 1920 and diagnosed with Spanish influenza (as “epidemic cold” or “pneumonia due to epidemic cold”) fit the criteria for inclusion in the study. All patients were male soldiers or officers in the military of Japan. We collected data concerning patients’ general background and physical assessments, including lung sounds and fever charts. Among all patients, 8 (2%) died. We divided the patients who survived (n = 462, 98%) into 3 groups on the basis of hospitalization length: <10 days (28%), 11–20 days (34%), and >21 days (36%); we compared variables among the 3 groups. High fever was defined as a body temperature >38°C, and diphasic fever was defined as a body temperature >38°C after the initial fever had decreased to <37.5°C. Data on adventitious lung sounds collected during the hospitalization period were classified (on the basis of international classifications) as continuous, discontinuous, bronchial on the chest wall, and friction rub sounds (3). The study was approved by the Institutional Review Board of the National Center for Global Health and Medicine, Tokyo, Japan.
Of the 8 patients who died, 6 died within 10 days of hospital admission. Median length of hospitalization was 7 days for nonsurvivors and 16 days for survivors. The proportion of patients with audible adventitious lung sounds was significantly higher among those hospitalized for >21 days and among those who did not survive (Table 1(https://wwwnc.cdc.gov/eid/article/23/4/15-2097-t1)). Factors associated with the length of hospitalization in survivors (identified by using a Cox hazard proportional model) included diphasic fever, >6 days of continuing high fever from admission, a maximum respiration rate >26 breaths/min, and adventitious discontinuous lung sounds (Table 2(https://wwwnc.cdc.gov/eid/article/23/4/15-2097-t2))……”
2016-2017 Influenza Season Week 7 ending February 18, 2017
Saturday, February 25th, 2017All data are preliminary and may change as more reports are received.
Synopsis:
During week 7 (February 12-18 2017), influenza activity decreased slightly but remained elevated in the United States.
- Viral Surveillance: The most frequently identified influenza virus subtype reported by public health laboratories during week 7 was influenza A (H3). The percentage of respiratory specimens testing positive for influenza in clinical laboratories decreased slightly but remained elevated.
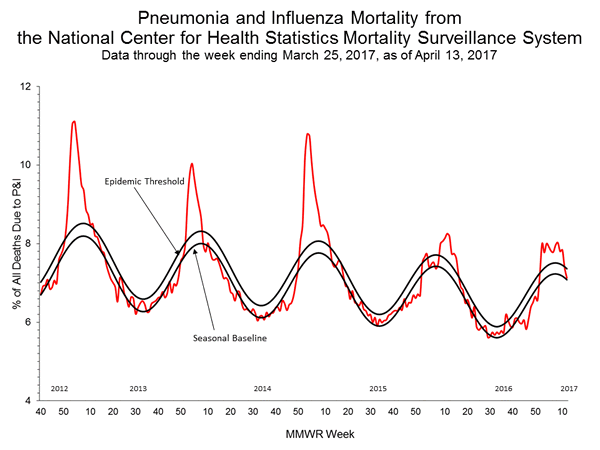
- Pneumonia and Influenza Mortality: The proportion of deaths attributed to pneumonia and influenza (P&I) was above the system-specific epidemic threshold in the National Center for Health Statistics (NCHS) Mortality Surveillance System.
- Influenza-associated Pediatric Deaths: Five influenza-associated pediatric deaths were reported.
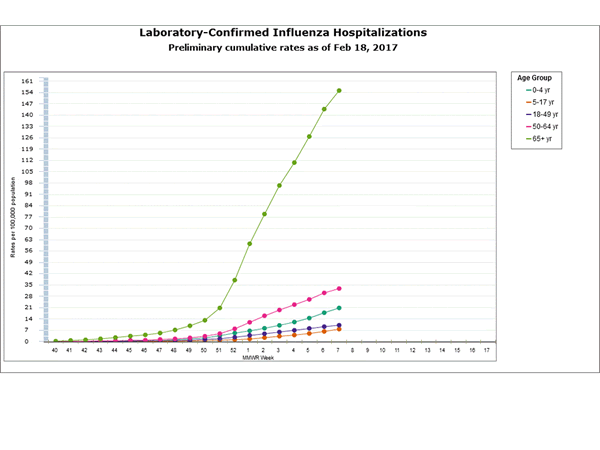
- Influenza-associated Hospitalizations: A cumulative rate for the season of 33.7 laboratory-confirmed influenza-associated hospitalizations per 100,000 population was reported.
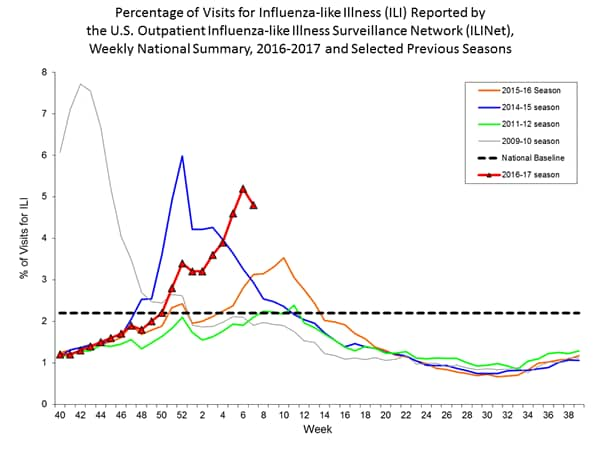
- Outpatient Illness Surveillance: The proportion of outpatient visits for influenza-like illness (ILI) was 4.8%, which is above the national baseline of 2.2%. Nine regions reported ILI at or above their region-specific baseline levels. 27 states experienced high ILI activity; New York City and five states experienced moderate ILI activity; Puerto Rico and 10 states experienced low ILI activity; eight states experienced minimal ILI activity; and the District of Columbia had insufficient data.
- Geographic Spread of Influenza: The geographic spread of influenza in Puerto Rico and 44 states was reported as widespread; Guam and four states reported regional activity; the District of Columbia and one state reported local activity; one state reported sporadic activity; and the U.S. Virgin Islands reported no activity.
