Archive for the ‘Influenza’ Category
2016-2017 Influenza Season Week 6 ending February 11, 2017
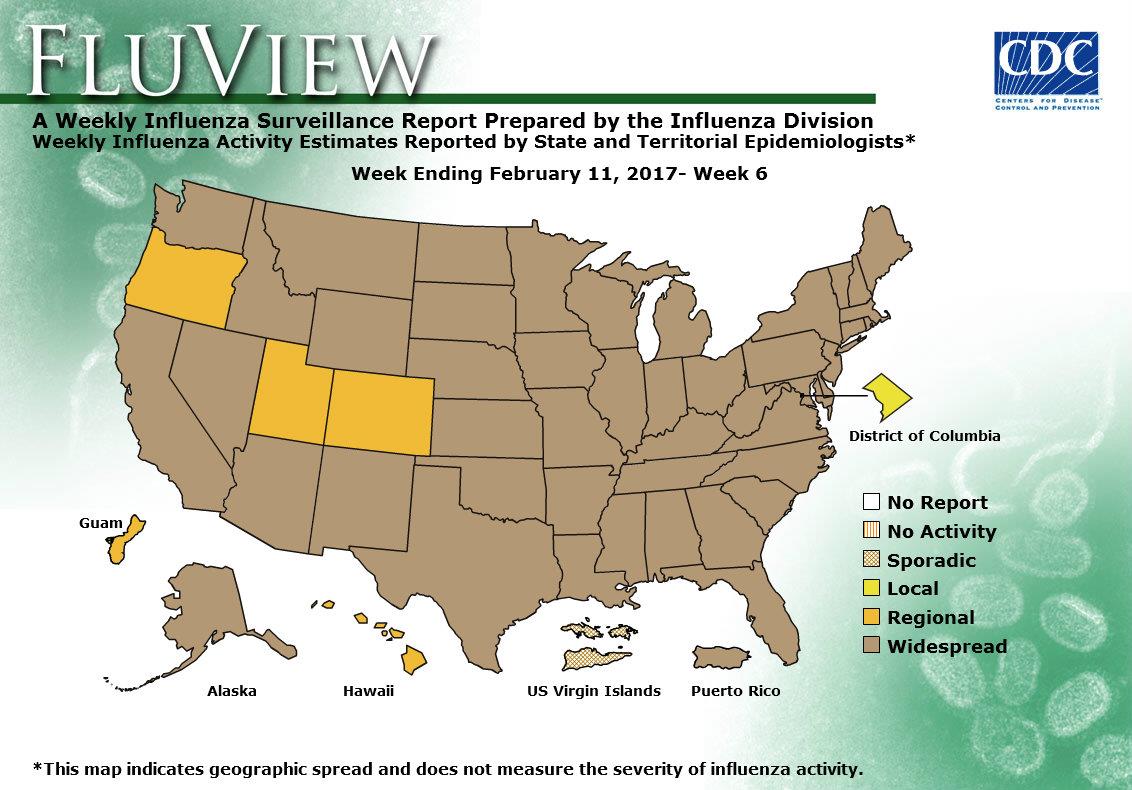
Saturday, February 18th, 2017During week 6 (February 5-11, 2017), influenza activity increased in the United States.
- Viral Surveillance: The most frequently identified influenza virus subtype reported by public health laboratories during week 6 was influenza A (H3). The percentage of respiratory specimens testing positive for influenza in clinical laboratories increased.
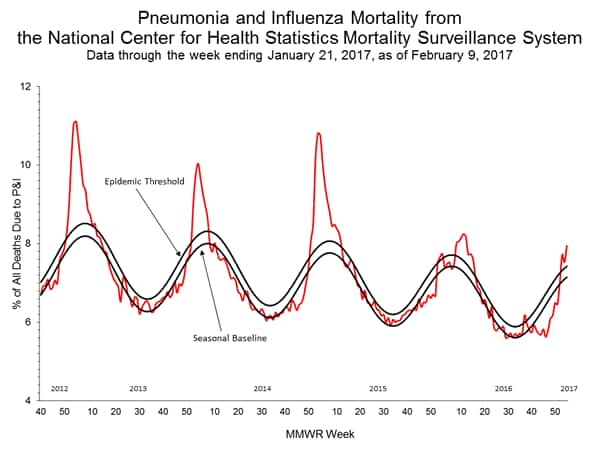
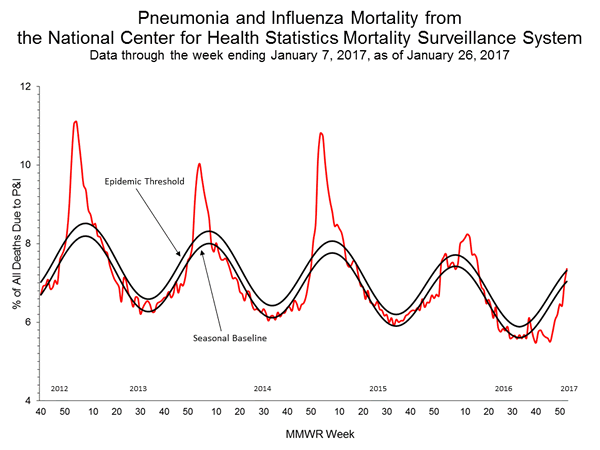
- Pneumonia and Influenza Mortality: The proportion of deaths attributed to pneumonia and influenza (P&I) was above the system-specific epidemic threshold in the National Center for Health Statistics (NCHS) Mortality Surveillance System.
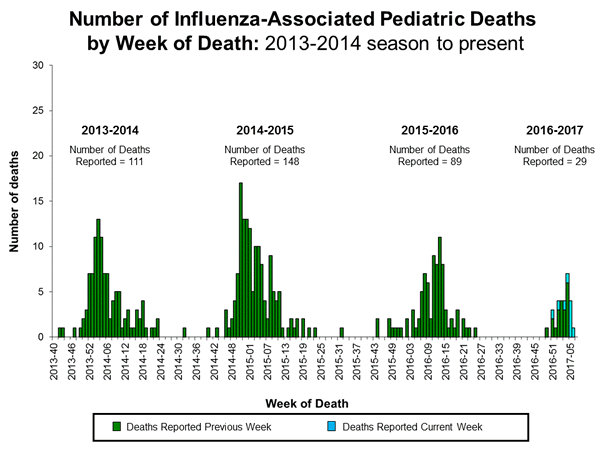
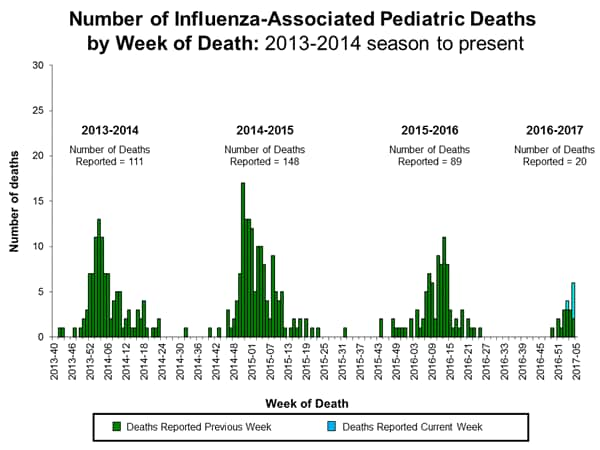
- Influenza-associated Pediatric Deaths: Nine influenza-associated pediatric deaths were reported.
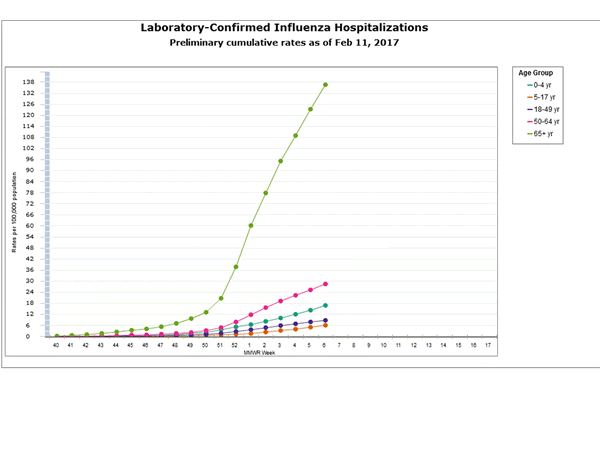
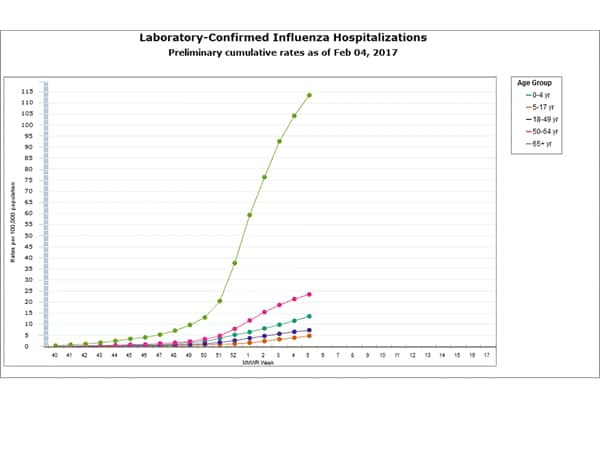
- Influenza-associated Hospitalizations:A cumulative rate for the season of 29.4 laboratory-confirmed influenza-associated hospitalizations per 100,000 population was reported.
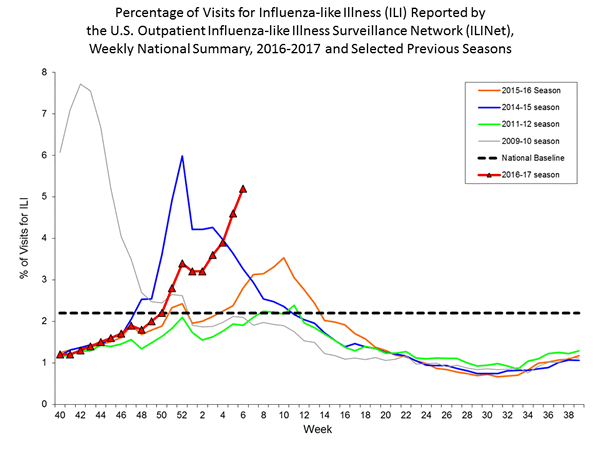
- Outpatient Illness Surveillance:The proportion of outpatient visits for influenza-like illness (ILI) was 5.2%, which is above the national baseline of 2.2%. All 10 regions reported ILI at or above their region-specific baseline levels. New York City and 28 states experienced high ILI activity; Puerto Rico and seven states experienced moderate ILI activity; five states experienced low ILI activity; nine states experienced minimal ILI activity; and the District of Columbia had insufficient data.
- Geographic Spread of Influenza: The geographic spread of influenza in Puerto Rico and 46 states was reported as widespread; Guam and four states reported regional activity; the District of Columbia reported local activity; and the U.S. Virgin Islands reported sporadic activity.
Interim influenza vaccine effectiveness estimates for the 2016–17 season indicate that vaccination reduced the risk for influenza-associated medical visits by approximately half.
Friday, February 17th, 2017Flannery B, Chung JR, Thaker SN, et al. Interim Estimates of 2016–17 Seasonal Influenza Vaccine Effectiveness — United States, February 2017. MMWR Morb Mortal Wkly Rep 2017;66:167–171. DOI: http://dx.doi.org/10.15585/mmwr.mm6606a3.
“Influenza activity in the United States began to increase in mid-December, remained elevated through February 4, 2016, and is expected to continue for several more weeks. During October 2, 2016–February 4, 2017, influenza A (H3N2) viruses were identified most frequently, but influenza A (H1N1)pdm09 and influenza B viruses were also reported. No antiviral resistance to oseltamivir, zanamivir, or peramivir has been identified among influenza viruses tested to date.”
2016-2017 Influenza Season Week 5 ending February 4, 2017
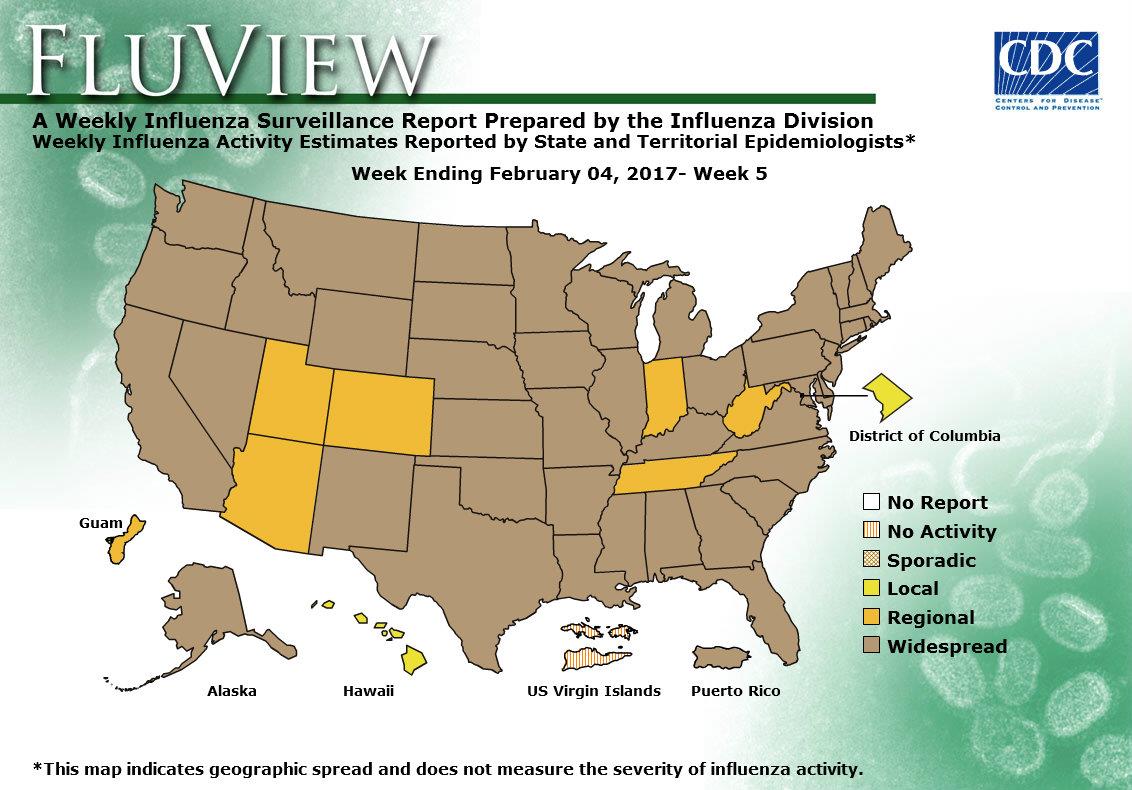
Saturday, February 11th, 2017During week 5 (January 29-February 4, 2017), influenza activity increased in the United States.
- Viral Surveillance: The most frequently identified influenza virus subtype reported by public health laboratories during week 5 was influenza A (H3). The percentage of respiratory specimens testing positive for influenza in clinical laboratories increased.
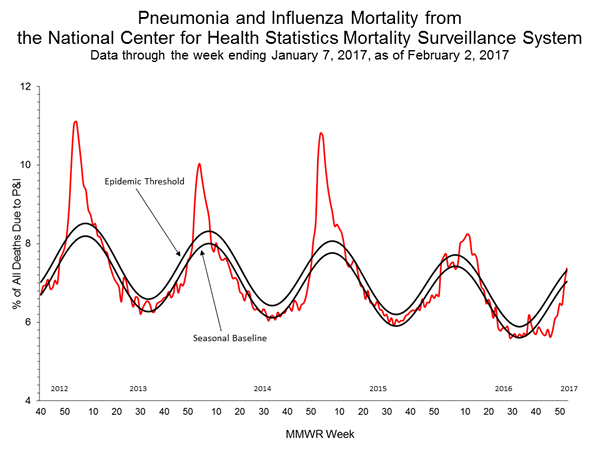
- Pneumonia and Influenza Mortality: The proportion of deaths attributed to pneumonia and influenza (P&I) was above the system-specific epidemic threshold in the National Center for Health Statistics (NCHS) Mortality Surveillance System.
- Influenza-associated Pediatric Deaths: Five influenza-associated pediatric deaths were reported.
- Influenza-associated Hospitalizations: A cumulative rate for the season of 24.3 laboratory-confirmed influenza-associated hospitalizations per 100,000 population was reported.
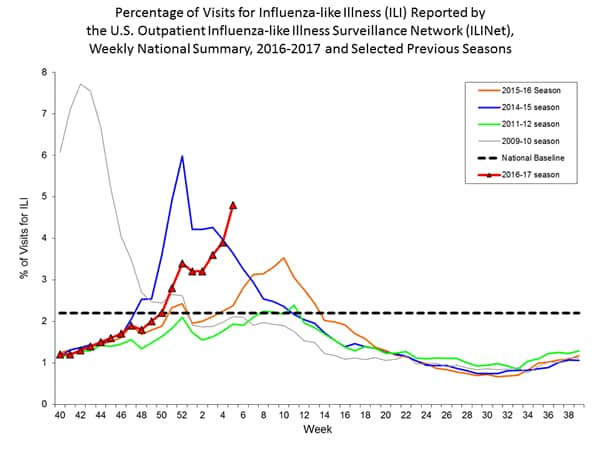
- Outpatient Illness Surveillance:The proportion of outpatient visits for influenza-like illness (ILI) was 4.8%, which is above the national baseline of 2.2%. All 10 regions reported ILI at or above their region-specific baseline levels. New York City and 23 states experienced high ILI activity; 10 states experienced moderate ILI activity; Puerto Rico and eight states experienced low ILI activity; nine states experienced minimal ILI activity; and the District of Columbia had insufficient data.
- Geographic Spread of Influenza: The geographic spread of influenza in Puerto Rico and 43 states was reported as widespread; Guam and six states reported regional activity; the District of Columbia and one state reported local activity; and the U.S. Virgin Islands reported no activity.
2016-2017 Influenza Season Week 4 ending January 28, 2017
Saturday, February 4th, 2017CDC Synopsis:
During week 4 (January 22-28, 2017), influenza activity increased in the United States.
- Viral Surveillance: The most frequently identified influenza virus subtype reported by public health laboratories during week 4 was influenza A (H3). The percentage of respiratory specimens testing positive for influenza in clinical laboratories increased.
- Pneumonia and Influenza Mortality: Due to data processing problems, the National Center for Health Statistics (NCHS) mortality surveillance data for the week ending January 14, 2015 (week 2) will not be published this week.
- Influenza-associated Pediatric Deaths: Seven influenza-associated pediatric deaths were reported.
- Influenza-associated Hospitalizations: A cumulative rate for the season of 20.3 laboratory-confirmed influenza-associated hospitalizations per 100,000 population was reported.
- Outpatient Illness Surveillance:The proportion of outpatient visits for influenza-like illness (ILI) was 3.9%, which is above the national baseline of 2.2%. All 10 regions reported ILI at or above their region-specific baseline levels. New York City and 15 states experienced high ILI activity; Puerto Rico and 11 states experienced moderate ILI activity; 14 states experienced low ILI activity; 10 states experienced minimal ILI activity, and the District of Columbia had insufficient data.
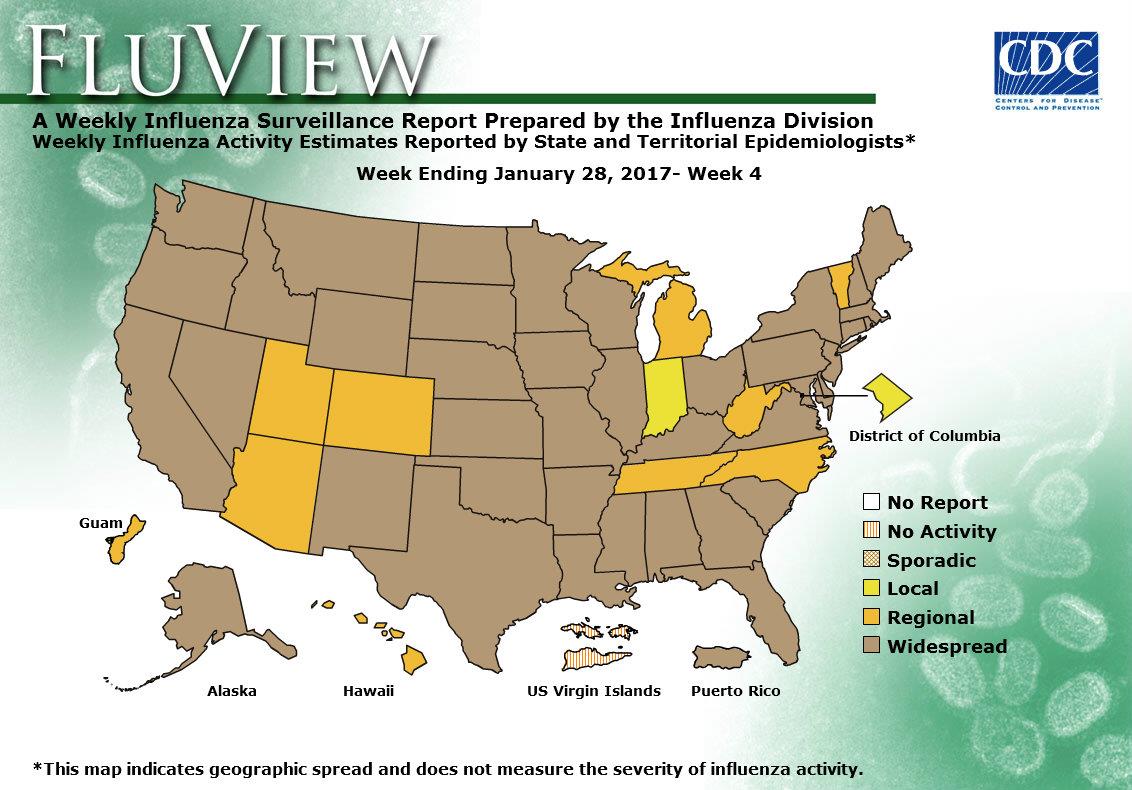
- Geographic Spread of Influenza: The geographic spread of influenza in Puerto Rico and 40 states was reported as widespread; Guam and nine states reported regional activity; the District of Columbia and one state reported local activity; and the U.S. Virgin Islands reported no activity.
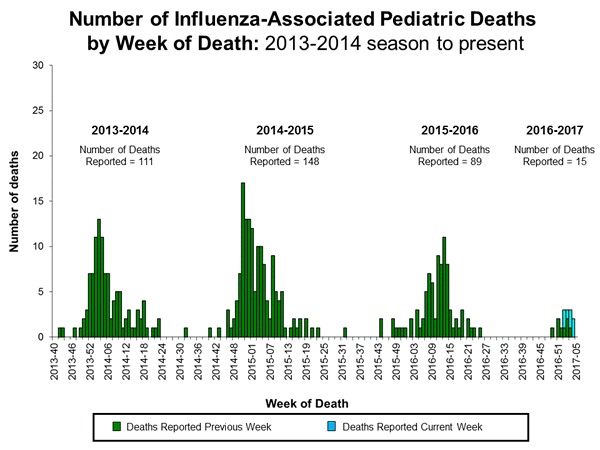
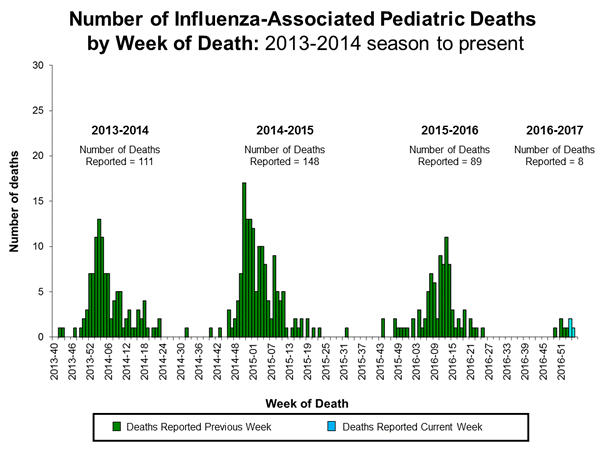
Seven influenza-associated pediatric deaths were reported to CDC during week 4. Three deaths were associated with an influenza A (H3) virus and occurred during weeks 1, 2, and 4 (the weeks ending January 7, 14, and 28, 2017, respectively). Three deaths were associated with an influenza A virus for which no subtyping was performed and occurred during weeks 1, 3, and 4 (the weeks ending January 7, 21, and 28, 2017, respectively). One death was associated with an influenza B virus and occurred during week 3 (the week ending January 21, 2017).
A total of 15 influenza-associated pediatric deaths have been reported for the 2016-2017 season.
2016-2017 Influenza Season Week 3 ending January 21, 2017
Tuesday, January 31st, 20172016-2017 Influenza Season Week 3 ending January 21, 2017
All data are preliminary and may change as more reports are received.
Synopsis:
During week 3 (January 15-21, 2017), influenza activity increased in the United States..
- Viral Surveillance: The most frequently identified influenza virus subtype reported by public health laboratories during week 3 was influenza A (H3). The percentage of respiratory specimens testing positive for influenza in clinical laboratories increased.
- Pneumonia and Influenza Mortality: The proportion of deaths attributed to pneumonia and influenza (P&I) was above the system-specific epidemic threshold in the National Center for Health Statistics (NCHS) Mortality Surveillance System.
- Influenza-associated Pediatric Deaths: Three influenza-associated pediatric deaths were reported.
- Influenza-associated Hospitalizations: A cumulative rate for the season of 15.4 laboratory-confirmed influenza-associated hospitalizations per 100,000 population was reported.
- Outpatient Illness Surveillance:The proportion of outpatient visits for influenza-like illness (ILI) was 3.4%, which is above the national baseline of 2.2%. All 10 regions reported ILI at or above their region-specific baseline levels. New York City and 10 states experienced high ILI activity; 10 states experienced moderate ILI activity; Puerto Rico and 17 states experienced low ILI activity; 13 states experienced minimal ILI activity, and the District of Columbia had insufficient data.
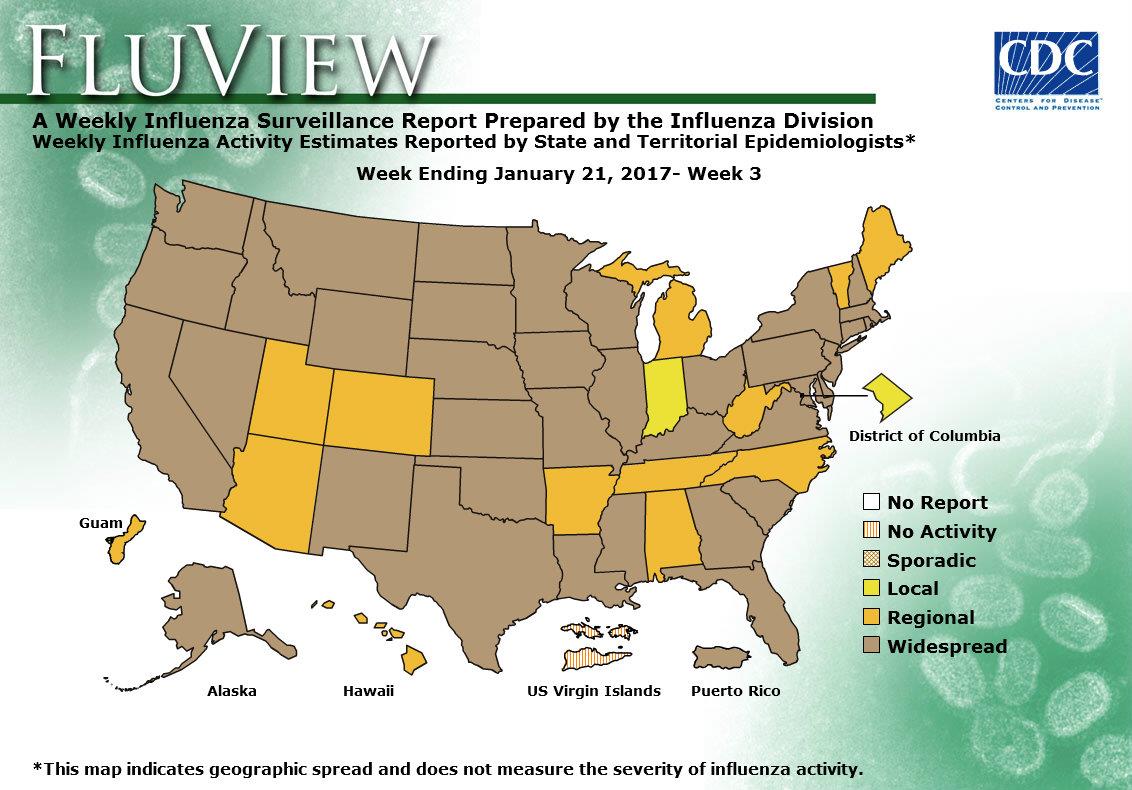
- Geographic Spread of Influenza: The geographic spread of influenza in Puerto Rico and 37 states was reported as widespread; Guam and 12 states reported regional activity; the District of Columbia and one state reported local activity; and the U.S. Virgin Islands reported no activity.
A case report on an immunocompromised patient with prolonged influenza virus reveals resistance to two common antiviral drugs and shows how rapidly antiviral resistance can evolve.
Sunday, January 22nd, 2017Trebbien R, Pedersen SS, Vorborg K, Franck KT, Fischer TK. Development of oseltamivir and zanamivir resistance in influenza A(H1N1)pdm09 virus, Denmark, 2014. Euro Surveill. 2017;22(3):pii=30445. DOI: http://dx.doi.org/10.2807/1560-7917.ES.2017.22.3.30445
“Influenza virus is the cause of annual seasonal epidemics worldwide, and leads to high morbidity in the population. Severe disease and deadly outcome due to influenza virus are recognised in the defined risk groups, in particular elderly persons > 65 years of age and immunocompromised patients. Influenza is normally an acute self-limiting disease with a duration of 5 to 7 days, however, in immunocompromised patients prolonged infections lasting several months have been reported [1–4]. Prevention of severe influenza disease is mainly based on immunisations with split vaccines which are produced annually to accommodate the changing antigenicity of seasonal epidemic viruses [5,6]. The effect of vaccination in immunocompromised patients is questionable and this is why other modes of prevention and/or treatment often are considered for this risk group [7–12]. For treatment of influenza viruses only a few antiviral drugs are available; the neuraminidase (NA) inhibitors and the matrix-2 (M2)-ion channel inhibitors. The current circulating epidemic influenza viruses harbour natural resistance towards the M2-ion channel inhibitors therefore these are not an option for treatment [13–15]. The NA inhibitors bind to the NA surface protein and prevent it from facilitating the release of new virus particles from an infected cell [16]. In Denmark, two different NA inhibitors are approved and available for treatment of influenza: oseltamivir (Tamiflu) and zanamivir (Relenza). Oseltamivir is the drug of choice for treatment due to its easy oral administration whereas zanamivir (intravenous or inhalation) is often used when the effect of oseltamivir is limited, e.g. in case of development of resistance. In the NA gene of the H1N1 viruses a range of amino acid mutations are recognised to confer reduced inhibition by NA inhibitors [16–18]. Among these, two well characterised mutations are the H275Y mutation which results in viruses with highly reduced inhibition by oseltamivir and the I223R mutation which results in reduced inhibition by both oseltamivir and zanamivir [16,17].
Antiviral treatment of immunocompromised patients with prolonged influenza virus infection can lead to multidrug-resistant influenza quasispecies in the same patient [1]. We describe how the emergence of such virus variants poses challenges in the combat of a severe influenza infection in a Danish patient treated with antivirals. The patient had sustained shedding of influenza A(H1N1)pdm09 virus for 6 months and was treated with oseltamivir and subsequently zanamivir. Antiviral resistance mutation profiles were evaluated using conventional Sanger sequencing and next generation sequencing (NGS)…..”
CDC’s Summary of Weekly FluView Report, Week 2
Saturday, January 21st, 2017Summary of Weekly FluView Report
U.S. Situation Update
Key Flu Indicators
According to the FluView report for the week ending January 14, 2017 (week 2), flu activity continues to increase in the United States. The proportion of people seeing their health care provider for influenza-like-illness (ILI) has been at or above the national baseline for five consecutive weeks so far this season and the number of states reporting widespread flu activity increased from 21 states to 29 states. Also, CDC reported two additional flu-associated pediatric deaths for the 2016-2017 season. Influenza A (H3) viruses continue to predominate. Flu activity is expected to continue over the coming weeks. CDC recommends annual flu vaccination for everyone 6 months of age and older. Anyone who has not gotten vaccinated yet this season should get vaccinated now. Below is a summary of the key flu indicators for the week ending January 14, 2017:
- Influenza-like Illness Surveillance: For the week ending January 14, the proportion of people seeing their health care provider(https://www.cdc.gov/flu/weekly/#_blank) for influenza-like illness (ILI) increased to 3.3%. This remains above the national baseline of 2.2%. All ten regions reported ILI at or above their region-specific baseline level. For the last 15 seasons, the average duration of a flu season by this measure has been 13 weeks, with a range from one week to 20 weeks.
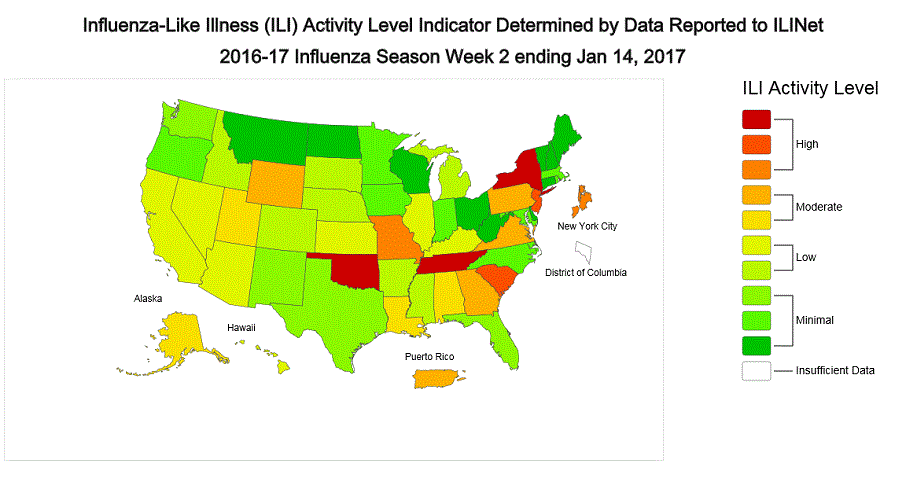
- Influenza-like Illness State Activity Indicator Map: New York City and six states (Missouri, New Jersey, New York, Oklahoma, South Carolina, and Tennessee) experienced high ILI activity. Puerto Rico and eight states (Alabama, Alaska, Georgia, Louisiana, Pennsylvania, Utah, Virginia, and Wyoming) experienced moderate ILI activity. 14 states (Arizona, Arkansas, California, Colorado, Hawaii, Idaho, Illinois, Kansas, Kentucky, Michigan, Mississippi, Nebraska, Nevada, and South Dakota). 22 states experienced minimal ILI activity. The District of Columbia did not have sufficient data to calculate an activity level. ILI activity data indicate the amount of flu-like illness that is occurring in each state.
- Geographic Spread of Influenza Viruses: Widespread influenza activity was reported by Puerto Rico and 29 states (Alaska, California, Connecticut, Delaware, Florida, Idaho, Illinois, Kentucky, Maryland, Massachusetts, Missouri, Montana, Nebraska, Nevada, New Hampshire, New Jersey, New York, North Dakota, Ohio, Oklahoma, Oregon, Pennsylvania, Rhode Island, South Carolina, Texas, Virginia, Washington, Wisconsin, and Wyoming). Regional influenza activity was reported by Guam and 17 states (Alabama, Arizona, Arkansas, Colorado, Georgia, Hawaii, Iowa, Kansas, Louisiana, Maine, Michigan, Minnesota, Mississippi, New Mexico, North Carolina, South Dakota, and Utah). Local influenza activity was reported by the District of Columbia and four states (Indiana, Tennessee, Vermont, and West Virginia). Sporadic influenza activity was reported by the U.S. Virgin Islands. Geographic spread data show how many areas within a state or territory are seeing flu activity.
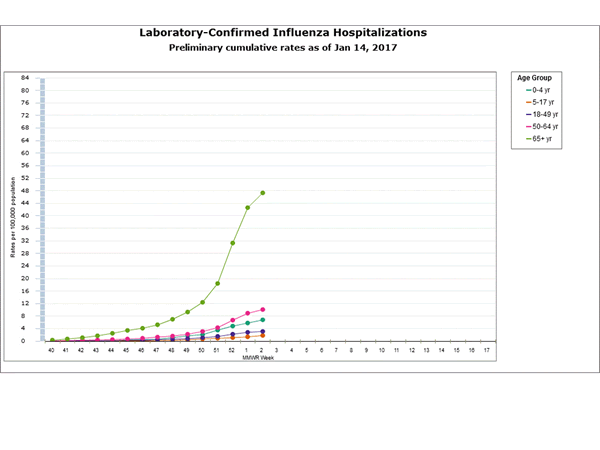
- Flu-Associated Hospitalizations: Since October 1, 2016, a total of 2,864 laboratory-confirmed influenza-associated hospitalizations(https://www.cdc.gov/flu/weekly/#_blank) have been reported. This translates to a cumulative overall rate of 10.2 hospitalizations per 100,000 people in the United States. Additional data, including hospitalization rates during other influenza seasons, can be found at http://gis.cdc.gov/GRASP/Fluview/FluHospRates.html and http://gis.cdc.gov/grasp/fluview/FluHospChars.html.
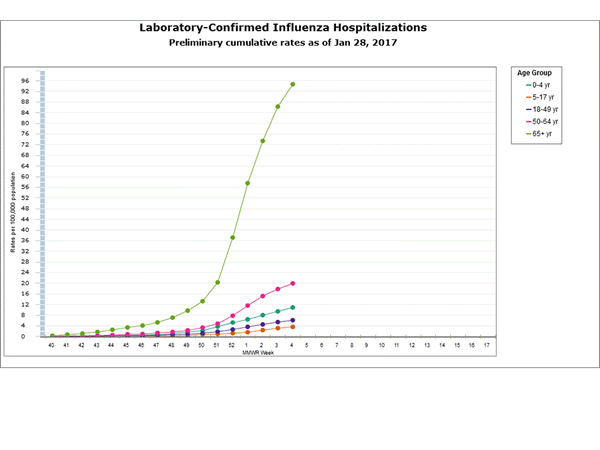
- The highest hospitalization rates are among people 65 years and older (47.3 per 100,000), followed by adults 50-64 years (10.1 per 100,000) and children younger than 5 years (6.8 per 100,000). During most seasons, children younger than 5 years and adults 65 years and older have the highest hospitalization rates.
- Hospitalization data are collected from 13 states and represent approximately 9% of the total U.S. population. The number of hospitalizations reported does not reflect the actual total number of influenza-associated hospitalizations in the United States.
- The highest hospitalization rates are among people 65 years and older (47.3 per 100,000), followed by adults 50-64 years (10.1 per 100,000) and children younger than 5 years (6.8 per 100,000). During most seasons, children younger than 5 years and adults 65 years and older have the highest hospitalization rates.
- Mortality Surveillance:
- The proportion of deaths(https://www.cdc.gov/flu/weekly/#_blank) attributed to pneumonia and influenza (P&I) was 7.0% for the week ending December 31, 2016 (week 52). This percentage is below the epidemic threshold of 7.3% for week 52 in the National Center for Health Statistics (NCHS) Mortality Surveillance System.
- Pediatric Deaths:
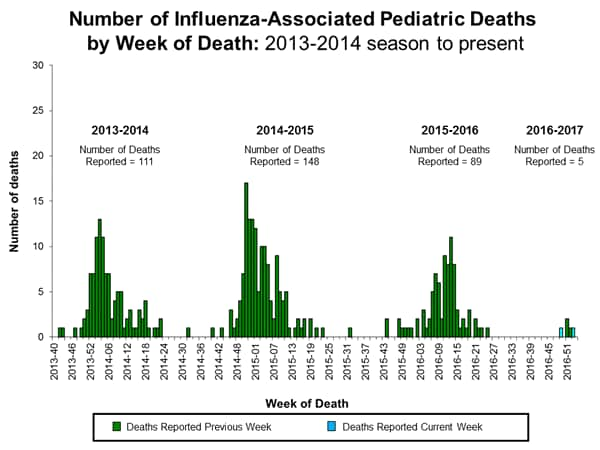
- Two influenza-associated pediatric deaths were reported to CDC during the week ending January 14, 2017.
- One death was associated with an influenza A virus for which no subtyping was performed and occurred during week 49 (the week ending December 10, 2016.
- One death was associated with an influenza virus for which the type was not determined and occurred during week 1 (the week ending January 7, 2017).
- A total of 5 influenza-associated pediatric deaths have been reported during the 2016-2017 season.
- Laboratory Data:
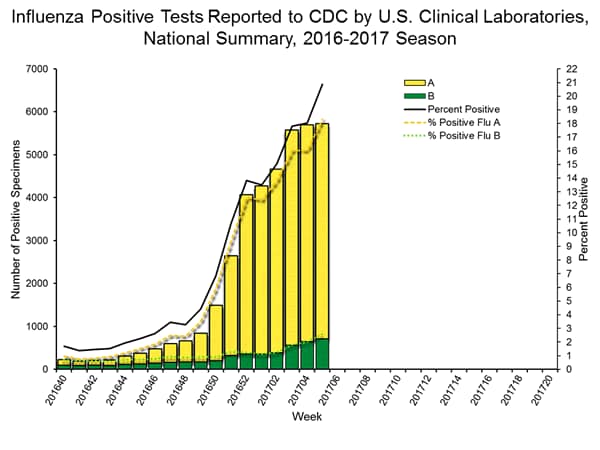
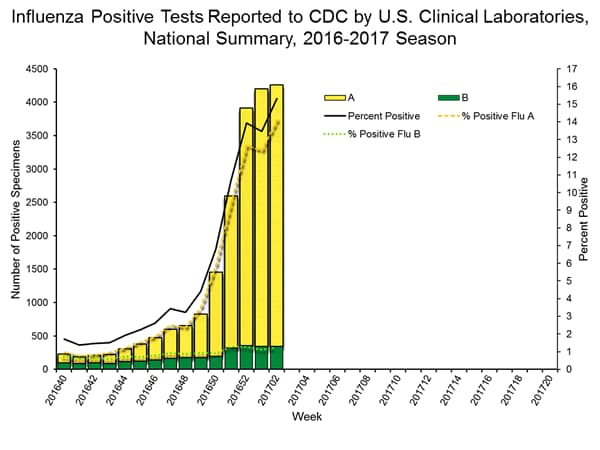
- Nationally, the percentage of respiratory specimens(https://www.cdc.gov/flu/weekly/index.htm#_blank) testing positive for influenza viruses in clinical laboratories during the week ending January 14 was 15.3%.
- Regionally, the three week average percent of specimens testing positive for influenza in clinical laboratories ranged from 9.2% to 28.0%.
- During the week ending January 14, of the 4,258 (15.3%) influenza-positive tests reported to CDC by clinical laboratories, 3,916 (92.0%) were influenza A viruses and 342 (8.0%) were influenza B viruses.
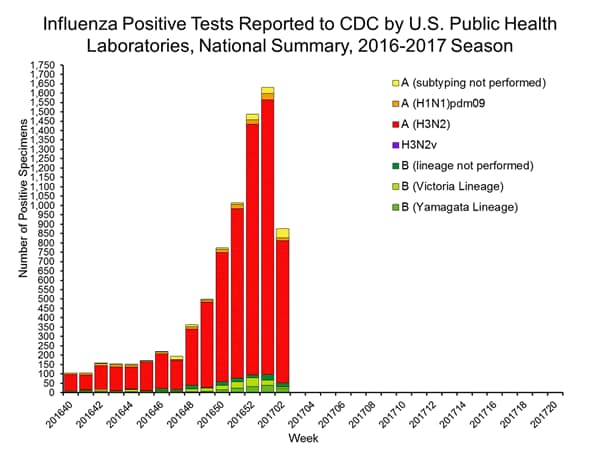
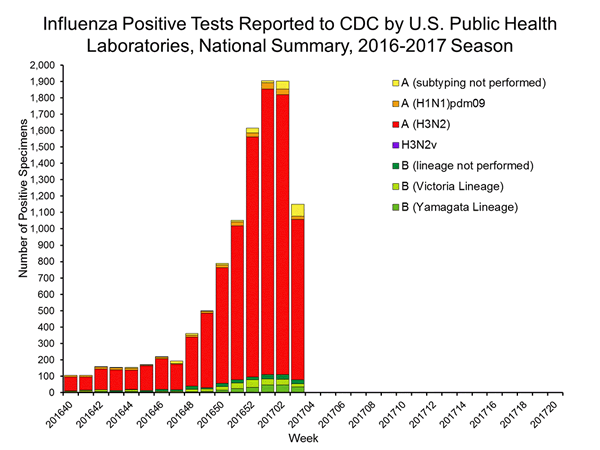
- The most frequently identified influenza virus type reported by public health laboratories during the week ending January 14 was influenza A viruses, with influenza A (H3) viruses predominating.
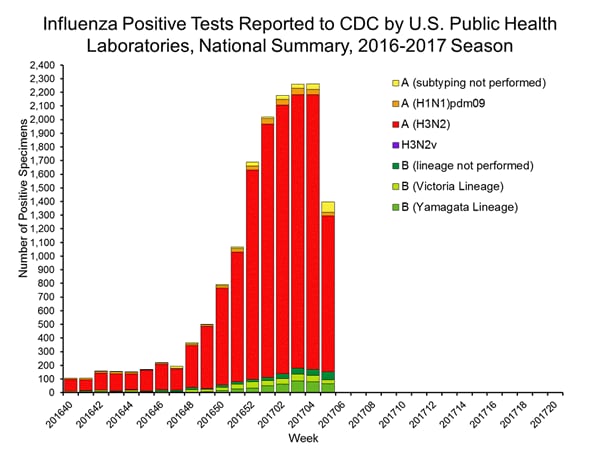
- During the week ending January 14, 824 (94.2%) of the 875 influenza-positive tests reported to CDC by public health laboratories were influenza A viruses and 51 (5.8%) were influenza B viruses. Of the 777 influenza A viruses that were subtyped, 761 (97.9%) were H3 viruses and 16 (2.1%) were (H1N1)pdm09 viruses.
- Since October 1, 2016, antigenic and/or genetic characterization shows that the majority of the tested viruses remain similar to the recommended components of the 2016-2017 Northern Hemisphere vaccines.
- Since October 1, 2016, CDC tested 545 specimens (59 influenza A (H1N1)pdm09, 385 influenza A (H3N2), and 101 influenza B viruses) for resistance to the neuraminidase inhibitors antiviral drugs. None of the tested viruses were found to be resistant to oseltamivir, zanamivir, or peramivir.
2016-2017 Influenza Season Week 2 ending January 14, 2017
Saturday, January 21st, 2017During week 2 (January 8-14, 2017), influenza activity increased in the United States.
- Viral Surveillance: The most frequently identified influenza virus subtype reported by public health laboratories during week 2 was influenza A (H3). The percentage of respiratory specimens testing positive for influenza in clinical laboratories increased.
- Pneumonia and Influenza Mortality: The proportion of deaths attributed to pneumonia and influenza (P&I) was below the system-specific epidemic threshold in the National Center for Health Statistics (NCHS) Mortality Surveillance System.
- Influenza-associated Pediatric Deaths: Two influenza-associated pediatric deaths were reported.
- Influenza-associated Hospitalizations: A cumulative rate for the season of 10.2 laboratory-confirmed influenza-associated hospitalizations per 100,000 population was reported.
- Outpatient Illness Surveillance: The proportion of outpatient visits for influenza-like illness (ILI) was 3.3%, which is above the national baseline of 2.2%. All 10 regions reported ILI at or above their region-specific baseline levels. New York City and six states experienced high ILI activity; Puerto Rico and eight states experienced moderate ILI activity; 14 states experienced low ILI activity; 22 states experienced minimal ILI activity, and the District of Columbia had insufficient data.
- Geographic Spread of Influenza: The geographic spread of influenza in Puerto Rico and 29 states was reported as widespread; Guam and 17 states reported regional activity; the District of Columbia and four states reported local activity; and the U.S. Virgin Islands reported sporadic activity.
Neuraminidase Inhibitor Resistance Testing Results on Samples Collected Since October 1, 2016
|
Oseltamivir |
Zanamivir |
Peramivir |
||||
|---|---|---|---|---|---|---|
|
Virus Samples tested (n) |
Resistant Viruses, Number (%) |
Virus Samples tested (n) |
Resistant Viruses, Number (%) |
Virus Samples tested (n) |
Resistant Viruses, Number (%) |
|
| Influenza A (H1N1)pdm09 |
59 |
0 (0.0) |
59 |
0 (0.0) |
59 |
0 (0.0) |
| Influenza A (H3N2) |
385 |
0 (0.0) |
385 |
0 (0.0) |
319 |
0 (0.0) |
| Influenza B |
101 |
0 (0.0) |
101 |
0 (0.0) |
101 |
0 (0.0) |
The majority of recently circulating influenza viruses are susceptible to the neuraminidase inhibitor antiviral medications, oseltamivir, zanamivir, and peramivir; however, rare sporadic instances of oseltamivir-resistant and peramivir-resistant influenza A (H1N1)pdm09 viruses and oseltamivir-resistant influenza A (H3N2) viruses have been detected worldwide. Antiviral treatment as early as possible is recommended for patients with confirmed or suspected influenza who have severe, complicated, or progressive illness; who require hospitalization; or who are at high risk for serious influenza-related complications. Additional information on recommendations for treatment and chemoprophylaxis of influenza virus infection with antiviral agents is available at http://www.cdc.gov/flu/antivirals/index.htm.
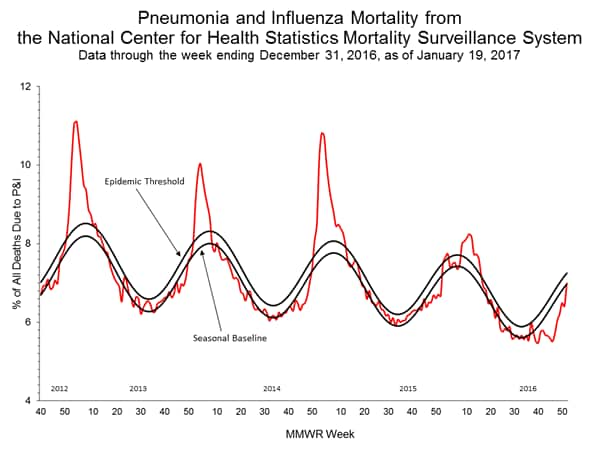
2016-2017 Influenza Season Week 1 ending January 7, 2017: Influenza activity increased in the United States.
Saturday, January 14th, 20172016-2017 Influenza Season Week 1 ending January 7, 2017
All data are preliminary and may change as more reports are received.
Synopsis:
During week 1 (January 1-7, 2017), influenza activity increased in the United States.
- Viral Surveillance: The most frequently identified influenza virus subtype reported by public health laboratories during week 1 was influenza A (H3). The percentage of respiratory specimens testing positive for influenza in clinical laboratories increased.
- Pneumonia and Influenza Mortality: The proportion of deaths attributed to pneumonia and influenza (P&I) was below the system-specific epidemic threshold in the National Center for Health Statistics (NCHS) Mortality Surveillance System.
- Influenza-associated Pediatric Deaths: Three influenza-associated pediatric deaths were reported.
- Influenza-associated Hospitalizations: A cumulative rate for the season of 7.1 laboratory-confirmed influenza-associated hospitalizations per 100,000 population was reported.
- Outpatient Illness Surveillance: The proportion of outpatient visits for influenza-like illness (ILI) was 3.2%, which is above the national baseline of 2.2%. All 10 regions reported ILI at or above their region-specific baseline levels. New York City, Puerto Rico, and eight states experienced high ILI activity; six states experienced moderate ILI activity; seven states experienced low ILI activity; 28 states experienced minimal ILI activity, and the District of Columbia and one state had insufficient data.
- Geographic Spread of Influenza: The geographic spread of influenza in Puerto Rico and 21 states was reported as widespread; Guam and 21 states reported regional activity; the District of Columbia and eight states reported local activity; and the U.S. Virgin Islands reported no activity.
National and Regional Summary of Select Surveillance Components
| HHS Surveillance Regions* | Data for current week | Data cumulative since October 2, 2016 (week 40) | ||||||||
|---|---|---|---|---|---|---|---|---|---|---|
| Out-patient ILI† | Number of jurisdictions reporting regional or widespread activity§ | % respiratory specimens positive for flu in clinical laboratories‡ | A(H1N1)pdm09 | A (H3) | A (Subtyping not Performed) <!–(Subtyping not performed)–> |
B Victoria lineage | B Yamagata lineage | B lineage not performed | Pediatric Deaths | |
| Influenza test results from public health laboratories only | ||||||||||
| Nation | Elevated | 44 of 54 | 13.9% | 177 | 5,261 | 134 | 174 | 123 | 147 | 3 |
| Region 1 | Elevated | 5 of 6 | 11.6% | 15 | 266 | 0 | 0 | 3 | 5 | 0 |
| Region 2 | Elevated | 3 of 4 | 15.5% | 1 | 285 | 8 | 16 | 8 | 20 | 0 |
| Region 3 | Elevated | 4 of 6 | 9.6% | 17 | 651 | 10 | 21 | 25 | 14 | 0 |
| Region 4 | Elevated | 6 of 8 | 12.1% | 15 | 355 | 16 | 17 | 12 | 66 | 1 |
| Region 5 | Elevated | 5 of 6 | 7.2% | 17 | 659 | 13 | 60 | 23 | 15 | 0 |
| Region 6 | Elevated | 4 of 5 | 8.0% | 21 | 124 | 0 | 11 | 8 | 8 | 1 |
| Region 7 | Elevated | 2 of 4 | 7.9% | 5 | 204 | 10 | 12 | 13 | 4 | 1 |
| Region 8 | Elevated | 6 of 6 | 16.8% | 32 | 608 | 8 | 9 | 11 | 0 | 0 |
| Region 9 | Elevated | 5 of 5 | 10.4% | 52 | 1,522 | 64 | 21 | 20 | 8 | 0 |
| Region 10 | Elevated | 4 of 4 | 29.8% | 2 | 587 | 5 | 7 | 0 | 7 | 0 |
*HHS regions (Region 1 CT, ME, MA, NH, RI, VT; Region 2: NJ, NY, Puerto Rico, US Virgin Islands; Region 3: DE, DC, MD, PA, VA, WV; Region 4: AL, FL, GA, KY, MS, NC, SC, TN; Region 5: IL, IN, MI, MN, OH, WI; Region 6: AR, LA, NM, OK, TX; Region 7: IA, KS, MO, NE; Region 8: CO, MT, ND, SD, UT, WY; Region 9: AZ, CA, Guam, HI, NV; and Region 10: AK, ID, OR, WA).
† Elevated means the % of visits for ILI is at or above the national or region-specific baseline
§ Includes all 50 states, the District of Columbia, Guam, Puerto Rico, and U.S. Virgin Islands
‡ National data are for current week; regional data are for the most recent three weeks
U.S. Virologic Surveillance:
WHO and NREVSS collaborating laboratories, which include both public health and clinical laboratories located in all 50 states, Puerto Rico, and the District of Columbia, report to CDC the total number of respiratory specimens tested for influenza and the number positive for influenza by virus type. In addition, public health laboratories also report the influenza A subtype (H1 or H3) and influenza B lineage information for the viruses they test and the age or age group of the persons from whom the specimens were collected.
Additional data are available at http://gis.cdc.gov/grasp/fluview/fluportaldashboard.html and http://gis.cdc.gov/grasp/fluview/flu_by_age_virus.html.
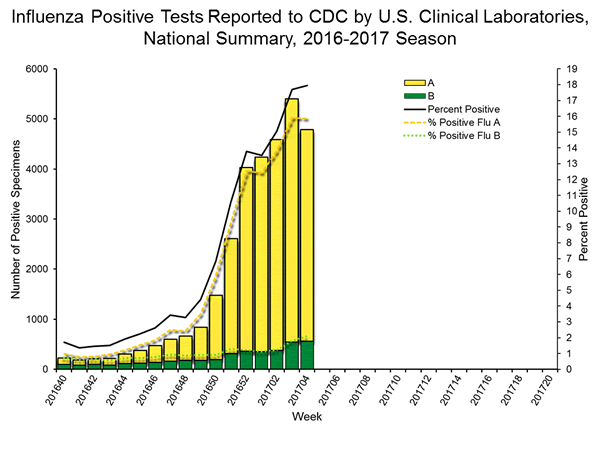
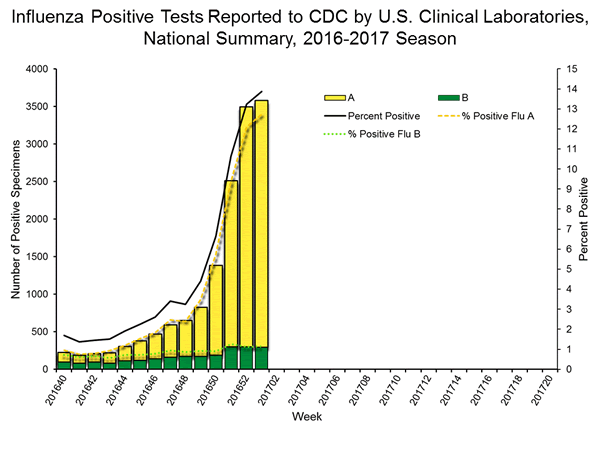
The results of tests performed by clinical laboratories during the current week are summarized below.
| Week 1 | Data Cumulative since October 2, 2016 (Week 40) |
|
|---|---|---|
| No. of specimens tested | 25,797 | 259,647 |
| No. of positive specimens (%) | 3,580 (13.9%) | 15,026 (5.8%) |
| Positive specimens by type | ||
| Influenza A | 3,287 (91.8%) | 12,709 (84.6%) |
| Influenza B | 293 (8.2%) | 2,317 (15.4%) |
The results of tests performed by public health laboratories, as well as the age group distribution of influenza positive tests, during the current week are summarized below.
| Week 1 | Data Cumulative since October 2, 2016 (Week 40) |
|
|---|---|---|
| No. of specimens tested | 1,973 | 21,365 |
| No. of positive specimens* | 928 | 6,016 |
| Positive specimens by type/subtype | ||
| Influenza A | 885 (95.4%) | 5,572 (92.6%) |
| A(H1N1)pmd09 | 21 (2.4%) | 177 (3.2%) |
| H3 | 833 (94.1%) | 5,261 (94.4%) |
| Subtyping not performed | 31 (3.5%) | 134 (2.4%) |
| Influenza B | 43 (4.6%) | 444 (7.4%) |
| Yamagata lineage | 15 (34.9%) | 123 (27.7%) |
| Victoria lineage | 12 (27.9%) | 174 (39.2%) |
| Lineage not performed | 16 (37.2%) | 147 (33.1%) |
*The percent of specimens testing positive for influenza is not reported because public health laboratories often receive samples that have already tested positive for influenza at a clinical laboratory and therefore percent positive would not be a valid indicator of influenza activity. Additional information is available at http://www.cdc.gov/flu/weekly/overview.htm.
Novel Influenza A Virus:
One human infection with a novel influenza A virus was reported during week 51. The person was infected with an avian lineage influenza A (H7N2) virus. This person reported close, prolonged unprotected exposure to the respiratory secretions of infected, sick cats at an affected New York City animal shelter. This is the first influenza A (H7N2) virus infection in humans identified in the United States since 2003 and the first known human infection with an influenza A virus likely acquired through exposure to an ill cat. The patient was mildly ill, was not hospitalized, and has recovered completely. No human-to-human transmission has been identified.
An outbreak of avian lineage influenza A (H7N2) virus infection among cats in an animal shelter in New York City was first reported to public health on December 14, 2016. The New York City Department of Health and Mental Hygiene (DOHMH) issued a press release on December 22 that can be found here: http://www1.nyc.gov/site/doh/about/press/pr2016/pr107-16.page .
Early identification and investigation of human infections with novel influenza A viruses are critical so that the risk of infection can be more fully understood and appropriate public health measures can be taken. Additional information on influenza in cats can be found here (https://www.cdc.gov/flu/fluincats/index.htm)
and a web spotlight on avian influenza A (H7N2) in cats in animal shelters in NY can be found here (https://www.cdc.gov/flu/spotlights/avian-influenza-cats.htm)
.
!–>
Influenza Virus Characterization:
CDC characterizes influenza viruses through one or more tests including genomic sequencing, hemagglutination inhibition (HI) and/or neutralization assays. These data are used to compare how similar currently circulating influenza viruses are to the reference viruses used for developing influenza vaccines, and to monitor for changes in circulating influenza viruses. Historically, HI data have been used most commonly to assess the similarity between reference viruses and circulating viruses to suggest how well the vaccine may work until such a time as vaccine effectiveness estimates are available.
For nearly all virus positive surveillance samples received at CDC, next-generation sequencing is performed to ascertain genomic data of circulating influenza viruses. Viruses can be classified into genetic groups/clades based on analysis of their HA gene segments using phylogenetics and key amino acid changes (Klimov Vaccine 2012).
A proportion of influenza A (H3N2) viruses don’t yield sufficient hemagglutination titers for antigenic characterization using the hemagglutination inhibition test. Therefore, CDC selects a subset of influenza A (H3N2) viruses to test using a focus reduction assay for supplementary antigenic characterization.
Genetic Characterization
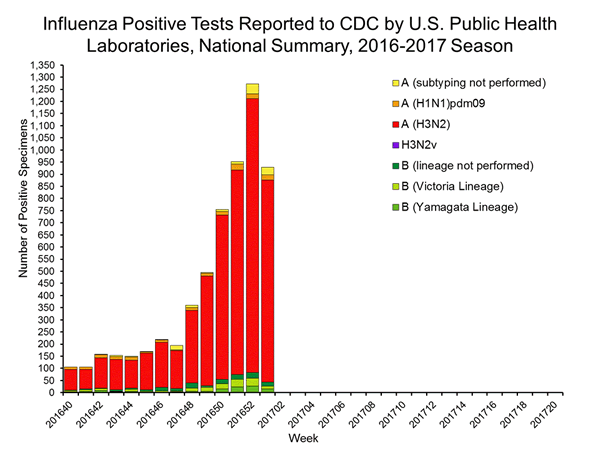
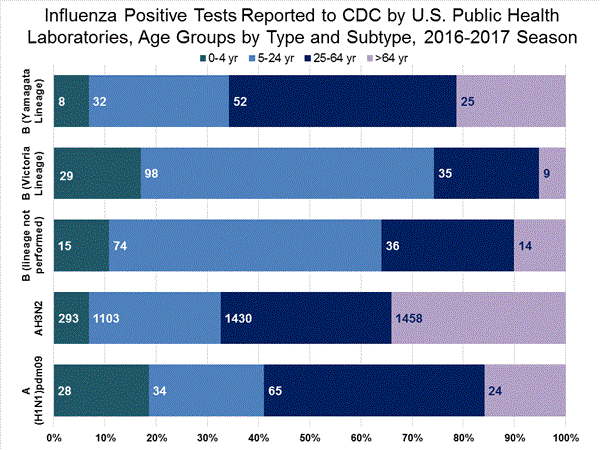
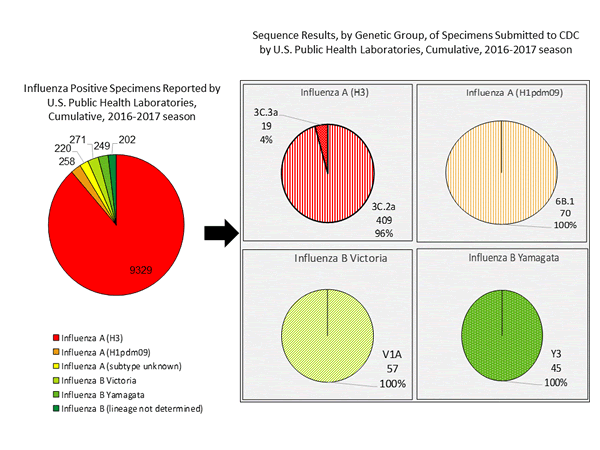
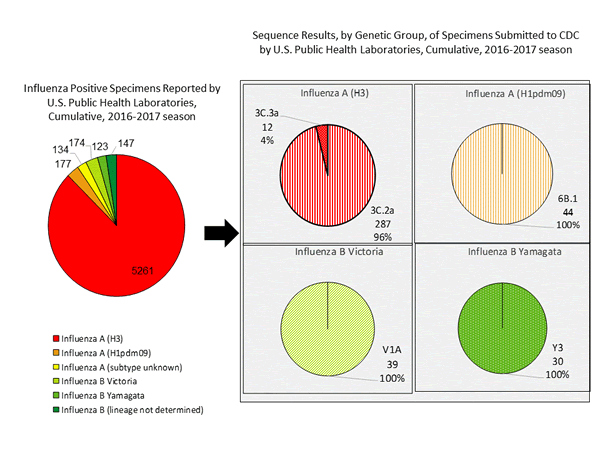
During the 2016-2017 season, 6,016 influenza positive specimens have been collected and reported by public health laboratories in the United States (figure, left). CDC genetically characterized 412 influenza viruses [44 influenza A (H1N1)pdm09, 299 influenza A (H3N2), and 69 influenza B viruses] collected by U.S. laboratories. The HA gene segment of all influenza A (H1N1)pdm09 viruses analyzed belonged to genetic group 6B.1. Influenza A (H3N2) virus HA gene segments analyzed belonged to genetic groups 3C.2a or 3C.3a. Genetic group 3C.2a includes a newly emerging subgroup known as 3C.2a1. The HA of influenza B/Victoria-lineage viruses all belonged to genetic group V1A. The HA of influenza B/Yamagata-lineage viruses analyzed all belonged to genetic group Y3.
The majority of U.S. viruses submitted for characterization come from state and local public health laboratories. Due to Right Size Roadmap considerations, specimen submission guidance issued to the laboratories request that, if available, 2 influenza A (H1N1), 2 A influenza (H3N2), and 2 influenza B viruses be submitted every other week. Because of this, the number of each virus type/subtype characterized should be approximately equal. In the figure below, the results of tests performed by public health labs are presented on the left and sequence results by genetic group of specimens submitted to CDC are presented on the right.
Antigenic Characterization
CDC has antigenically characterized 235 influenza viruses [37 influenza A (H1N1)pdm09, 139 influenza A (H3N2), and 59 influenza B viruses] collected by U.S. laboratories since October 1, 2016.
Influenza A Virus [176]
- A (H1N1)pdm09 [37]: All 37 (100%) influenza A (H1N1)pdm09 viruses were antigenically characterized using ferret post-infection antisera as A/California/7/2009-like, the influenza A (H1N1) component of the 2016-2017 Northern Hemisphere vaccine.
- A (H3N2) [139]: 132 of 139 (95.0%) influenza A (H3N2) viruses were antigenically characterized as A/Hong Kong/4801/2014-like, a virus that belongs in genetic group 3C.2a and is the influenza A (H3N2) component of the 2016-2017 Northern Hemisphere vaccine, by HI testing or neutralization testing. Among the viruses which reacted poorly with ferret antisera raised against A/Hong Kong/4801/2014-like viruses, 6 out of 7 (85.7%) are more closely related to A/Switzerland/9715293/2013, a virus belonging to genetic group 3C.3a.
Influenza B Virus [59]
- Victoria Lineage [31]: 28 of 31 (90.3%) B/Victoria-lineage viruses were antigenically characterized using ferret post-infection antisera as B/Brisbane/60/2008-like, which is included as an influenza B component of the 2016-2017 Northern Hemisphere trivalent and quadrivalent influenza vaccines.
- Yamagata Lineage [28]: All 28 (100%) B/Yamagata-lineage viruses were antigenically characterized using ferret post-infection antisera as B/Phuket/3073/2013-like, which is included as an influenza B component of the 2016-2017 Northern Hemisphere quadrivalent influenza vaccines.
<!–*CDC routinely uses hemagglutination inhibition (HI) assays to antigenically characterize influenza viruses year-round to compare how similar currently circulating influenza viruses are to those included in the influenza vaccine, and to monitor for changes in circulating influenza viruses. However, a portion of recent influenza A(H3N2) viruses do not grow to sufficient hemagglutination titers for antigenic characterization by HI. For many of these viruses, CDC is also performing genetic characterization to infer antigenic properties.–> <!–
2016-2017 Influenza Season – U.S. Influenza Vaccine Composition:
The World Health Organization (WHO) has recommended vaccine viruses for the 2016-2017 influenza season Northern Hemisphere vaccine composition, and the Food and Drug Administration’s Vaccines and Related Biological Products Advisory Committee (VRBPAC) has made the vaccine composition recommendation to be used in the United States. Both agencies recommend that trivalent vaccines contain an A/California/7/2009 (H1N1)pdm09-like virus, an A/Switzerland/9715293/2013 (H3N2)-like virus, and a B/Phuket/3073/2013-like (B/Yamagata lineage) virus. It is recommended that quadrivalent vaccines, which have two influenza B viruses, contain the viruses recommended for the trivalent vaccines, as well as a B/Brisbane/60/2008-like (B/Victoria lineage) virus. This represents a change in the influenza A (H3) and influenza B (Yamagata lineage) components compared with the composition of the 2016-2017 influenza vaccine. These vaccine recommendations were based on several factors, including global influenza virologic and epidemiologic surveillance, genetic characterization, antigenic characterization, antiviral resistance, and the candidate vaccine viruses that are available for production.
–>
Antiviral Resistance:
Testing of influenza A (H1N1)pdm09, influenza A (H3N2), and influenza B virus isolates for resistance to neuraminidase inhibitors (oseltamivir, zanamivir, and peramivir) is performed at CDC using a functional assay. Additional influenza A (H1N1)pdm09 and influenza A (H3N2) clinical samples are tested for mutations of the virus known to confer oseltamivir resistance. The data summarized below combine the results of both testing methods. These samples are routinely obtained for surveillance purposes rather than for diagnostic testing of patients suspected to be infected with antiviral-resistant virus.
High levels of resistance to the adamantanes (amantadine and rimantadine) persist among influenza A (H1N1)pdm09 and influenza A (H3N2) viruses (the adamantanes are not effective against influenza B viruses). Therefore, data from adamantane resistance testing are not presented below.
|
Oseltamivir |
Zanamivir |
Peramivir |
||||
|---|---|---|---|---|---|---|
|
Virus Samples tested (n) |
Resistant Viruses, Number (%) |
Virus Samples tested (n) |
Resistant Viruses, Number (%) |
Virus Samples tested (n) |
Resistant Viruses, Number (%) |
|
| Influenza A (H1N1)pdm09 |
51 |
0 (0.0) |
51 |
0 (0.0) |
51 |
0 (0.0) |
| Influenza A (H3N2) |
317 |
0 (0.0) |
317 |
0 (0.0) |
251 |
0 (0.0) |
| Influenza B |
81 |
0 (0.0) |
81 |
0 (0.0) |
81 |
0 (0.0) |
The majority of recently circulating influenza viruses are susceptible to the neuraminidase inhibitor antiviral medications, oseltamivir, zanamivir, and peramivir; however, rare sporadic instances of oseltamivir-resistant and peramivir-resistant influenza A (H1N1)pdm09 viruses and oseltamivir-resistant influenza A (H3N2) viruses have been detected worldwide. Antiviral treatment as early as possible is recommended for patients with confirmed or suspected influenza who have severe, complicated, or progressive illness; who require hospitalization; or who are at high risk for serious influenza-related complications. Additional information on recommendations for treatment and chemoprophylaxis of influenza virus infection with antiviral agents is available at http://www.cdc.gov/flu/antivirals/index.htm.
Pneumonia and Influenza (P&I) Mortality Surveillance:
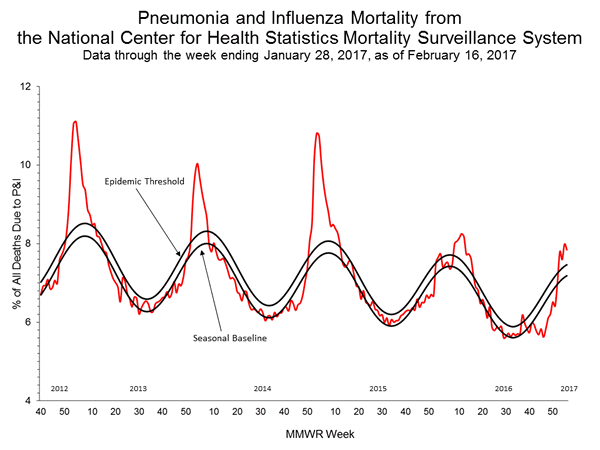
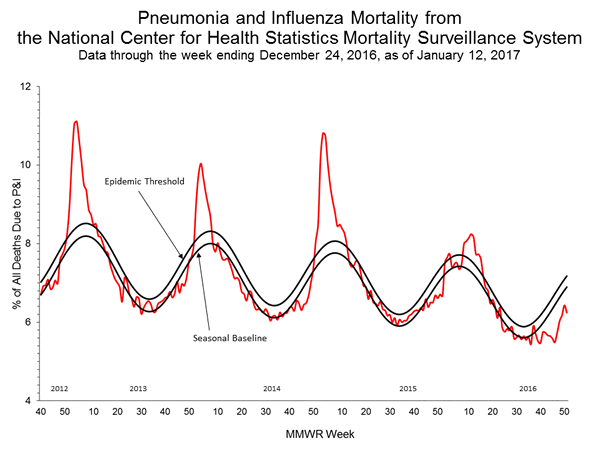
Based on National Center for Health Statistics (NCHS) mortality surveillance data available on January 12, 2017, 6.2% of the deaths occurring during the week ending December 24, 2016 (week 51) were due to P&I. This percentage is below the epidemic threshold of 7.2% for week 51.
Background: Weekly mortality surveillance data includes a combination of machine coded and manually coded causes of death collected from death certificates. There is a backlog of data requiring manual coding within NCHS mortality surveillance data. The percentages of deaths due to P&I are higher among manually coded records than more rapidly available machine coded records and may result in initially reported P&I percentages that are lower than percentages calculated from final data. Efforts continue to reduce and monitor the number of records awaiting manual coding.
Beginning in the week ending October 8, 2016 (week 40), CDC retired the 122 Cities Mortality Reporting System and uses only the NCHS Mortality Surveillance System.
Region and state-specific data are available at http://gis.cdc.gov/grasp/fluview/mortality.html.
Influenza-Associated Pediatric Mortality:
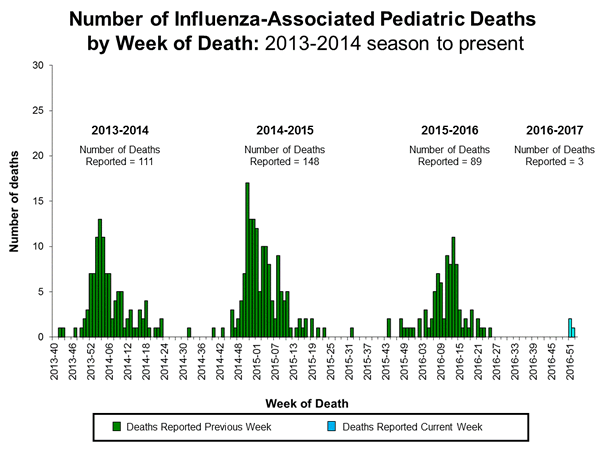
Three influenza-associated pediatric deaths were reported to CDC during week 1. One death was associated with an influenza A (H3) virus and occurred during week 51 (the week ending December 24, 2016). One death was associated with an influenza A virus for which no subtyping was performed and occurred during week 52 (the week ending December 31, 2016). One death was associated with an influenza B virus and occurred during week 51.
A total of three influenza-associated pediatric deaths have been reported for the 2016-2017 season.
Additional data can be found at: http://gis.cdc.gov/GRASP/Fluview/PedFluDeath.html.
Influenza-Associated Hospitalizations:
The Influenza Hospitalization Surveillance Network (FluSurv-NET) conducts population-based surveillance for laboratory-confirmed influenza-related hospitalizations in children younger than 18 years of age (since the 2003-2004 influenza season) and adults (since the 2005-2006 influenza season).
The FluSurv-NET covers more than 70 counties in the 10 Emerging Infections Program (EIP) states (CA, CO, CT, GA, MD, MN, NM, NY, OR, and TN) and additional Influenza Hospitalization Surveillance Project (IHSP) states. The IHSP began during the 2009-2010 season to enhance surveillance during the 2009 H1N1 pandemic. IHSP sites included IA, ID, MI, OK and SD during the 2009-2010 season; ID, MI, OH, OK, RI, and UT during the 2010-2011 season; MI, OH, RI, and UT during the 2011-2012 season; IA, MI, OH, RI, and UT during the 2012-2013 season; and MI, OH, and UT during the 2013-2014, 2014-2015, 2015-2016, and 2016-2017 seasons.
Data gathered are used to estimate age-specific hospitalization rates on a weekly basis, and describe characteristics of persons hospitalized with severe influenza illness. The rates provided are likely to be an underestimate as influenza-related hospitalizations can be missed, either because testing is not performed, or because cases may be attributed to other causes of pneumonia or other common influenza-related complications.
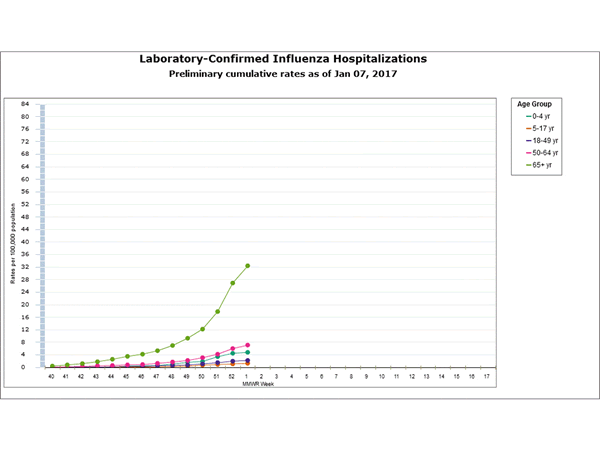
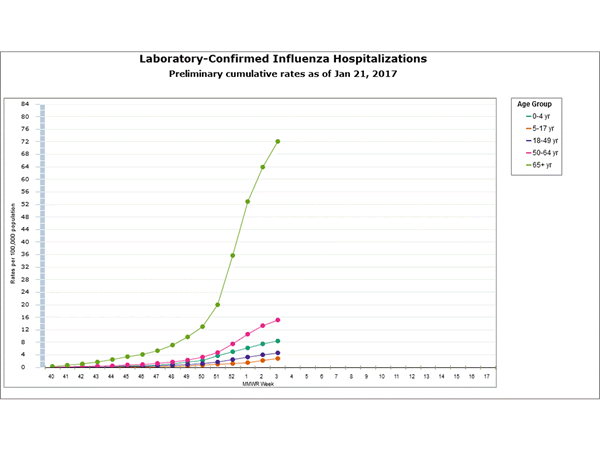
Between October 1, 2016 and January 7, 2017, 1,992 laboratory-confirmed influenza-associated hospitalizations were reported. The overall hospitalization rate was 7.1 per 100,000 population. The highest rate of hospitalization was among adults aged ≥65 years (32.4 per 100,000 population), followed by adults aged 50-64 (7.1 per 100,000 population) and children aged 0-4 years (4.8 per 100,000 population). Among 1,992 hospitalizations, 1,774 (89.1%) were associated with influenza A virus, 184 (9.2%) with influenza B virus, 11 (0.6%) with influenza A virus and influenza B virus co-infection, and 23 (1.2%) with influenza virus for which the type was not determined. Among those with influenza A subtype information, 493 (98.4%) were A(H3N2) and 8 (1.6%) were A(H1N1)pdm09 virus.
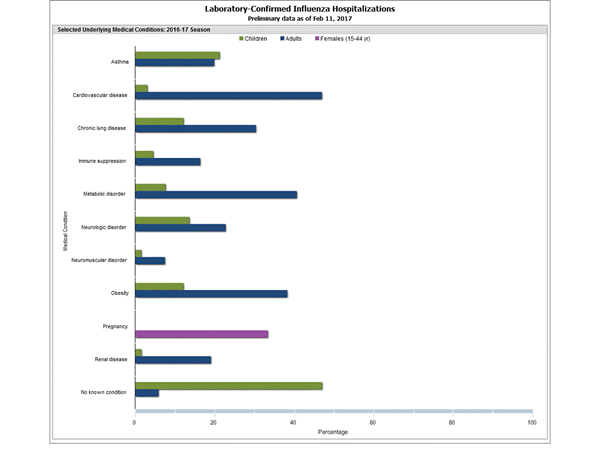
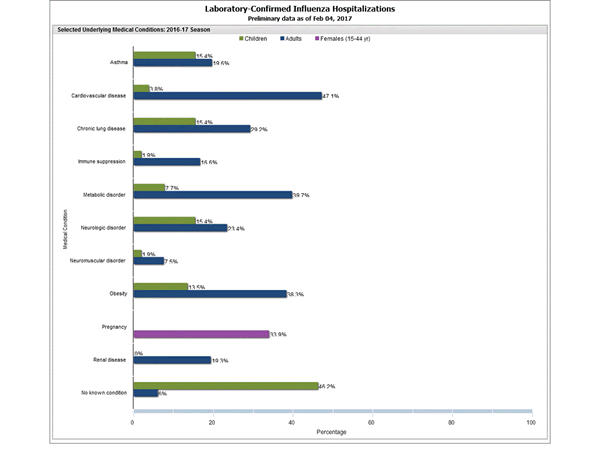
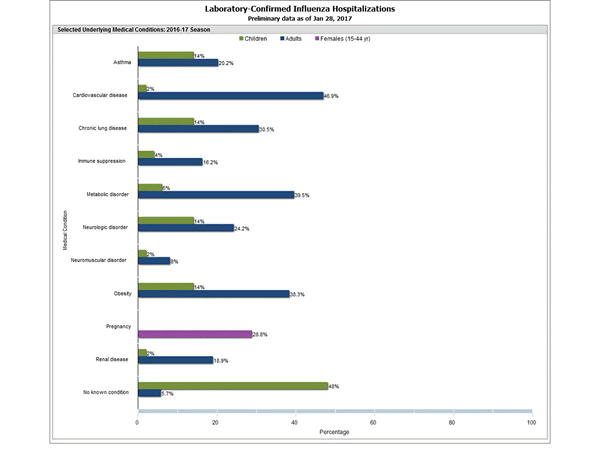
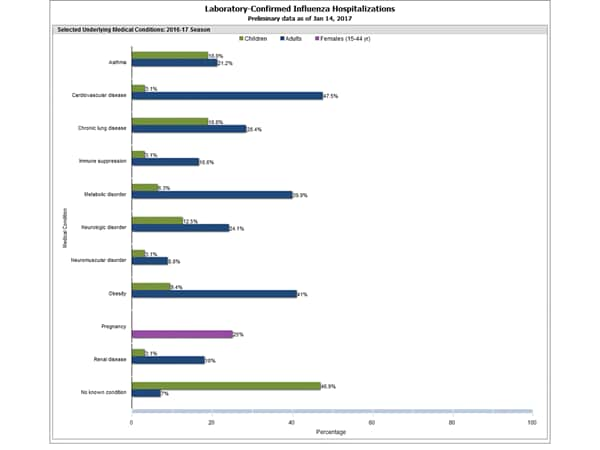
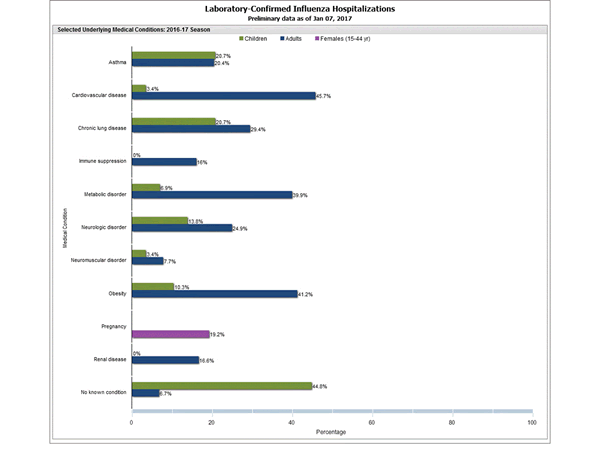
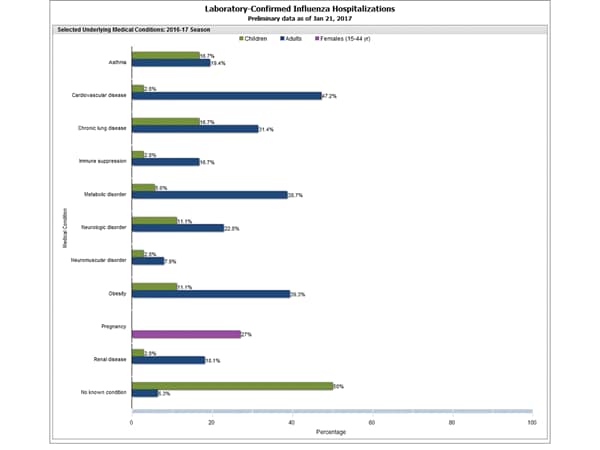
Clinical findings are preliminary and based on 336 (16.7%) cases with complete medical chart abstraction. Among 307 hospitalized adults with complete medical chart abstraction, 289 (94.1%) had at least one reported underlying medical condition; the most commonly reported were cardiovascular disease, obesity, and metabolic disorders. Among 29 hospitalized children with complete medical chart abstraction, 16 (55.2%) had at least one underlying medical condition; the most commonly reported were asthma and chronic lung disease. Among the 24 hospitalized women of childbearing age (15-44 years), 5 (15.8%) were pregnant.
Additional FluSurv-NET data can be found at: http://gis.cdc.gov/GRASP/Fluview/FluHospRates.html and http://gis.cdc.gov/grasp/fluview/FluHospChars.html.
Data from the Influenza Hospitalization Surveillance Network (FluSurv-NET), a population-based surveillance for influenza related hospitalizations in children and adults in 13 U.S. states. Cumulative incidence rates are calculated using the National Center for Health Statistics’ (NCHS) population estimates for the counties included in the surveillance catchment area.
FluSurv-NET data are preliminary and displayed as they become available. Therefore, figures are based on varying denominators as some variables represent information that may require more time to be collected. Data are refreshed and updated weekly. Asthma includes a medical diagnosis of asthma or reactive airway disease; Cardiovascular diseases include conditions such as coronary heart disease, cardiac valve disorders, congestive heart failure, and pulmonary hypertension; does not include isolated hypertension; Chronic lung diseases include conditions such as chronic obstructive pulmonary disease, bronchiolitis obliterans, chronic aspiration pneumonia, and interstitial lung disease; Immune suppression includes conditions such as immunoglobulin deficiency, leukemia, lymphoma, HIV/AIDS, and individuals taking immunosuppressive medications; Metabolic disorders include conditions such as diabetes mellitus; Neurologic diseases include conditions such as seizure disorders, cerebral palsy, and cognitive dysfunction; Neuromuscular diseases include conditions such as multiple sclerosis and muscular dystrophy; Obesity was assigned if indicated in patient’s medical chart or if body mass index (BMI) >30 kg/m2; Pregnancy percentage calculated using number of female cases aged between 15 and 44 years of age as the denominator; Renal diseases include conditions such as acute or chronic renal failure, nephrotic syndrome, glomerulonephritis, and impaired creatinine clearance; No known condition indicates that the case did not have any known high risk medical condition indicated in medical chart at the time of hospitalization.
Outpatient Illness Surveillance:
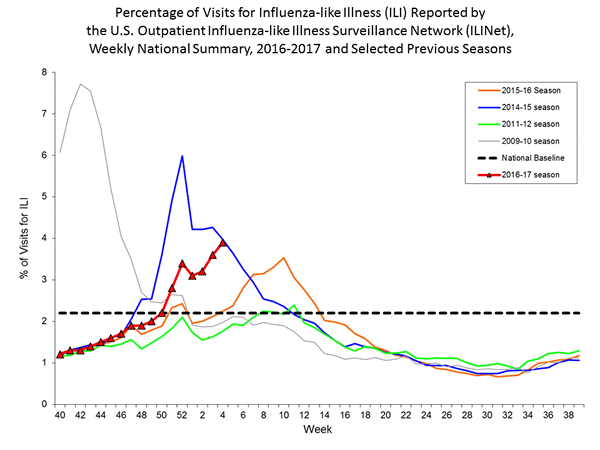
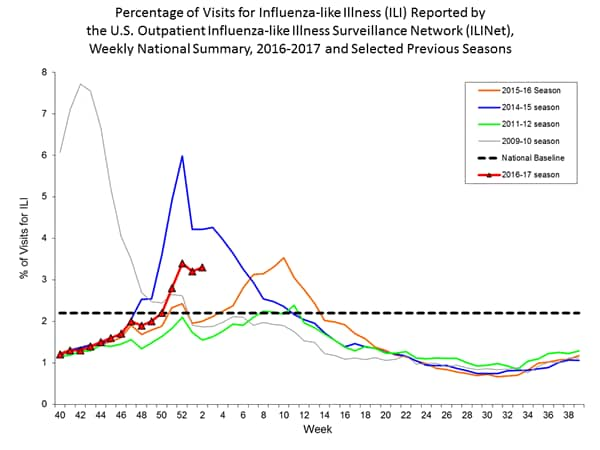
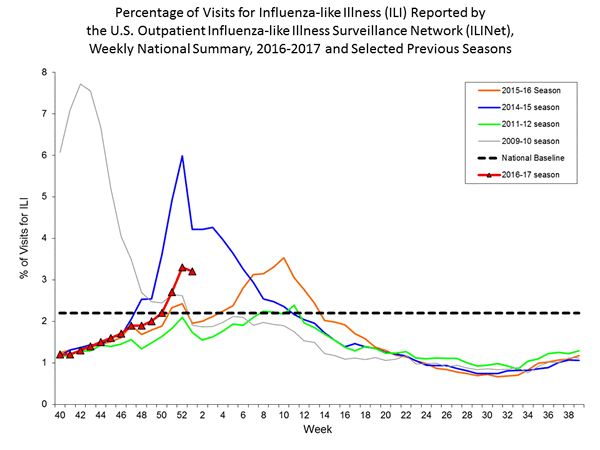
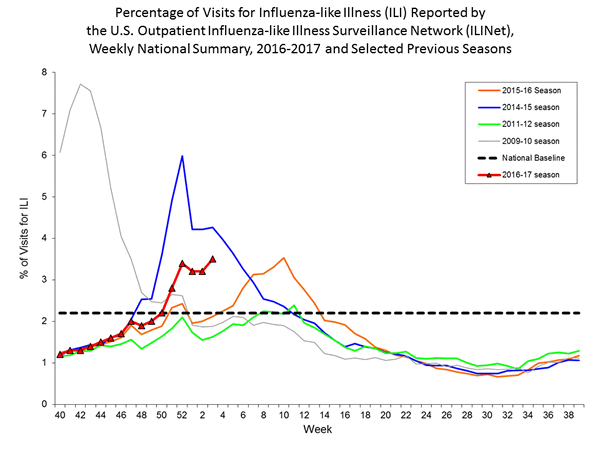
Nationwide during week 1, 3.2% of patient visits reported through the U.S. Outpatient Influenza-like Illness Surveillance Network (ILINet) were due to influenza-like illness (ILI). This percentage is above the national baseline of 2.2%.
(ILI is defined as fever (temperature of 100°F [37.8°C] or greater) and cough and/or sore throat.)
The increase in the percentage of patient visits for ILI may be influenced in part by a reduction in routine healthcare visits during the holidays, as has occurred in previous seasons.
Additional data are available at http://gis.cdc.gov/grasp/fluview/fluportaldashboard.html.
On a regional level, the percentage of outpatient visits for ILI ranged from 1.7% to 5.9% during week 1. All ten regions reported a proportion of outpatient visits for ILI at or above their region-specific baseline levels.
ILINet State Activity Indicator Map:
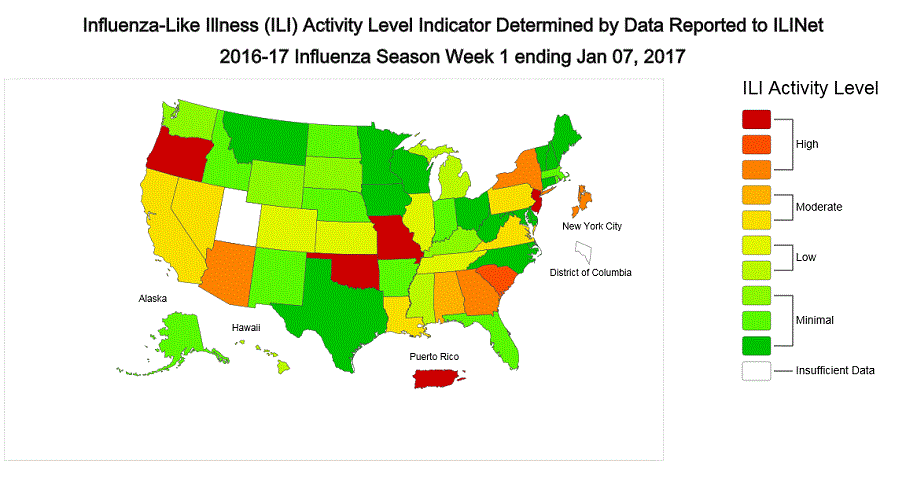
Data collected in ILINet are used to produce a measure of ILI activity* by state. Activity levels are based on the percent of outpatient visits in a state due to ILI and are compared to the average percent of ILI visits that occur during weeks with little or no influenza virus circulation. Activity levels range from minimal, which would correspond to ILI activity from outpatient clinics being below, or only slightly above, the average, to high, which would correspond to ILI activity from outpatient clinics being much higher than average.
During week 1, the following ILI activity levels were experienced:
- New York City, Puerto Rico, and eight states (Arizona, Georgia, Missouri, New Jersey, New York, Oklahoma, Oregon, and South Carolina) experienced high ILI activity.
- Six states (Alabama, California, Louisiana, Nevada, Pennsylvania, and Virginia) experienced moderate ILI activity.
- Seven states (Colorado, Hawaii, Illinois, Kansas, Michigan, Mississippi, and Tennessee) experienced low ILI activity.
- 28 states (Alaska, Arkansas, Connecticut, Delaware, Florida, Idaho, Indiana, Iowa, Kentucky, Maine, Maryland, Massachusetts, Minnesota, Montana, Nebraska, New Hampshire, New Mexico, North Carolina, North Dakota, Ohio, Rhode Island, South Dakota, Texas, Vermont, Washington, West Virginia, Wisconsin, and Wyoming) experienced minimal ILI activity.
- Data were insufficient to calculate an ILI activity level from the District of Columbia and one state (Utah).
<!–
View
Chart Data | View Full Screen
–>
*This map uses the proportion of outpatient visits to health care providers for ILI to measure the ILI activity level within a state. It does not, however, measure the extent of geographic spread of flu within a state. Therefore, outbreaks occurring in a single city could cause the state to display high activity levels.
Data collected in ILINet may disproportionally represent certain populations within a state, and therefore, may not accurately depict the full picture of influenza activity for the whole state.
Data displayed in this map are based on data collected in ILINet, whereas the State and Territorial flu activity map is based on reports from state and territorial epidemiologists. The data presented in this map is preliminary and may change as more data are received.
Differences in the data presented here by CDC and independently by some state health departments likely represent differing levels of data completeness with data presented by the state likely being the more complete.
CDC: The impact of annual influenza vaccination and the burden of influenza in the United States for the 2015-2016 influenza season
Monday, December 12th, 2016Estimated Influenza Illnesses, Medical Visits, Hospitalizations, and Deaths Averted by Vaccination in the United States
Introduction:
This web page provides estimates on the impact of annual influenza vaccination and the burden of influenza in the United States for the 2015-2016 influenza season, and will be updated annually.
For the past several years, CDC has used a model to estimate the numbers of influenza illnesses, medical visits, and hospitalizations, and the impact of influenza vaccination on these numbers in the United States (1-5). The methods used to calculate the estimates have been described previously (1,2) and are outlined briefly below. CDC uses the estimates of the burden of influenza in the population and the impact of influenza vaccination in influenza-related communications. Annual estimates on the number of influenza-related illnesses, medical visits, and hospitalizations, will be used to derive a five-year range to characterize the influenza burden in the United States. This range will be updated every five years.
Additionally, this web page provides estimates of influenza deaths and deaths averted by influenza vaccination. CDC calculates estimated influenza deaths in two ways: 1) using reports of pneumonia & influenza (P&I) deaths and 2) using reports of respiratory & circulatory (R&C) deaths attributable to influenza. P&I deaths are now available in real-time, while data on R&C deaths are available after a three-year delay. While both estimates are useful, P&I deaths represent only a fraction of the total number of deaths from influenza because they do not capture the deaths that occurred among people not tested for influenza or deaths that result from respiratory and cardiovascular complications. Calculations based on R&C deaths are used in CDC influenza-related communications materials because these calculations provide a more complete estimate of the actual burden of influenza. CDC will continue to present the mortality burden of influenza as a range, rather than a median or average, to better reflect the variability of influenza and will update estimates of R&C deaths as the data become available.
2015-2016 Estimates:
For the 2015-2016 influenza season, CDC estimates that influenza vaccination prevented approximately 5.1 million influenza illnesses, 2.5 million influenza-associated medical visits, and 71,000 influenza-associated hospitalizations (see Table 1). These estimates of averted disease burden are comparable to some previous seasons (see Table 2). During the 2015-2016 influenza season, CDC estimates that influenza vaccination prevented 3,000 P&I deaths (see Table 1). This estimate is similar to estimates of averted P&I deaths during previous seasons (see Table 2). Past comparative data suggest that for the 2015-2016 season the total number of influenza-associated R&C deaths prevented by vaccination may be between two and four times greater than estimates using only P&I deaths (see Table 2).
To calculate these estimates, CDC used 2015-2016 estimates of influenza vaccination coverage(https://www.cdc.gov/flu/fluvaxview/index.htm) (32.2% to 69.7%, depending on age group), vaccine effectiveness(https://www.cdc.gov/flu/professionals/vaccination/effectiveness-studies.htm#table) (24% to 57%, depending on age group), and influenza hospitalizations rates (20.3 per 100,000 to 321.1 per 100,000, depending on age group and adjusted for influenza testing and test sensitivity).
2015-2016 Discussion:
During the 2015-2016 season, influenza A (H3N2) viruses circulated early in the season but influenza A (H1N1)pdm09 viruses predominated overall (6). The season was notable because influenza activity peaked in mid-March, 2016; one of the later peaks on record. In the United States influenza activity most commonly peaks between December and February. The overall burden of influenza was substantial with an estimated 25 million influenza illnesses, 11 million influenza-associated medical visits, 310,000 influenza-related hospitalizations, and 12,000 P&I deaths (see Table 3). (Note that past comparative data suggest that the total number of influenza-associated R&C deaths may be between two and four times greater than estimates using only P&I deaths). Overall, the burden estimates for last season are lower than the estimated burden for the three previous seasons, but are near the middle of the range for the previous five seasons (see Table 4).
While influenza seasons can vary in severity, during most seasons people 65 years and older experience the greatest burden of severe influenza disease. This was also true for the 2015-2016 season. While people in this age group accounted for only 15% of the U.S. population, they made up 50% of influenza-associated hospitalizations and 64% of P&I deaths during the 2015-2016 season. Influenza vaccination is the best way to prevent influenza virus infection, and among adults 65 years and older CDC estimates that vaccination prevented 23% of influenza-related hospitalizations during the 2015-2016 season. Vaccine coverage dropped by about 3 percentage points in this age group (to about 63%) between the 2014-2015 and 2015-2016 influenza seasons (7). Such drops in influenza vaccination coverage are costly for older adults, who are at high risk of serious influenza-related complications. If, instead of declining, vaccine coverage had increased by just 5 percentage point in this age group, an additional 36,000 illnesses and more than 3,000 additional hospitalizations could have been prevented during the 2015-2016 season.
The fraction of averted illness from vaccination was lowest among the broader range of working-age adults, aged 18 to 64 years, owing to low vaccination coverage in general in this age group, a drop in vaccine coverage among people 50 to 64 years old, and lower vaccine effectiveness among people 50 to 64 years during the 2015-2016 season (see Table 5). With more than 16 million illnesses from influenza estimated last season and vaccine coverage estimated at 36%, increasing vaccination coverage among persons 18 to 64 years old could have a large impact on reducing illness and work absenteeism. Specifically, if vaccination coverage had increased by 5 percentage points among adults aged 18 to 64 years during the 2015-2016 season, 300,000 additional influenza illnesses and 2,000 additional hospitalizations could have been prevented.
If vaccination rates increased by just 5 percentage points across the entire population, another 500,000 influenza illnesses, 230,000 influenza-associated medical visits, and 6,000 influenza-associated hospitalizations could be prevented. If vaccination rates improved to the Healthy People goal of 70 percent for all age groups, another 2.4 million influenza illnesses and 19,000 influenza-associated hospitalizations could have been prevented. Similarly, improvements to vaccine effectiveness could provide incremental public health benefit.
Strategies to improve vaccine coverage in all ages include ensuring influenza vaccination status is assessed at each heath care encounter during the influenza season (October through May), ensuring that everyone 6 months and older receive a recommendation to get vaccinated and an offer of vaccination from their provider, using standing orders in the health care office, using patient reminder/recall systems aided by immunization information systems, and expanding vaccination access through use of nontraditional settings for vaccination (e.g., pharmacies, workplaces, and schools) to reach persons who might not visit a physician’s office during the influenza season.
Conclusion:
Influenza vaccination during the 2015-2016 influenza season prevented an estimated 5.1 million illnesses, 2.5 million medical visits, 71,000 hospitalizations, and 3,000 P&I deaths. (Note that past comparative data suggest that the total number of influenza-associated R&C deaths prevented by vaccination may be between two and four times greater than estimates using only P&I deaths). Efforts to increase vaccination coverage will further reduce the burden of influenza, especially among working-age adults younger than 65 years, who continue to have the lowest influenza vaccination coverage. This report underscores the benefits of the current vaccination program, but also highlights areas where improvements in vaccine uptake and vaccine effectiveness could deliver even greater benefits to the public’s health.
Although the timing and intensity of influenza virus circulation for the 2016-2017 season cannot be predicted, peak weeks of influenza activity have occurred between December and February during about 75% of seasons over the past 30 years, and significant circulation of influenza viruses can occur as late as May. Therefore, vaccination should be offered to anyone aged ≥6 months by the end of October if possible and for as long as influenza viruses continue to circulate.
Limitations:
These estimates are subject to several limitations. First, influenza vaccination coverage estimates were derived from reports by survey respondents, not vaccination records, and are subject to recall bias. Second, these coverage estimates are based on telephone surveys with relatively low response rates; nonresponse bias may remain after weighting. Estimates of the number of persons vaccinated based on these survey data have often exceeded the actual number of doses distributed, indicating that coverage estimates used in this report may overestimate the numbers of illnesses and hospitalizations averted by vaccination. Third, this model only calculates outcomes directly averted among persons who were vaccinated. If there is indirect protection from decreased exposure to infectious persons in a partially vaccinated population (i.e., herd immunity), the model would underestimate the number of illnesses and hospitalizations prevented by vaccination. Fourth, vaccine effectiveness among adults 65 years and older might continue to decrease with age, reaching very low levels among the oldest adults who also have the highest rates of influenza vaccination; thus, the model might have overestimated the effect in this group. Fifth, due to data availability, we are unable to estimate influenza-associated R&C deaths for the 2014-2015 or 2015-2016 seasons. P&I deaths are a fraction of all deaths associated with influenza. Based on past studies, (8,9) the total number of R&C deaths associated with influenza that occurred during the 2015-2016 season may be two to four times higher than reported P&I deaths. As data on R&C deaths become available CDC will update estimates of influenza-associated deaths (see CDC Study: Flu Vaccine Saved 40,000 Lives During 9 Year Period(https://www.cdc.gov/flu/news/flu-vaccine-saved-lives.htm)).
Previous Estimates:
Previous estimates of the burden of illness, medical visits, and hospitalizations related to influenza are available online and in scientific publications(https://www.cdc.gov/flu/about/disease/burden.htm#flu-related-illness). (1-5) Estimates using the same methodology as for the 2015-2016 season are shown in the tables below to provide context for the current season’s estimates.
The estimates of P&I deaths related to influenza are a fraction of all deaths related to influenza that occurred a given season. Data on the number of R&C deaths are available with a three-year lag and, therefore, are available for the 2010-2011 through 2013-2014 influenza season. Using these data, CDC estimates that influenza-associated R&C deaths have ranged from a low of 12,000 (during 2011-2012) to a high of 56,000 (during 2012-2013).
2015-2016 Tables for Influenza Burden and Burden-Averted Estimates:
Table 1: Estimated number and fraction of influenza illnesses, medical visits, hospitalizations, and pneumonia and influenza deaths averted by vaccination, by age group — United States, 2015-2016 influenza season
| Age (yrs) | Averted illnesses |
Averted medical visits |
Averted hospitalizations |
Averted pneumonia & influenza deaths* |
|||||||
|---|---|---|---|---|---|---|---|---|---|---|---|
| No. | 95% CI | No. | 95% CI | No. | 95% CI | Fraction prevented (%) |
95% CI | No. | 95% CI | ||
| 6 months-4 | 980,052 | 710,239-1,322,705 | 656,635 | 474,202-889,804 | 6,832 | 4,951-9,221 | 32.0 | 27.6-36.9 | 105 | 66-156 | |
| 5-17 | 1,281,134 | 940,148-1,733,726 | 666,190 | 485,103-908,476 | 3,513 | 2,578-4,754 | 24.2 | 21.0-27.8 | 62 | 42-78 | |
| 18-49 | 1,591,114 | 1,264,333-1,999,398 | 588,712 | 465,711-747,321 | 8,931 | 7,097-11,223 | 14.1 | 12.3-15.7 | 236 | 190-285 | |
| 50-64 | 743,725 | 360,432-1,209,238 | 319,802 | 153,599-527,189 | 7,887 | 3,822-12,824 | 9.5 | 4.92-14.3 | 261 | 123-423 | |
| ≥65 | 487,473 | 262,848-816,276 | 272,985 | 147,356-460,045 | 44,316 | 23,895-74,207 | 22.5 | 13.5-31.4 | 2,217 | 1,167-3,620 | |
| All ages | 5,083,498 | 3,538,000-7,081,344 | 2,504,323 | 1,725,971-3,532,835 | 71,479 | 42,344-112,228 | 18.9 | 14.3-24.2 | 2,882 | 1,588-4,562 | |
*Only data on pneumonia & influenza deaths are available in real-time during an influenza season; however, these are only a subset of the total deaths associated with influenza, which may be 2 to 4 times higher when other complications are also considered.
Table 2: Estimated number and fraction of influenza illnesses, medical visits, hospitalizations, and pneumonia and influenza deaths averted by vaccination, by season— United States, 2010-11 through 2015-16 influenza seasons
| Season | Averted illnesses |
Averted medical visits |
Averted hospitalizations |
Averted deaths | ||||||||
|---|---|---|---|---|---|---|---|---|---|---|---|---|
| Pneumonia & influenza deaths* |
Respiratory & circulatory deaths† |
|||||||||||
| No. | 95% CI | No. | 95% CI | No. | 95% CI | Fraction prevented (%) |
95% CI | No. | 95% CI | No. | 95% CI | |
| 2010-2011 | 5,039,277 | 3,435,322-7,716,921 | 2,514,353 | 1,702,599-3,885,779 | 70,821 | 33,965-141,708 | 20.8 | 13.1-30.3 | 3,434 | 1,422-6,906 | 9,880 | 3,883- 19,362 |
| 2011-2012 | 1,981,571 | 1,160,279-3,666,130 | 968,312 | 555,687-1,809,753 | 39,301 | 17,610-88,885 | 22.7 | 13.0-34.0 | 1,227 | 505-2,450 | 3,618 | 1,400- 6,909 |
| 2012-2013 | 5,628,332 | 4,235,767-8,327,082 | 2,701,875 | 1,997,056-4,085,452 | 61,522 | 31,580-162,836 | 11.1 | 6.25-19.6 | 1,823 | 724-5,517 | 5,280 | 2,149- 15,029 |
| 2013-2014 | 6,683,929 | 5,037,991-8,898,309 | 3,080,284 | 2,252,594-4,190,948 | 86,730 | 56,447-129,736 | 21.5 | 17.2-26.1 | 3,840 | 2,298-5,844 | 9,172 | 5,267- 14,465 |
| 2014-2015 | 1,606,813 | 609,744-3,456,741 | 792,958 | 296,449-1,744,001 | 47,449 | 10,795-144,291 | 7.5 | 2.09-15.9 | 1,419 | 312-4,255 | – | – |
| 2015-2016 | 5,083,498 | 3,538,000-7,081,344 | 2,504,323 | 1,725,971-3,532,835 | 71,479 | 42,344-112,228 | 18.9 | 14.3-24.2 | 2,882 | 1,588-4,562 | – | – |
*Only data on pneumonia & influenza deaths are available in real-time during an influenza season; however, these are only a subset of the total deaths associated with influenza that occur each year, which may be 2 to 4 times higher when other complications are also considered.
†Data on respiratory & circulatory deaths are available with a three-year lag; therefore, estimates on averted respiratory & circulatory deaths are only available through 2013-2014 influenza season at this time.
Table 3: Estimated influenza disease burden, by age group — United States, 2015-2016 influenza season
| Age (yrs) | Total population |
Estimated illnesses |
Estimated medical visits |
Estimated hospitalizations |
Estimated excess pneumonia & influenza deaths* |
|||||
|---|---|---|---|---|---|---|---|---|---|---|
| No. | 95% CI | No. | 95% CI | Hosp. rate (per 100,000) |
No. | 95% CI | No. | 95% Cr I† | ||
| <5 | 19,907,281 | 2,207,454 | 1,914,725-2,597,610 | 1,478,994 | 1,271,529-1,757,051 | 77.3 | 15,389 | 13,349-18,109 | 218 | 163-341 |
| 5-17 | 53,737,830 | 3,985,210 | 3,362,617-4,780,978 | 2,072,309 | 1,746,545-2,513,438 | 20.3 | 10,927 | 9,220-13,109 | 193 | 147-832 |
| 18-49 | 136,800,721 | 9,717,671 | 8,434,252-11,413,475 | 3,595,538 | 3,069,688-4,288,400 | 39.9 | 54,545 | 47,342-64,064 | 1,432 | 1,264-1,659 |
| 50-64 | 63,212,136 | 6,979,986 | 6,316,499-7,811,225 | 3,001,394 | 2,664,703-3,437,918 | 117.1 | 74,021 | 66,985-82,836 | 2,439 | 2,105-2,893 |
| ≥65 | 47,760,852 | 1,686,841 | 1,476,732-2,023,024 | 944,631 | 814,401-1,141,033 | 321.1 | 153,349 | 134,248-183,911 | 7,639 | 6,348-9,404 |
| All ages | 321,418,820 | 24,577,163 | 21,504,826-28,626,313 | 11,092,867 | 9,566,867-13,137,840 | 95.9 | 308,232 | 271,143-362,029 | 11,995 | 10,634-13,914 |
*Only data on pneumonia & influenza deaths are available in real-time during an influenza season; however, these are only a subset of the total deaths associated with influenza that occur each year, which may be 2 to 4 times higher when other complications are also considered.
†A 95% credible interval (95% Cr I) is provided because of the Monte Carlo approach used to estimate excess pneumonia & influenza deaths.
Table 4: Estimated influenza disease burden, by season — United States, 2010-11 through 2015-16 influenza seasons
| Season | Estimated illnesses |
Estimated medical visits |
Estimated hospitalizations |
Estimated excess deaths |
|||||||
|---|---|---|---|---|---|---|---|---|---|---|---|
| Pneumonia & influenza deaths* |
Respiratory & circulatory deaths† |
||||||||||
| No. | 95% CI | No. | 95% Cr I+ | Hosp. rate (per 100,000) |
No. | 95% CI | No. | 95% Cr I§ | No. | 95% Cr I¶ | |
| 2010-2011 | 21,096,749 | 17,582,319-27,698,870 | 9,956,056 | 8,187,913-13,224,822 | 91.2 | 281,589 | 239,013-373,931 | 13,541 | 12,111-15,372 | 39,008 | 34,283-44,986 |
| 2011-2012 | 9,231,004 | 7,281,179-13,835,345 | 4,298,616 | 3,392,861-6,450,996 | 44.8 | 139,497 | 115,865-206,066 | 4,154 | 3,691-4,747 | 12,182 | 10,638-14,346 |
| 2012-2013 | 35,590,424 | 30,113,616-44,250,092 | 16,638,347 | 13,979,214-20,765,551 | 188.8 | 592,688 | 509,813-733,307 | 19,962 | 18,006-22,434 | 56,102 | 50,252-63,709 |
| 2013-2014 | 28,445,377 | 24,968,054-33,040,119 | 12,613,671 | 10,942,829-14,817,158 | 101.9 | 322,123 | 283,230-376,646 | 13,590 | 12,252-15,307 | 31,864 | 27,832-37,234 |
| 2014-2015 | 34,292,299 | 30,332,937-40,051,029 | 16,184,354 | 14,105,043-19,181,789 | 221.8 | 707,155 | 624,149-838,516 | 19,490 | 17,718-21,740 | – | – |
| Approximate 5-season range (No.) |
9,200,000-35,600,000 | 4,300,000-16,700,000 | 140,000-710,000 | 4,000-20,000 | 12,000-56,000** | ||||||
| 2015-2016 | 24,577,163 | 21,504,826-28,626,313 | 11,092,867 | 9,566,867-13,137,840 | 95.9 | 308,232 | 271,143-362,029 | 11,995 | 10,634-13,914 | – | – |
*Only data on pneumonia & influenza deaths are available in real-time during an influenza season; however, they are only a subset of the total deaths associated with influenza that occur each year, which may be 2 to 4 times higher when deaths due to other complications are also considered.
†Data on respiratory & circulatory deaths are available with a three-year lag; therefore, estimates on averted respiratory & circulatory deaths are available for the 2010-2011 through 2013-2014 influenza seasons but not for the 2014-2015 or 2015-2016 seasons.
§A 95% credible interval (95% Cr I) is provided because of the Monte Carlo approach used to estimate excess pneumonia & influenza deaths.
¶Range is based on 4 seasons with available data on respiratory & circulatory deaths.
Table 5: Influenza vaccine coverage and vaccine effectiveness, by age group — United States, 2015-2016 influenza season
| Age | Vaccine coverage * | Vaccine effectiveness † | ||
|---|---|---|---|---|
| % | 95% CI | % | 95% CI | |
| 6 months-4 years | 70 | 68-71 | 57 | 33-72 |
| 5-17 years | 56 | 55-57 | 51 | 33-64 |
| 18-49 years | 32 | 31-33 | 49 | 35-60 |
| 50-64 years | 43 | 43-44 | 24 | -1-43 |
| ≥65 years | 63 | 62-64 | 41 | 4-64 |
*Estimates from FluVaxView. (7)
†Estimates from US Flu VE Network. (9)
Questions & Answers:
How does CDC estimate the number of hospitalizations, illnesses, and medically-attended illnesses associated with influenza that occurred in the United States?
Laboratory-confirmed influenza-associated hospitalization rates by age group were obtained from FluSurv-NET, a collaboration between CDC, the Emerging Infections Program Network, and selected state and local health departments in 13 geographically distributed areas in the United States that conduct population-based surveillance. Reported hospitalization rates were adjusted using a multiplier to correct for underreporting, which is calculated from the percent of persons hospitalized with respiratory illness who were tested for influenza and the average sensitivity of influenza testing in surveillance hospitals. These values were measured from data collected during four post-pandemic seasons; data from two seasons were previously reported (2).
Adjusted rates were applied to the U.S. population by age group to calculate the numbers of influenza-associated hospitalizations. The numbers of influenza illnesses were then estimated from hospitalizations based on previously measured ratios that reflect the estimated number of ill persons per hospitalization in each age group (5).
The numbers of persons seeking medical care for influenza were then calculated using age group-specific data on the percentages of persons with a respiratory illness who sought medical care, which were estimated from results of the 2010 Behavioral Risk Factor Surveillance Survey (10).
How does CDC estimate the number of influenza-associated deaths that occurred during the influenza season?
The annual number of excess deaths related to influenza during the season is estimated using a statistical model of weekly deaths that accounts for seasonal trends and indicators for influenza activity and circulation of respiratory syncytial virus (RSV) obtained from viral surveillance activities (11,12). The methods have been previously described elsewhere in detail (13).
Data on deaths were obtained from the US National Center for Health Statistics (NCHS) (11). Data on deaths with pneumonia or influenza listed as a cause of death are available in real-time so can be included in the estimation of burden for the 2015-2016 influenza season; however, previous studies have shown these deaths account for a fraction of all deaths that are related to influenza. Most influenza-related deaths are not due directly to influenza virus infection but are due to secondary bacterial infection or worsening of underlying chronic health conditions, such as chronic heart or lung disease. Even when influenza likely contributed to the events leading to a death, it is often not recognized and rarely listed on the death certificate. Deaths with any respiratory or circulatory (R&C) causes listed on the death certificate are likely more inclusive of deaths related to influenza than P&I deaths; however, data on R&C deaths are not available for up to three years so we are able to calculate annual estimates only for the 2010-2011 through 2013-2014 influenza seasons.
In 2010, CDC estimated the number of influenza-associated P&I deaths and number of influenza-associated deaths with any respiratory or circulatory (R&C) causes listed on the death certificate from 1976-1977 through 2006-2007 influenza seasons (8). From the historical analysis of R&C deaths, we estimate that the total number of influenza-associated deaths that occurred during the influenza season could be two to four times higher than the number of P&I deaths. The current estimate of influenza-associated P&I deaths that occurred during the 2015-2016 season is within the range of P&I mortality estimates from the historical data but roughly half the estimates of influenza-associated R&C deaths.
How does CDC estimate the number of influenza-associated outcomes that were prevented with influenza vaccination?
The annual estimates of influenza vaccination coverage by month during each season and the final end-of-season vaccine effectiveness measurements were used to estimate how many persons were not protected by vaccination during the season and thus were at risk for these outcomes.
The rate of each outcome among persons at risk was then used to estimate the number of influenza-associated outcomes that would have been expected in the same population if no one had been protected by vaccination. Finally, the averted outcomes attributable to vaccination were calculated as the difference between outcomes in the hypothetical unvaccinated population and the observed vaccinated population.
Estimates of 2015-2016 influenza vaccination coverage by month from July 2015 through April 2016, were based on self-report or parental report of vaccination status using data from the National Immunization Survey for children aged 6 months-17 years and Behavioral Risk Factor Surveillance Survey data for adults aged ≥18 years (7).
Vaccine effectiveness estimates for the 2015-2016 season were derived from the US Influenza Vaccine Effectiveness Network, a group of five academic institutions that conduct annual vaccine effectiveness studies (9). The network estimates the effectiveness of vaccination for preventing real-time reverse transcription polymerase chain reaction-positive influenza among persons with acute respiratory illness of ≤7 days duration seen in hospitals, emergency departments, or outpatient clinics in communities in four states.
Calculations were stratified by month of the year to account for annual variations in the timing of disease and vaccination and then summed across the whole season. The prevented fraction was calculated as the number of averted illnesses divided by the total illnesses that would have been expected in an unvaccinated population.
Can you explain the change in the range used to describe influenza-related deaths?
The previous range used to describe influenza-related deaths, from 3,000 to 49,000, was based on data from 30 influenza seasons from 1976 through 2007 (8). The range described in the tables above, 12,000 to 56,000, is based on data from the 2010-2011 through 2013-2014 influenza seasons. Over the past six influenza seasons, the U.S. has experienced several seasons with high rates of hospitalization and severe disease, which may explain why the range over just four seasons has higher numbers of influenza-related deaths than the previously published range.
In addition, other factors may also contribute to why some seasons have different numbers of influenza deaths than seen in the past, including changes in the way that death certificates are filed, changes in the age structure of the population, or changes in the prevalence of chronic medical conditions that put people at high-risk of influenza complications.
How does CDC track flu-related deaths in the United States?
See “Estimating Seasonal Influenza-Associated Deaths in the United States” for the answer to this question.
Why are estimated pediatric deaths in this report different from the number of pediatric deaths reported through the Influenza-Associated Pediatric Mortality Surveillance System?
Deaths associated with laboratory-confirmed influenza in children aged <18 years became nationally notifiable in 2004 and are reported to CDC through the Influenza-Associated Pediatric Mortality Surveillance System. The number of reported deaths is published each week in FluView(https://www.cdc.gov/flu/weekly/index.htm). However, the number of reported deaths is likely an underestimate of the total number of flu-related pediatric deaths because not all children may be tested for flu or children may be tested later in their illness when seasonal influenza can no longer be detected from respiratory samples.
CDC estimates the numbers of flu-related deaths using statistical models to account for likely under-reporting. The estimates of pneumonia and influenza (P&I) deaths associated with flu in this report are from one such model. Previously published reports have found that the estimated numbers of flu-related deaths in children from statistical models may be two to three times higher than the number of reported deaths. (14)
Can you explain the change in the estimate of influenza-related hospitalizations?
Influenza hospitalizations have always varied from season to season. In the past, CDC had referred to an average number of hospitalizations that was estimated based on records during 1979-2001 from about 500 hospitals across the United States. The average number of people hospitalized was “more than 200,000” but individual seasons over that time period ranged from a low of 157,911 for 1990-1991 to a high of 430,960 for 1997-1998. The new range of 140,000 to 710,000 is based on data from more recent seasons. CDC believes the recent five-year range in this report better represents the variability of influenza seasons than an average estimate.
Can you explain why some of the estimates on this website are different from previously published estimates using this methodology? (For example, total flu-related hospitalization during 2014-2015 was previously estimated to be 974,000, but the current estimate is 707,000 people)?
CDC estimates the burden of influenza using influenza-related hospitalizations and a set of multipliers for the ratio of hospitalizations to cases and the proportion of people who seek clinical care for acute respiratory illness (2). The surveillance system used to estimate influenza-related hospitalizations, FluSurv-NET, collects data on patients hospitalized who have laboratory-confirmed influenza. Influenza testing is done at the request of the clinician, but not everyone is tested. Also, influenza tests are not perfectly accurate. Thus, the reports of laboratory-confirmed influenza-related hospitalizations to FluSurv-NET are likely underestimates of the true number. To adjust for this, we collect data annually from participating FluSurv-NET sites on the amount of influenza testing and the type of test that is used at the site, and this information is used to correct for the underestimate. These testing data are often not available for up to a year after the influenza season, and thus the most recent season’s estimates may need to be revised when more recent data become available, as was the case for the 2014-2015 season.
References:
- Kostova D, Reed C, Finelli L, Cheng PY, Gargiullo PM, Shay DK, et al. Influenza Illness and Hospitalizations Averted by Influenza Vaccination in the United States, 2005-2011. PLoS One. 2013;8(6):e66312.
- Reed C, Chaves SS, Daily Kirley P, Emerson R, Aragon D, Hancock EB, et al. Estimating influenza disease burden from population-based surveillance data in the United States. PLoS One. 2015;10(3):e0118369.
- Centers for Disease Control and Prevention. Estimated influenza illnesses and hospitalizations averted by influenza vaccination – United States, 2012-13 influenza season. MMWR Morb Mortal Wkly Rep. 2013 Dec 13;62(49):997-1000.
- Reed C, Kim IK, Singleton JA, Chaves SS, Flannery B, Finelli L, et al. Estimated influenza illnesses and hospitalizations averted by vaccination-United States, 2013-14 influenza season. MMWR Morb Mortal Wkly Rep. 2014 Dec 12;63(49):1151-4.
- Centers for Disease Control and Prevention. Estimated Influenza Illnesses and Hospitalizations Averted by Vaccination — United States, 2014–15 Influenza Season. 2015 December 10, 2015 [cited 2016 October 27]; Available from: http://www.cdc.gov/flu/about/disease/2014-15.htm
- Davlin SL, Blanton L, Kniss K, Mustaquim D, Smith S, Kramer N, et al. Influenza Activity – United States, 2015-16 Season and Composition of the 2016-17 Influenza Vaccine. MMWR Morb Mortal Wkly Rep. 2016 Jun 10;65(22):567-75.
- Centers for Disease Control and Prevention. Flu Vaccination Coverage, United States, 2015–16 Influenza Season. 2016 September 29, 2016 [cited 2016 October 27]; Available from: http://www.cdc.gov/flu/fluvaxview/coverage-1516estimates.htm
- Centers for Disease Control and Prevention. Estimates of deaths associated with seasonal influenza — United States, 1976-2007. MMWR Morb Mortal Wkly Rep. 2010 Aug 27;59(33):1057-62.
- Flannery B, Chung J. Influenza Vaccine Effectiveness, Including LAIV vs IIV in Children and Adolescents, US Flu VE Network, 2015–16. Advisory Committee on Immunization Practices; 2016 June 22; Atlanta, GA; 2016.
- Biggerstaff M, Jhung M, Kamimoto L, Balluz L, Finelli L. Self-reported influenza-like illness and receipt of influenza antiviral drugs during the 2009 pandemic, United States, 2009-2010[332 Kb, 26 pages](https://www.cdc.gov/vaccines/acip/meetings/downloads/slides-2016-06/influenza-05-flannery.pdf). Am J Public Health. 2012 Oct;102(10):e21-6.
- Centers for Disease Control and Prevention. Overview of Influenza Surveillance in the United States. 2016 October 13, 2016 [cited 2016 November 1]; Available from: http://www.cdc.gov/flu/weekly/overview.htm
- Centers for Disease Control and Prevention. The National Respiratory and Enteric Virus Surveillance System (NREVSS). 2016 October 26, 2016 [cited 2016 November 1]; Available from: https://www.cdc.gov/surveillance/nrevss/index.html
- Foppa IM, Cheng PY, Reynolds SB, Shay DK, Carias C, Bresee JS, et al. Deaths averted by influenza vaccination in the U.S. during the seasons 2005/06 through 2013/14. Vaccine. 2015 Jun 12;33(26):3003-9.
- Wong KK, Cheng P, Foppa I, Jain S, Fry AM, Finelli L. Estimated paediatric mortality associated with influenza virus infections, United States, 2003-2010. Epidemiol Infect. 2014 May 15:1-8
Authors
Melissa A. Rolfes, PhD, MPH1; Ivo M. Foppa, ScD1,2; Shikha Garg, MD1; Brendan Flannery, PhD1; Lynnette Brammer, MPH1; James A. Singleton, PhD3; Erin Burns, MA1; Daniel Jernigan, MD1; Carrie Reed, DSc1; Sonja J. Olsen, PhD1; Joseph Bresee, MD1
1 Influenza Division, National Center for Immunization and Respiratory Diseases, Centers for Disease Control and Prevention, Atlanta, GA
2 Battelle Memorial Institute, Atlanta, GA, USA
3 Immunization Services Division, National Center for Immunization and Respiratory Diseases, Centers for Disease Control and Prevention, Atlanta, GA


