Archive for the ‘NASA’ Category
NASA: The Alberta wildfire smoke becomes entrained within the clouds causing it to twist within the circular motion of the clouds and wind.
Wednesday, May 11th, 2016
NASA’s Aqua satellite captured this image of the clouds over Canada. Entwined within the clouds is the smoke billowing up from the wildfires that are currently burning across a large expanse of the country. The smoke has become entrained within the clouds causing it to twist within the circular motion of the clouds and wind. This image was taken by the Moderate Resolution Imaging Spectroradiometer (MODIS) instrument on the Aqua satellite on May 9, 2016.
Image Credit: NASA image courtesy Jeff Schmaltz LANCE/EOSDIS MODIS Rapid Response Team, GSFC
Caption: Lynn Jenner
In September and October 2015, tens of thousands of fires sent clouds of toxic gas and particulate matter into the air over Indonesia.
Friday, December 11th, 2015In September and October 2015, tens of thousands of fires sent clouds of toxic gas and particulate matter into the air over Indonesia. Despite the moist climate of tropical Asia, fire is not unusual during those months. For the past few decades, people have used fire to clear land for farming and to burn away leftover crop debris. What was unusual in 2015 was how many fires burned and how many escaped their handlers and went uncontrolled for weeks and even months.
To study the fires, scientists in Indonesia and around the world have been using many different tools—from sensors on the ground to data collected by satellites. The goal is to better understand why the fires became so severe, how they are affecting human health and the atmosphere, and what can be done to prepare for similar surges in fire activity in the future.
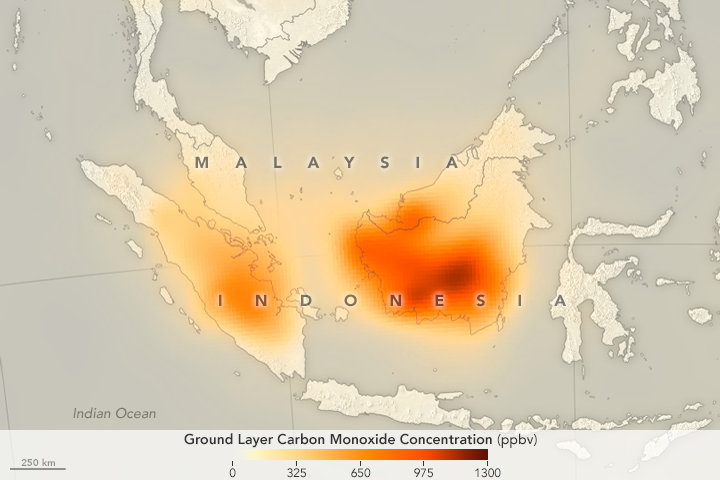
While some NASA satellite instruments captured natural-color images of the smoky pall, others focused on gases that are invisible to human eyes. For instance, the Measurement of Pollution in the Troposphere (MOPITT) sensor on Terra can detect carbon monoxide, an odorless, colorless, and poisonous gas. As shown by the map above, the concentration of carbon monoxide near the surface was remarkably high in September 2015 over Sumatra and Kalimantan.
“The 2015 Indonesian fires produced some of the highest concentrations of carbon monoxide that we have ever seen with MOPITT,” said Helen Worden, a scientist at the National Center for Atmospheric Research. Average carbon monoxide concentrations over Indonesia are usually about 100 parts per billion. In some parts of Borneo in 2015, MOPITT measured carbon monoxide concentrations at the surface up to nearly 1,300 parts per billion.
While all types of wildfires emit carbon monoxide as part of he combustion process, the fires in Indonesia released large amounts of the gas because in many cases the fuel burning was peat, a soil-like mixture of partly decayed plant material that builds up in wetlands, swamps, and partly submerged landscapes.
Read more about studies of Indonesia’s fire season in our new feature: Seeing Through the Smoky Pall.
NASA Earth Observatory map by Joshua Stevens and Jesse Allen, using data from the MOPITT Teams at the National Center for Atmospheric Research and the University of Toronto. Caption by Adam Voiland.
- Instrument(s):
- Terra – MOPITT
Deluge in the Amargosa and Death Valleys, November 4, 2015
Sunday, November 29th, 2015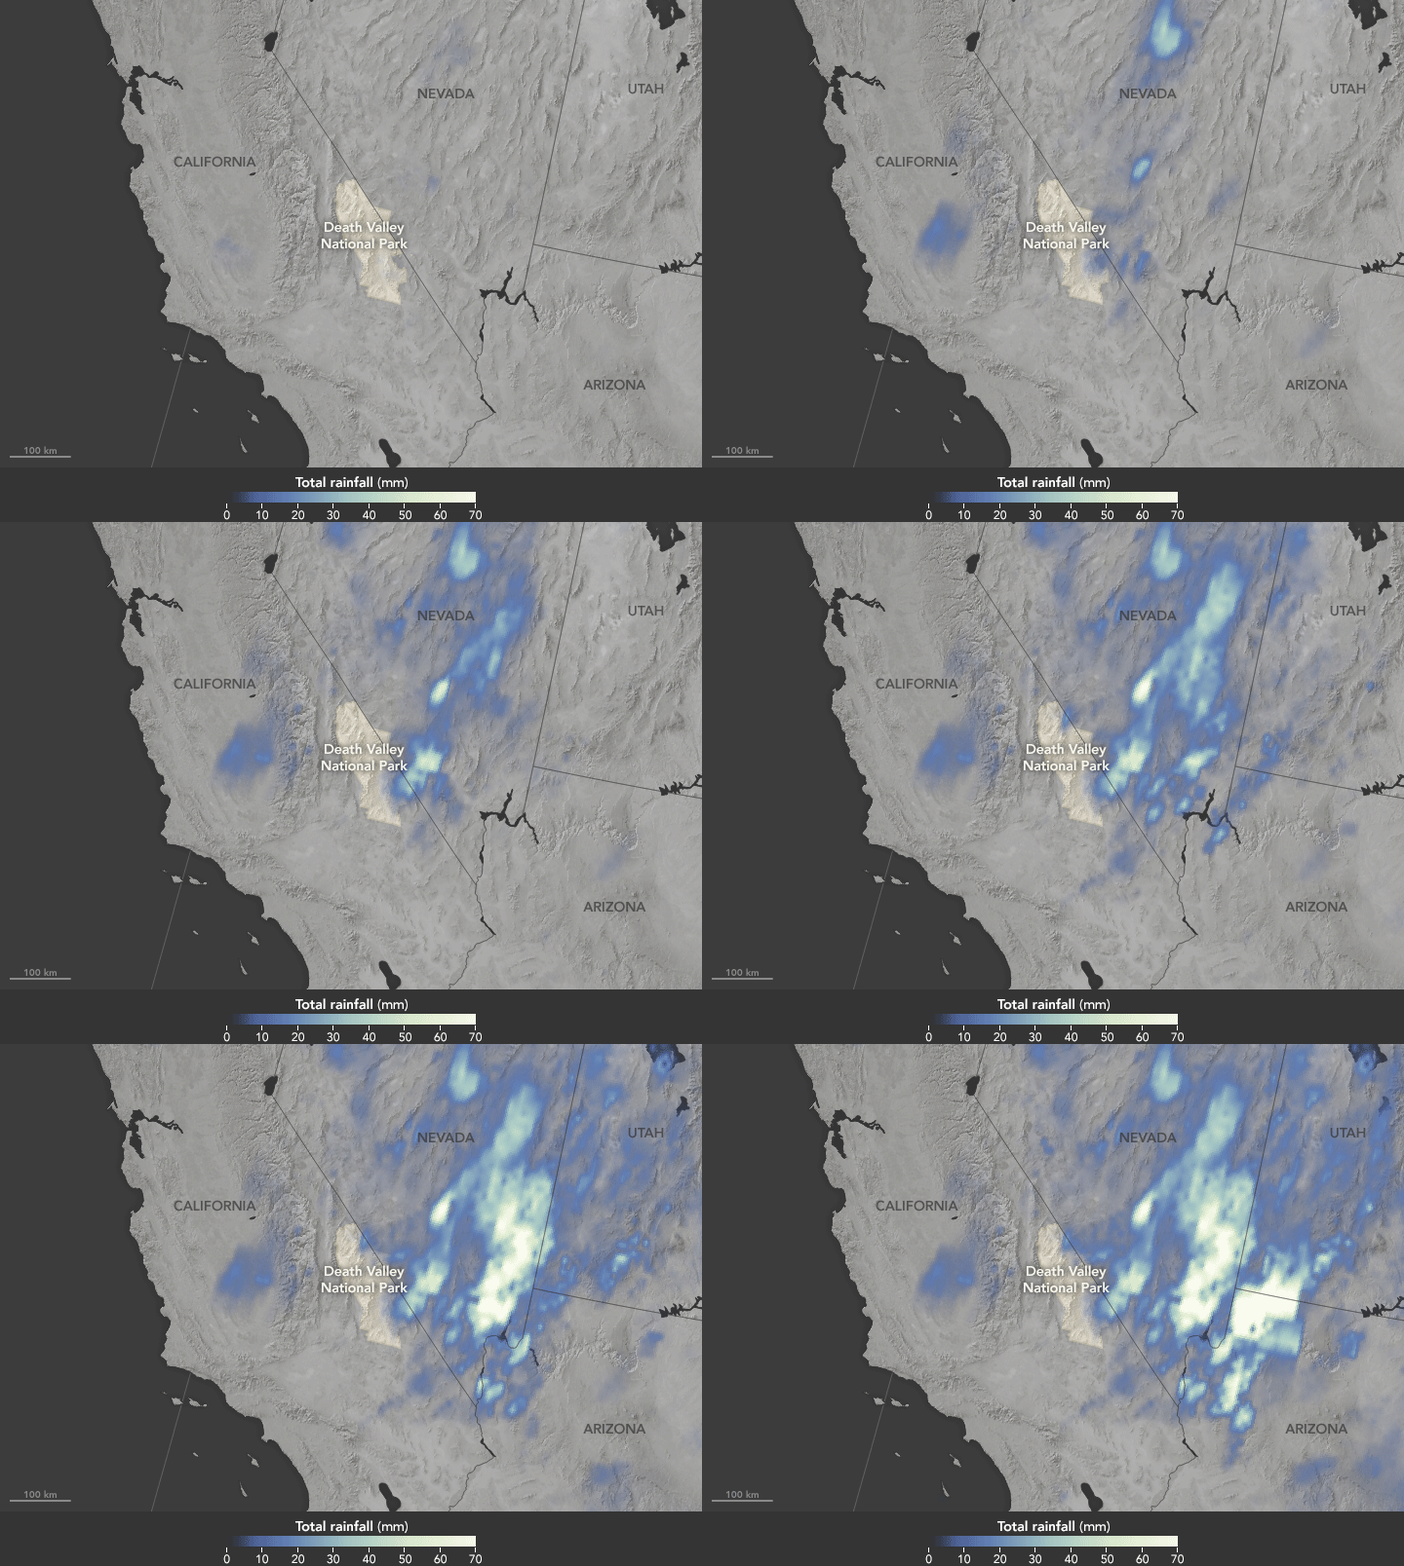
The animation above shows satellite-based estimates of rainfall from a particularly large storm that passed over the area on October 18. The rainfall data are from the Integrated Multi-Satellite Retrievals for GPM (IMERG), a product of the Global Precipitation Measurement mission. Green-white colors represent the largest rainfall totals, which in some areas reached upward of 70 millimeters (3 inches) during the 24-hour period displayed in the animation. These regional, remotely-sensed estimates may differ from the totals measured by ground-based weather stations.


