Archive for the ‘Weather’ Category
The Beast from the East: 5 dead in Poland and 2 in Romania.
Wednesday, February 28th, 2018“….Much of Europe has been blanketed in snow as cold weather spreads as far south as the Mediterranean coast……….
Aid groups have opened shelters and are providing hot food and blankets for thousands of people across Europe……”
Heavy Rain and Flooding in the Southern Plains to the Great Lakes
Wednesday, February 21st, 2018
Short Range Forecast Discussion
NWS Weather Prediction Center College Park MD
300 AM EST Wed Feb 21 2018
Valid 12Z Wed Feb 21 2018 – 12Z Fri Feb 23 2018
…Cold temperatures across the West and warm across the East with a
continuing active wet pattern across the central U.S…
Excessive rain and areal flooding will continue from portions of the
Southern Plains to the Great Lakes Region as warm Gulf moisture lifts
northward along a slow moving frontal boundary. Cold air behind the front
will allow for snow,or possible a wintry mix/ freezing rain. Numerous
Winter Weather Advisories are in effect from central Texas to Illinois.
Minor flooding is being observed across western portions of the Tennessee
and Mid-Mississippi Valleys. Several locations across Lower Great
Lakes/western Ohio Valley already have minor to moderate flooding, any
additional rainfall will likely exacerbate the situation.
Temperatures across much of the Eastern Seaboard will be above-to-well
above normal for late February. Widespread highs in the 70s with some
lower 80s are expected, and this has the potential to set record highs.
These late Spring-like temperatures will be short-lived. The strong front
over the central U.S. will finally cross the Central/Northern Appalachians
and cold air will spill into the Northeast and Mid-Atlantic regions by the
end of the week.
Upper-level energy will move southward though the Pacific Northwest will
spread snow spread from the coast inland and south to northern California.
Much of the West will have temperatures warmer than seasonal average
Campbell
Graphics available at www.wpc.ncep.noaa.gov/basicwx/basicwx_ndfd.php

The upcoming monsoon season in Bangladesh could put tens of thousands of Rohingya refugees staying at the highly congested settlements in Cox’s Bazar district at serious risk.
Monday, February 12th, 2018- At least 100,000 refugees could be in grave danger from landslides and floods.
- Up to one third of the settlement area could be flooded
- More than 85,000 refugees could lose their shelters.
- Another 23,000 refugees living on steep slopes within the site could be at risk of landslides.
- key services in the settlement are also at risk of being washed away, including latrines, washrooms, tube wells, and health centers.
Rain comes to Cape Town: The South African Weather Service recorded 6 millimeters of rain, or about 0.24 inches, at Cape Town’s Slangkop Lighthouse overnight.
Sunday, February 11th, 2018https://www.youtube.com/watch?v=yQShavaAGXQ
https://www.youtube.com/watch?v=4B_-jId9NFo
NASA: Precipitation in Western Europe from January 1 to 25, 2018.
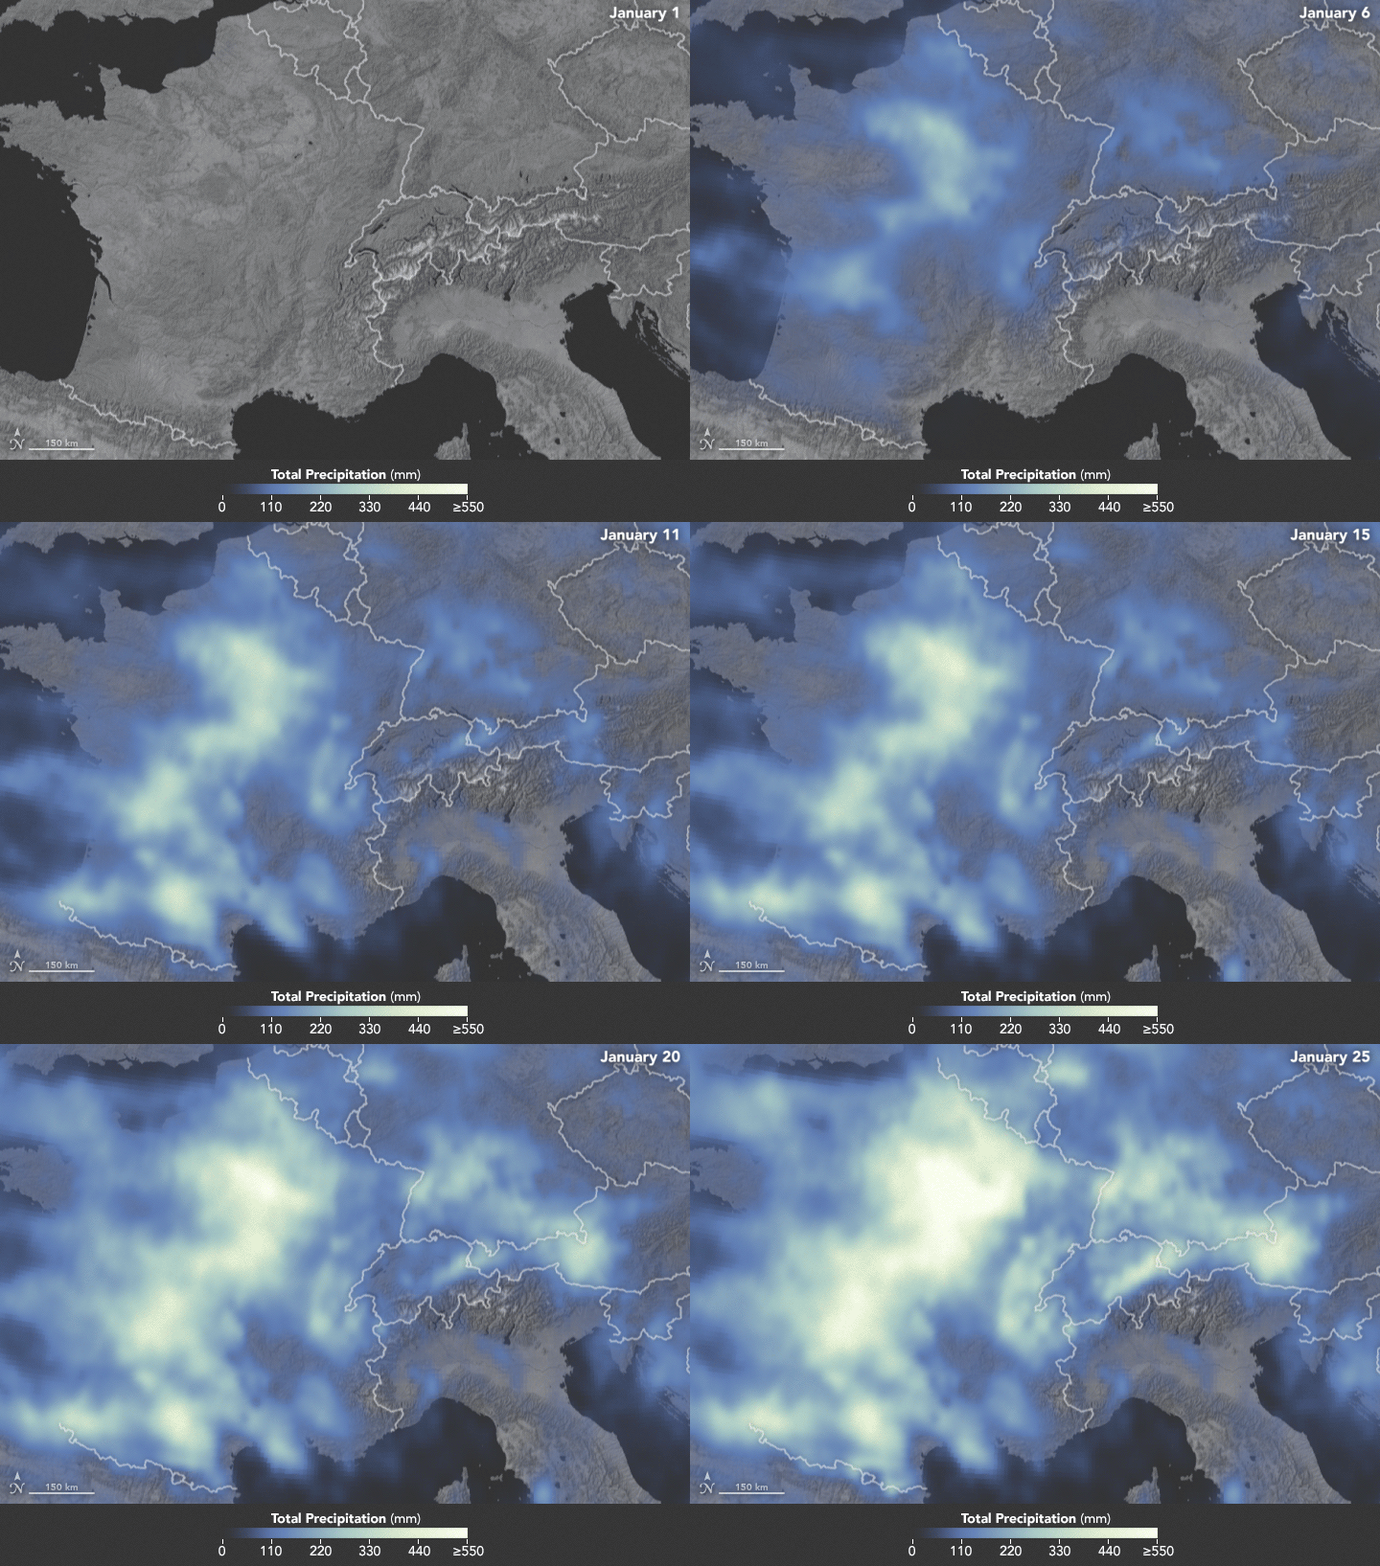
Sunday, February 4th, 2018The animation below depicts satellite-based measurements of precipitation in Western Europe from January 1 to 25, 2018. The brightest areas reflect the highest precipitation amounts. The measurements are a product of the Global Precipitation Measurement (GPM) mission, which is a partnership between NASA, the Japan Aerospace Exploration Agency, and five other national and international partners.

These precipitation totals are regional, remotely-sensed estimates of precipitation (liquid and frozen mix); they do not reflect pure snowfall. Each pixel shows 0.1 degrees of the globe (about 7 miles at the equator), and the data are averaged across each pixel. Individual ground-based measurements within a pixel can be significantly higher or lower than the average.
In addition to the snowfall in the mountains, rainfall has been frequent and severe in the lowlands, particularly in France. The Seine River crested at nearly 6 meters (20 feet) in Paris in late January. The warm winter in Europe also means that a fair bit of snow has been melting off and running downstream, even as fresh snow is piling up in the hills.
-
References
- Meteo France (2018, January) Hiver 2018 : une pluviométrie exceptionnelle. Accessed January 31, 2018.
- The Washington Post (2018, January 23) Heavy snow and avalanches strand thousands at ski villages across the Alps. Accessed January 31, 2018.
- Weather.com (2018, January 23) Heavy Snow Buries Davos, Switzerland, During Meeting of World Leaders. Accessed January 31, 2018.
- Weather Underground (2018, January 27) Floods, Record Warmth, High Winds: It’s the Winter of 2018, European Edition. Accessed January 31, 2018.
NASA Earth Observatory images by Joshua Stevens, using MODIS data from LANCE/EOSDIS Rapid Response and IMERG data from the Global Precipitation Mission (GPM) at NASA/GSFC. Caption by Mike Carlowicz.
- Instrument(s):
- Terra – MODIS
- GPM
2017 Was the Second Hottest Year on Record
Sunday, January 21st, 2018
Earth’s global surface temperatures in 2017 ranked as the second warmest since 1880, according to an analysis by scientists at NASA’s Goddard Institute for Space Studies (GISS). Continuing the planet’s long-term warming trend, globally averaged temperatures in 2017 were 0.90 degrees Celsius (1.62 degrees Fahrenheit) warmer than the 1951 to 1980 mean. That is second only to global temperatures in 2016.
In a separate, independent analysis, scientists at the National Oceanic and Atmospheric Administration (NOAA) concluded that 2017 was the third-warmest year in their record. The minor difference in rankings is due to slightly different methods used by the two agencies to analyze global temperatures. The long-term records of the two agencies remain in strong agreement, and both analyses show that the five warmest years on record have all taken place since 2010.
The map above depicts global temperature anomalies in 2017, according to the NASA GISS team. The map does not show absolute temperatures; instead, it shows how much warmer or cooler each region of Earth was compared to a baseline average from 1951 to 1980.
Because the locations and measurement practices of weather stations change over time, there are uncertainties in the interpretation of specific year-to-year global mean temperature differences. Taking this into account, NASA estimates that the 2017 global mean change is accurate to within 0.1 degree Fahrenheit, with a 95 percent certainty level.

“Despite colder than average weather in any one part of the world,” said GISS Director Gavin Schmidt, “temperatures over the planet as a whole continue the rapid warming trend we have seen over the last 40 years.”
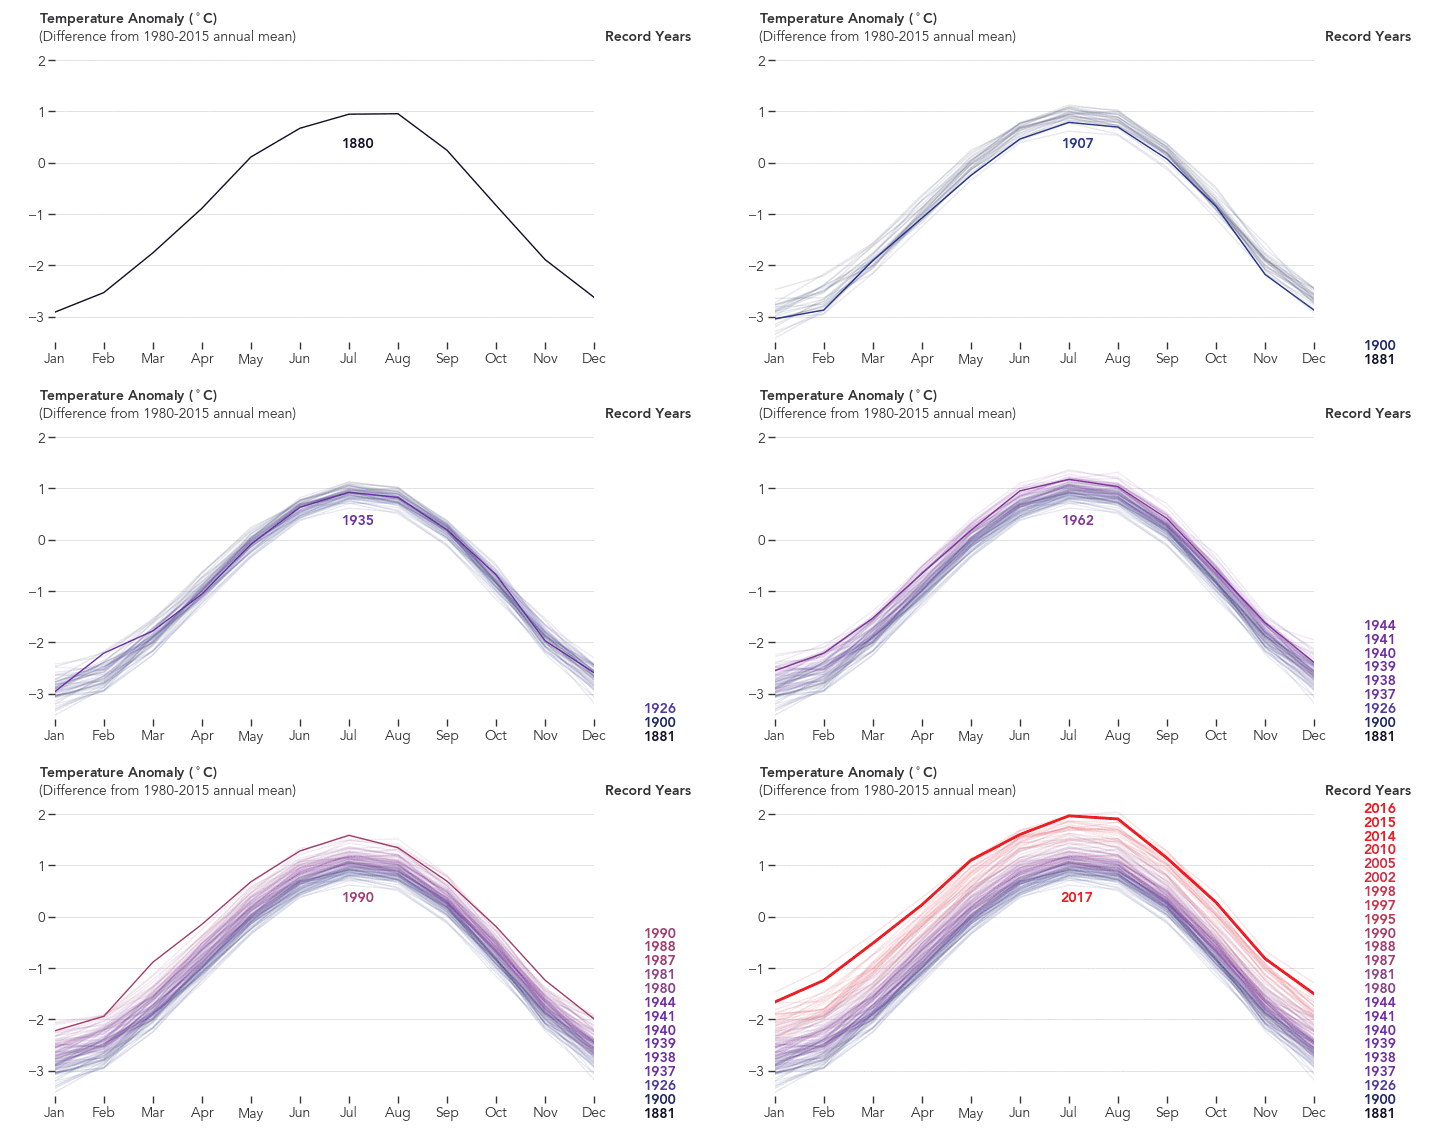
The animated figure above shows global temperature anomalies for every month since 1880, a result of the Modern-Era Retrospective analysis for Research and Applications, version 2 (MERRA-2) model run by NASA’s Global Modeling and Assimilation Office. Each line shows how much the global monthly temperature was above or below the annual global mean from 1980–2015. The column on the right lists each year when a new global record was set.
Earth’s average surface temperature has risen a little more than 1 degree Celsius (about 2 degrees Fahrenheit) during the past century or so, a change driven largely by increased carbon dioxide and other human-made emissions into the atmosphere. 2017 was the third consecutive year in which global temperatures were more than 1 degree Celsius (1.8 degrees Fahrenheit) above late 19th-century levels.
Phenomena such as El Niño and La Niña—which warm and cool the tropical Pacific Ocean and cause corresponding variations in global wind and weather patterns—contribute to short-term variations in global temperatures. Also, weather dynamics affect regional temperatures, so not every region on Earth experienced similar amounts of warming last year. Warming trends are strongest in the Arctic regions.
The NASA GISS team assembles its analysis from publicly available data acquired by roughly 6,300 meteorological stations around the world; from ship- and buoy-based instruments measuring sea surface temperature; and from Antarctic research stations. This raw data is analyzed using methods that account for the distribution of temperature stations around the globe and for urban heating effects that could skew the calculations. (For more explanation of how the analysis works, read World of Change: Global Temperatures.)
Analyses from the United Kingdom Met Office and the World Meteorological Organization also ranked 2017 among the top three warmest years on record. Scientists from NOAA, WHO, and the UK Met Office use much of the same raw temperature data, but with different baseline periods or slightly different methods to analyze Earth’s polar regions and global temperatures.
-
References and Related Reading
- NASA Goddard Institute for Space Studies (2018) GISS Surface Temperature Analysis (GISTEMP). Accessed January 18, 2018.
- NOAA National Climatic Data Center (2018, January 18) Global Climate Report: Annual 2017. Accessed January 18, 2018.
- NOAA (2018, January 18) 2017 was third warmest year on record for the globe. Accessed January 18, 2018.
- NASA Earth Observatory (2015) World of Change: Global Temperatures.
- NASA Earth Observatory (2015, January 21) Why So Many Global Temperature Records?
- NASA Earth Observatory (2010, June 3) Global Warming.
NASA Earth Observatory images by Joshua Stevens, based on data from the NASA Goddard Institute for Space Studies. Caption by Kate Ramsayer, NASA Goddard Space Flight Center, with Mike Carlowicz.
- Instrument(s):
- Model
- In situ Measurement
“A powerful storm pummeled Europe with high winds and snow Thursday, killing at least seven people in three countries, grounding flights, halting trains, ripping roofs off buildings and flipping over trucks. ….”
Friday, January 19th, 2018“….. wind gusts of up to 87 mph in the southern port of Hook of Holland….”
https://www.youtube.com/watch?v=WeFryjME7c0
January 18, 1969: The worst weather-related disaster in California in the 20th century.
Thursday, January 18th, 2018NASA: A Chilly End to 2017 for the Northeast
Saturday, December 30th, 2017
As 2017 drew toward a close, Arctic air spilled into the eastern United States and Canada for several days. Blasts of bitterly cold air set up a white Christmas for many Americans, and forecasters are expecting New Year’s Eve celebrations to be the coldest in recent memory for many areas.
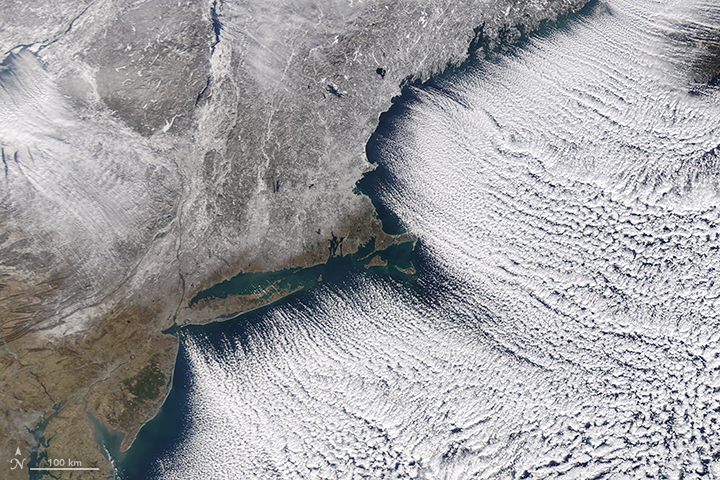
The Moderate Resolution Imaging Spectroradiometer (MODIS) on NASA’s Terra satellite captured this image of the frozen Northeast landscape on December 28, 2017. Brisk northwesterly winds created rows of “cloud streets” as cold air blew over Lake Ontario and the Atlantic Ocean. A layer of snow covered much of New England and upstate New York.
Cloud streets are long parallel bands of cumulus clouds that form when cold air blows over warmer waters and a warmer air layer (temperature inversion) rests over the top of both. The comparatively warm water gives up heat and moisture to the cold air above, and columns of heated air called thermals naturally rise through the atmosphere. The temperature inversion acts like a lid. When the rising thermals hit it, they roll over and loop back on themselves, creating parallel cylinders of rotating air. As this happens, the moisture cools and condenses into flat-bottomed, fluffy-topped cumulus clouds that line up parallel to the direction of the prevailing winds.
While the cold streak has not broken all-time records, it is breaking records for individual days. On the day the image was acquired, weather observers on Mount Washington (New Hampshire) recorded a daily record low of -34 degrees Fahrenheit (-36° Celsius). Baltimore, Boston, Flint, New York, Montreal, and Toronto Cities have seen records fall during this cold snap.
When the ball drops in New York City on New Year’s Eve, forecasters expect air temperatures of 10°F (-12°C), with wind chills of -5°F ( -15°C). The last time it was so cold was in 1962; the record for the coldest ball drop occurred in 1917, when the air temperature was just 1°F (-17°C), according to Jason Samenow of the Capital Weather Gang.
The cold weather pattern has its origins in a large bulge, or ridge, in the jet stream that has brought unseasonably warm weather to Alaska. On the east side of this ridge, a trough in the jet stream plunged southward, bringing plenty of Arctic air with it. This orientation of the jet stream, which looks similar to the greek letter omega, is known as an omega block.
-
References and Further Reading
- Forbes (2017, December 28) A Response For People Using Record Cold U.S. Weather To Refute Climate Change. Accessed December 29, 2017.
- Mashable (2017, December 29) There’s no end in sight to the frigid weather in the U.S. and Canada. Accessed December 29, 2017.
- The Boston Globe (2017, December 28) Mt. Washington summit breaks daily record low. Accessed December 29, 2017.
- The Washington Post (2017, December 29) Eastern U.S. to endure most numbing New Year’s Eve cold in memory. Accessed December 29, 2017.
- The Weather Channel (2017, December 29) Arctic Cold Outbreak to Bring Record Lows to the Plains, Midwest and East Into the New Year. Accessed December 29, 2017.
- Weather Underground (2017, December 25) Almost Half of the Lower 48 States Had Snow Cover Christmas Morning 2017, Including a Rare White Christmas in Seattle. Accessed December 29, 2017.
NASA image by Jeff Schmaltz, LANCE/EOSDIS Rapid Response. Story by Adam Voiland.
- Instrument(s):
- Terra – MODIS


