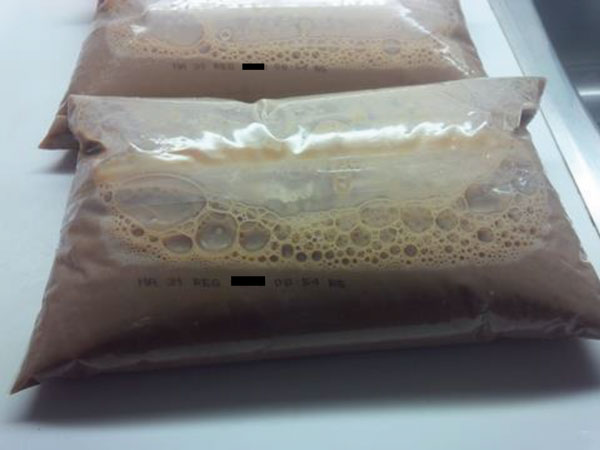
Ontario, Canada: Listeria monocytogenes associated with pasteurized chocolate milk
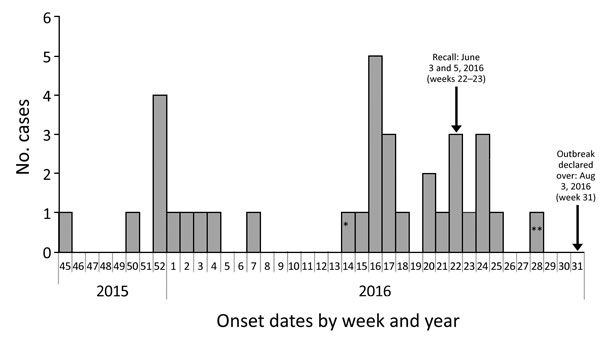
February 3rd, 2019“……Thirty-four case-patients met the outbreak definition; only Ontario residents were identified. Eleven case-patients had an onset date during November 14, 2015–February 14, 2016. Onset dates ranged from April 11 to June 20, 2016, for 21 case-patients in the second wave; the remaining 2 case-patients were outliers (Figure 1). Median age was 73 years (range <1 years–90 years). More than half of the case-patients were female (20/34, 59%). Hospitalizations occurred for 32 (94%) case-patients, and 4 deaths (12%) were reported...…”
Hanson H, Whitfield Y, Lee C, Badiani T, Minielly C, Fenik J, et al. Listeria monocytogenes associated with pasteurized chocolate milk, Ontario, Canada. Emerg Infect Dis. 2019 Mar [date cited]. https://doi.org/10.3201/eid2503.18-0742
WHO warns against a counterfeit anti-rabies vaccine now circulating in the Philippines.
February 3rd, 2019“….The WHO said that “two falsified vaccines have so far been discovered.” It said that Verorab vaccines with batch number NIE35 and H1833 are counterfeit.….”
Australia: State of the Climate
February 3rd, 2019Australia: State of the Climate
Key points
Australia
- Australia’s climate has warmed just over 1 °C since 1910 leading to an increase in the frequency of extreme heat events.
- Oceans around Australia have warmed by around 1 °C since 1910, contributing to longer and more frequent marine heatwaves.
- Sea levels are rising around Australia, increasing the risk of inundation.
- The oceans around Australia are acidifying (the pH is decreasing).
- April to October rainfall has decreased in the southwest of Australia. Across the same region May–July rainfall has seen the largest decrease, by around 20 per cent since 1970.
- There has been a decline of around 11 per cent in April–October rainfall in the southeast of Australia since the late 1990s.
- Rainfall has increased across parts of northern Australia since the 1970s.
- Streamflow has decreased across southern Australia. Streamflow has increased in northern Australia where rainfall has increased.
- There has been a long-term increase in extreme fire weather, and in the length of the fire season, across large parts of Australia.
Global
- Concentrations of all the major long-lived greenhouse gases in the atmosphere continue to increase, with carbon dioxide (CO 2) concentrations rising above 400 ppm since 2016 and the CO 2 equivalent (CO 2-e) of all gases reaching 500 ppm for the first time in at least 800,000 years.
- Emissions from fossil fuels continue to increase and are the main contributor to the observed growth in atmospheric CO2.
- The world’s oceans, especially in the southern hemisphere, are taking up more than 90 per cent of the extra energy stored by the planet as a result of enhanced greenhouse gas concentrations.
- Global sea level has risen by over 20 cm since 1880, and the rate has been accelerating in recent decades.
- Globally averaged air temperature has warmed by over 1 °C since records began in 1850, and each of the last four decades has been warmer than the previous one.
Future
Australia is projected to experience:
- Further increases in sea and air temperatures, with more hot days and marine heatwaves, and fewer cool extremes.
- Further sea level rise and ocean acidification.
- Decreases in rainfall across southern Australia with more time in drought, but an increase in intense heavy rainfall throughout Australia.
Oxford University (Oxford University Innovation) has entered into an option agreement for a universal influenza vaccine with US-based startup Blue Water Vaccines (BWV)
February 2nd, 2019“……there are over almost 500,000 deaths a year caused by influenza, with somewhere between three to five million severe cases of illness annually. The virus is estimated to cost $87.1 billion in absenteeism in the US alone...…
[T]he universal flu vaccine developed at Oxford University targets epitopes that are both naturally immunogenic and limited in variability, allowing for a vaccine that protects against all influenza strains and avoids the need to be regularly updated.
The vaccine, which covers all influenza A and B strains is, is approaching clinical studies and could feasibly enter Phase I trials by the end of 2019……….”
‘……The vaccine is designed to target components of the influenza virus that are common to all strains, and will therefore also be suitable to target the outbreak of a new flu pandemic caused by the emergence of a novel form of the virus at the time it moves from an animal species into humans, according to the firm.
The vaccine is 100 percent synthetic and delivers “highly conserved immunogenic peptide fragments from the flu virus to antigen presenting cells in the skin, eliciting a strong and long-lasting T-cell immune response”……’
“…..Unlike ordinary vaccines, which use proteins found on the surface of the virus that are susceptible to change, the universal vaccine uses the more stable proteins at the virus’ core. Instead of utilising antibodies, it works by stimulating the immune system to boost virus-killing T-cells, which research has shown such can help fight more than one type of flu virus...…”
Week 4: Influenza in Michigan
February 2nd, 2019- Number of reports by region: 34 total [C(9), N(3), SE(16), SW(6)]
- Proportion of visits due to ILI: ↑ 2.5% (regional baseline*: 1.8%)
- A total of 250 patient visits due to ILI were reported out of 10,161 office visit
- One (1) pediatric influenza (A/H1N1-09) death has been confirmed by MDHHS for the 2018-2019 flu season.
- Since Oct. 1, there have been 230 (35 pediatric, 195 adult) influenza-related hospitalizations reported in the catchment area for the 2018-2019 season.
- Michigan Sentinel Clinical Lab Respiratory Virus Data Eleven (11) sentinel clinical labs (3SE, 1SW, 6C, 1N) reported during this week
- SE Region • Influenza A: moderate; increasing • Influenza B: low • Parainfluenza: low-moderate • RSV: moderate; variable • Adenovirus: low • hMPV: low-moderate; slight decrease
- Central Region • Influenza A: low-moderate; some increases • Influenza B: sporadic • Parainfluenza: low • RSV: low-moderate; some decreases • Adenovirus: low • hMPV: very low
- SW Region • Influenza A: moderate; slight increase • Influenza B: sporadic • Parainfluenza: low; slight decrease • RSV: moderate; steady • Adenovirus: low • hMPV: low
- North Region • Influenza A: increased • Influenza B: sporadic • Parainfluenza: no data available • RSV: sporadic-low • Adenovirus: no data available • hMPV: no data available

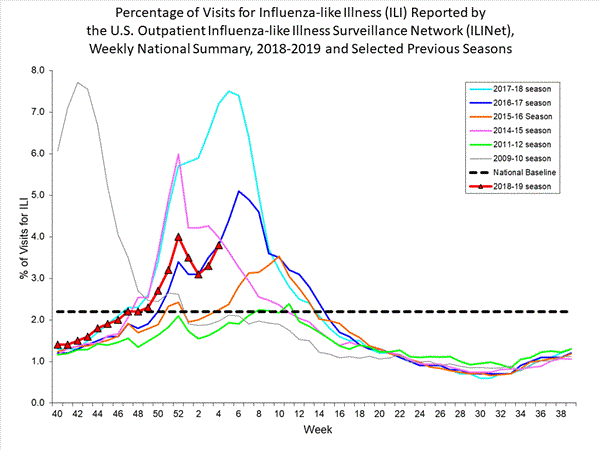
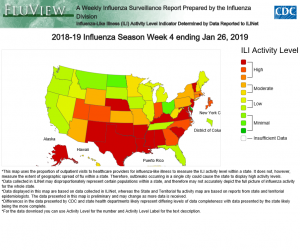
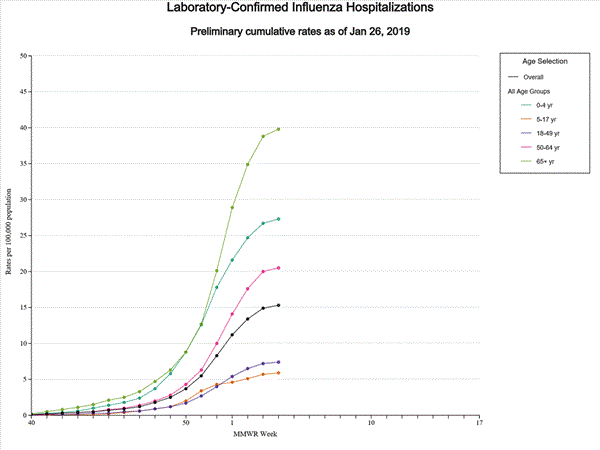
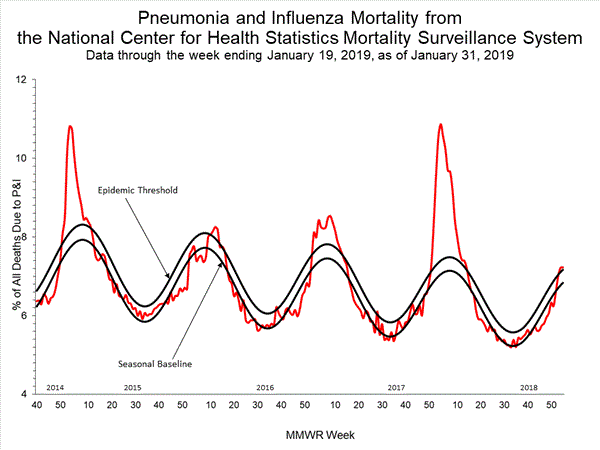
2018-2019 Influenza Season Week 4 ending January 26, 2019: Flu activity increased in the U.S.
February 2nd, 20191/31/1953: North Sea flooding kills more than 1,500 people in the Netherlands, destroys 1 million acres of farmland, wipes out 50,000 buildings and leaves 300,000 homeless
January 31st, 2019Bangkok cracks the list of the top 10 cities with the foulest air on the planet.
January 31st, 2019“……Bangkok suffers from a toxic amalgam: unchecked industrialization and urbanization, a car-crazy populace and lax regulation. The burning of fallow fields and a dry season with little wind exacerbate the crisis...…”


