Archive for February, 2016
Syria: Bombings claimed by ISIS in Damascus and Homs killed nearly 130 people on Sunday
Sunday, February 21st, 2016During June–August, 2015, a large MERS outbreak (n = 130) occurred at King Abulaziz Medical City, a 1,200-bed tertiary-care hospital that includes a 150-bed emergency department that registers 250,000 visits per year. The 130-case MERS outbreak last summer was likely related to ER overcrowding, uncontrolled patient movement, and high visitor traffic.
Sunday, February 21st, 2016Notes from the Field: Nosocomial Outbreak of Middle East Respiratory Syndrome in a Large Tertiary Care Hospital — Riyadh, Saudi Arabia, 2015
Weekly / February 19, 2016 / 65(6);163–164
Hanan H. Balkhy, MD1; Thamer H. Alenazi, MD1; Majid M. Alshamrani, MD1; Henry Baffoe-Bonnie, MD1; Hail M. Al-Abdely, MD3; Aiman El-Saed, MD, PhD1; Hussain A. Al Arbash, MD4; Zayid K. Al Mayahi, MD4; Abdullah M. Assiri, MD5; Abdulaziz bin Saeed, MD5 (View author affiliations)

Since the first diagnosis of Middle East respiratory syndrome (MERS) caused by the MERS coronavirus (MERS-CoV) in the Kingdom of Saudi Arabia in 2012, sporadic cases and clusters have occurred throughout the country (1). During June–August, 2015, a large MERS outbreak occurred at King Abulaziz Medical City, a 1,200-bed tertiary-care hospital that includes a 150-bed emergency department that registers 250,000 visits per year.
In late June 2015, approximately 3 months after the last previously recognized MERS case in the hospital, a man aged 67 years with multiple comorbidities (diabetes, hypertension, congestive heart failure, and a history of coronary artery bypass graft surgery) and a 10-day history of fever and cough was evaluated in the emergency department (Figure). The patient had no identified exposure to camels. A nasopharyngeal swab from the patient tested positive for MERS-CoV by reverse transcription-polymerase chain reaction (RT-PCR) (2). The patient was admitted and died in the hospital after 31 days. Although this patient’s hospitalization overlapped with the onset of subsequent hospital-associated MERS cases, no direct links between this first case and any of the subsequent cases were identified.
Approximately 3 weeks after the first patient’s admission, a second patient, a man aged 56 years, with multiple comorbidities (diabetes with hypothyroidism, coronary artery disease, and hypertension with a history of coronary artery bypass surgery) and a history of camel exposure was evaluated in the emergency department for fever, cough, and shortness of breath. His nasopharyngeal specimen tested positive for MERS-CoV by RT-PCR. Three additional cases of MERS were epidemiologically linked to this patient’s illness during his first week of hospitalization, including infections in two health care workers from the emergency department. An outbreak investigation was conducted by the hospital’s infection control program to identify risk factors for infection and to develop and implement control measures. A suspected MERS case was defined as the occurrence of respiratory symptoms in a person with or without documented exposure to a patient with confirmed or probable MERS infection, but without confirmation by laboratory test results. A probable case was the occurrence of respiratory symptoms in a person with history of exposure to a patient with confirmed or probable MERS infection, but with inconclusive laboratory results (such as positive results by PCR on only one of the two genomic targets). A confirmed case was a suspected or probable case that was subsequently confirmed by a positive RT-PCR test for MERS-CoV. Contacts of persons with confirmed and probable cases were screened and persons with suspected cases were tested.
A total of 130 MERS cases were detected at King Abulaziz Medical City during late June–late August. Among these cases, 81 (62%) were confirmed and 49 (38%) were probable, including 43 (33%) cases in health care workers; 20 of these 43 cases (47%) occurred in emergency department health care workers, and 23 (53%) were in health care workers from other areas of the hospital. The majority of confirmed cases were linked to the emergency department. The median age of MERS patients who were health care workers was 37 years, and 77% were female; among MERS patients who were not health care workers, the median age was 66 years, and 65% were male. Signs and symptoms included fever and one or more respiratory symptoms, primarily cough and shortness of breath. Twenty-one (16%) asymptomatic cases were detected during contact screening, including infection in 18 health care workers. Overall, 96 (74%) MERS patients required hospitalization, including 63 (66%) who required intensive care management; 34 (26%) patients were isolated at home. Among all 130 cases, 51 (53%) died; no deaths occurred among health care workers.
On August 2, a preexisting Infectious Disease Epidemic Plan (IDEP), established by the hospital outbreak committee and based on CDC and World Health Organization guidelines (3,4), was activated (Figure). The plan included strict enforcement of infection control measures, including hand hygiene, airborne and contact isolation for confirmed and probable cases, and droplet and contact isolation for suspected cases. Measures were taken to house suspected patients and confirmed/probable patients on separate wards. Because cases continued to be identified despite the hospital’s status of being in level II IDEP, on August 18, the plan was escalated to the highest level, IDEP level III, which included closure of the emergency department, postponement of elective surgical procedures, and suspension of all outpatient appointments and visits. Complete evacuation of the emergency department was achieved on August 22, and was associated with a rapid decline in the number of new cases. Onset of symptoms in the last infected patient was August 28. On September 28, the end of outbreak was declared after the completion of two 14-day incubation periods without further identification of new cases.
This large MERS outbreak in a major tertiary-care hospital in Riyadh was thought to be related to emergency department overcrowding, uncontrolled patient movement, and high visitor traffic. The outbreak required institution of multiple measures to interrupt transmission, including almost complete shutdown of the hospital. Primary MERS cases have been linked to patients with camel exposure in previously described outbreaks (5) and exposure to camels was confirmed in three patients during the early stages of this outbreak. Escalation of the outbreak, however, was clearly linked to extended health care–related person-to-person transmission. In addition to the community transmission, four generations of hospital transmission were believed to have occurred during the outbreak. Although data are still limited, this occurrence is considered a more intense transmission than has been previously described in similar outbreaks (6). Although the outbreak was associated with considerable patient mortality, no deaths occurred among health care workers, who were younger, healthier, and had fewer comorbidities compared with patients who were not health care workers. Early recognition of cases and rapid implementation of infection control guidance is necessary to prevent health care facility-associated outbreaks of MERS-CoV.
References
- Alameer K, Abukhzam B, Khan W, El-Saed A, Balkhy H. Middle East respiratory syndrome coronavirus (MERS-Cov) screening of exposed healthcare workers in a tertiary care hospital in Saudi Arabia. Antimicrob Resist Infect Control 2015;4(Suppl 1):O57. CrossRef
- World Health Organization. Laboratory testing for Middle East respiratory syndrome coronavirus. Interim guidance. Geneva, Switzerland: World Health Organization; 2015. http://apps.who.int/iris/bitstream/10665/176982/1/WHO_MERS_LAB_15.1_eng.pdf?ua=1.
- CDC. Interim infection prevention and control recommendations for hospitalized patients with Middle East respiratory syndrome coronavirus (MERS-CoV). Atlanta, GA: US Department of Health and Human Services, CDC; 2015. http://www.cdc.gov/coronavirus/mers/infection-prevention-control.html#infection-prevention.
- World Health Organization. Infection prevention and control of epidemic-and pandemic-prone acute respiratory diseases in health care. Geneva, Switzerland: World Health Organization, 2007. http://apps.who.int/iris/bitstream/10665/69707/1/WHO_CDS_EPR_2007.6_eng.pdf?ua=1.
- Alraddadi BM, Watson JT, Almarashi A, et al. Risk factors for primary Middle East respiratory syndrome coronavirus illness in humans, Saudi Arabia, 2014. Emerg Infect Dis 2016;22:49–55. CrossRef PubMed
- Fagbo SF, Skakni L, Chu DKW, et al. Molecular epidemiology of hospital outbreak of Middle East respiratory syndrome,
 FIGURE. Number of cases of Middle East respiratory syndrome (N = 130), by week of symptom onset and health care worker (HCW) status — King Abdulaziz Medical City, Riyadh, Saudi Arabia, June–August, 2015
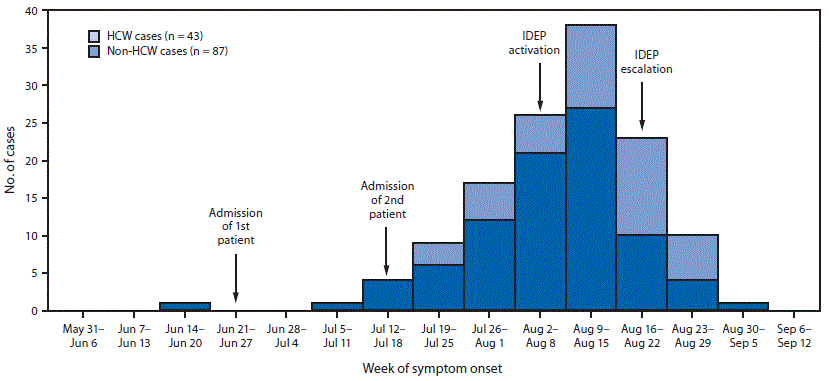 Abbreviation: IDEP = infectious disease epidemic plan.
Suggested citation for this article: Balkhy HH, Alenazi TH, Alshamrani MM, et al. Notes from the Field: Nosocomial Outbreak of Middle East Respiratory Syndrome in a Large Tertiary Care Hospital — Riyadh, Saudi Arabia, 2015. MMWR Morb Mortal Wkly Rep 2016;65:163–164. DOI: http://dx.doi.org/10.15585/mmwr.mm6506a5.
U.S. and Brazilian researchers to recruit mothers and babies in one of the biggest government-led studies to understand whether the Zika virus is linked to microcephaly
Sunday, February 21st, 2016“…..Researchers hope to enroll 100 mothers and their babies with microcephaly. These will be matched with 300 to 400 pairs of healthy mothers and their babies. Initial results are expected this spring……..
Blood samples from moms and babies in both groups will be tested for signs of Zika infection.
Current diagnostic tests looking for Zika antibodies are limited because they closely resemble dengue, a related virus common in Brazil. The team hopes that taking samples from both mothers and their babies will give a more precise picture of whether Zika was involved. They will also look for other exposures that might explain why a baby developed microcephaly.
The study’s design should help determine the relative risk of microcephaly in babies whose mothers were infected with Zika.
Staples said the work could provide stronger confirmation of a link, but that it would take years of scientific investigation to prove whether Zika actually causes microcephaly…..”
CDC: Flu activity increased in the United States.
Sunday, February 21st, 2016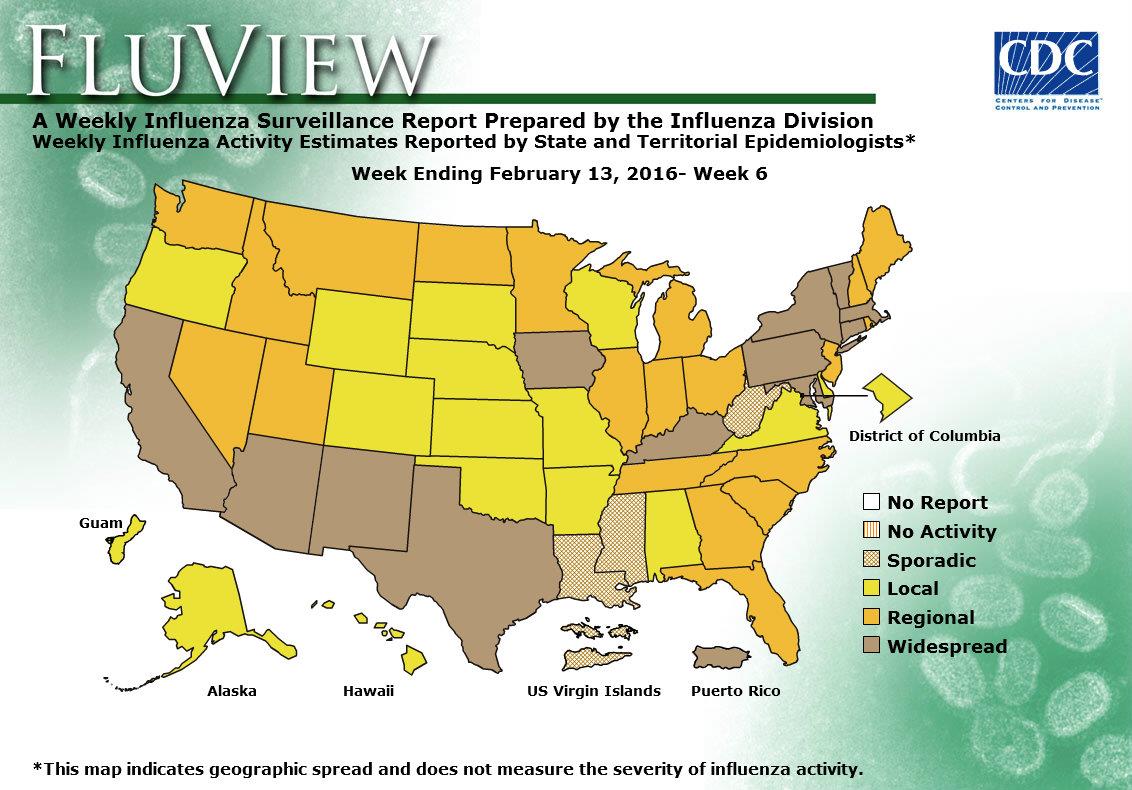
The influenza activity reported by state and territorial epidemiologists indicates geographic spread of influenza viruses, but does not measure the severity of influenza activity.
During week 6, the following influenza activity was reported:
- Widespread influenza activity was reported by Puerto Rico and 12 states (Arizona, California, Connecticut, Iowa, Kentucky, Maryland, Massachusetts, New Mexico, New York, Pennsylvania, Texas, and Vermont).
- Regional influenza activity was reported by 20 states (Florida, Georgia, Idaho, Illinois, Indiana, Maine, Michigan, Minnesota, Montana, Nevada, New Hampshire, New Jersey, North Carolina, North Dakota, Ohio, Rhode Island, South Carolina, Tennessee, Utah, and Washington).
- Local influenza activity was reported by the District of Columbia, Guam and 15 states (Alabama, Alaska, Arkansas, Colorado, Delaware, Hawaii, Kansas, Missouri, Nebraska, Oklahoma, Oregon, South Dakota, Virginia, Wisconsin, and Wyoming).
- Sporadic influenza activity was reported by the U.S. Virgin Islands and three states (Louisiana, Mississippi, and West Virginia).
Residents of Fiji were beginning to clean up and assess the damage Sunday after a ferocious cyclone tore through the Pacific island chain overnight and killed at least one person.
Sunday, February 21st, 2016** Tropical Cyclone Winston, packing winds of 180 mph with gusts over 220 mph, is expected to strengthen further as the storm of all storms makes landfall in Fiji
Saturday, February 20th, 2016
https://www.youtube.com/watch?v=fnpiBcNzuFA
The Chicago Fire Department evacuated buildings at 150, 180 and 191 North Wacker Drive due to falling debris caused by high winds, including broken glass.
Saturday, February 20th, 20162015-2016 Influenza Season Week 6 ending February 13, 2016
Saturday, February 20th, 2016
Background:
The Centers for Disease Control and Prevention’s (CDC) Influenza Division collects, compiles, and analyzes information on influenza activity year-round in the United States and produces FluView, a weekly influenza surveillance report, and FluView Interactive. The U.S. influenza surveillance system provides information in five categories collected from nine data sources. This is the first report of the 2015-2016 influenza season, which began on October 4, 2015.
The five categories and nine data components of CDC influenza surveillance are:
- Viral Surveillance:U.S. World Health Organization (WHO) collaborating laboratories, the National Respiratory and Enteric Virus Surveillance System (NREVSS), and human infection with novel influenza A virus case reporting;
- Mortality:National Center for Health Statistics (NCHS) Mortality Surveillance System, 122 Cities Mortality Reporting System and influenza-associated pediatric deaths;
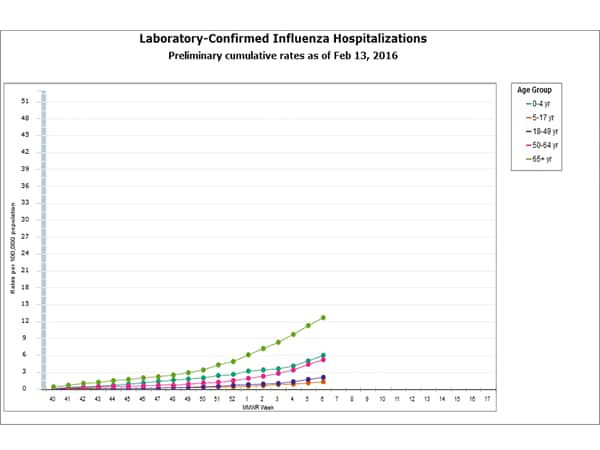
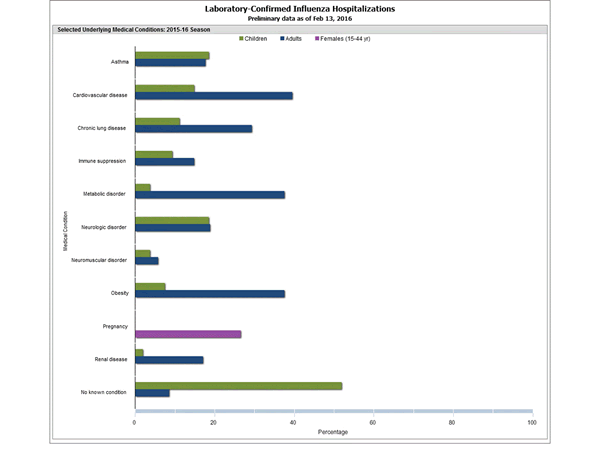
- Hospitalizations:Influenza Hospitalization Network (FluSurv-NET) including the Emerging Infections Program (EIP) and three additional states;
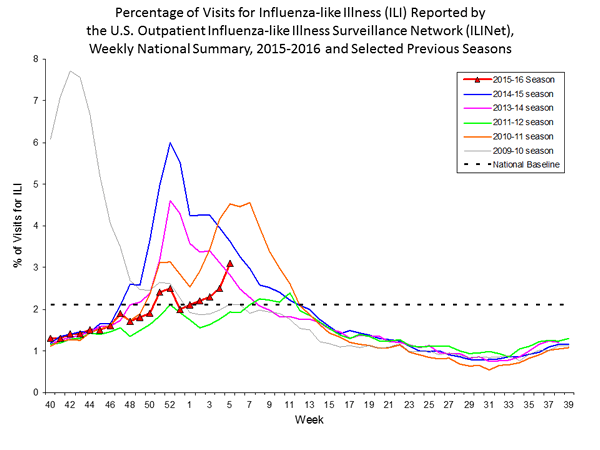
- Outpatient Illness Surveillance:U.S. Outpatient Influenza-like Illness Surveillance Network (ILINet);
- Geographic Spread of Influenza:State and territorial epidemiologists’ reports.
An overview of the CDC influenza surveillance system, including methodology and detailed descriptions of each data component, is available at: http://www.cdc.gov/flu/weekly/overview.htm.
–>
Synopsis:
During week 6 (February 7-13, 2016), influenza activity increased in the United States.
- Viral Surveillance: The most frequently identified influenza virus type reported by public health laboratories during week 6 was influenza A, with influenza A (H1N1)pdm09 viruses predominating. The percentage of respiratory specimens testing positive for influenza in clinical laboratories increased.
<!–
- Novel Influenza A Virus: One human infection with a novel influenza A virus was reported.
–>
- Pneumonia and Influenza Mortality: The proportion of deaths attributed to pneumonia and influenza (P&I) was below their system-specific epidemic threshold in both the NCHS Mortality Surveillance System and the 122 Cities Mortality Reporting System.
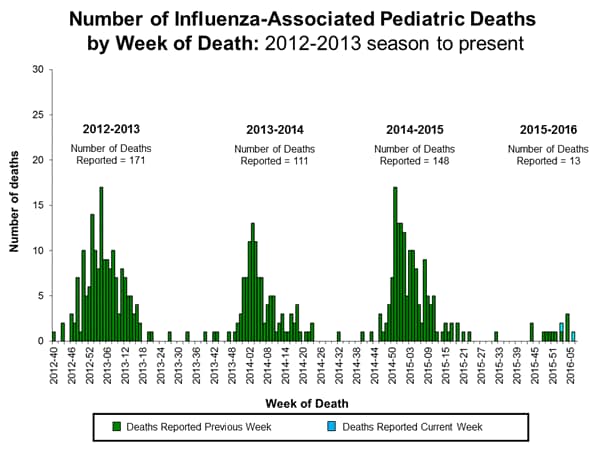
- Influenza-associated Pediatric Deaths: Two influenza-associated pediatric deaths were reported.
- Influenza-associated Hospitalizations: A cumulative rate for the season of 4.1 laboratory-confirmed influenza-associated hospitalizations per 100,000 population was reported.
- Outpatient Illness Surveillance: The proportion of outpatient visits for influenza-like illness (ILI) was 3.1%, which is above the national baseline of 2.1%. Nine of 10 regions reported ILI at or above region-specific baseline levels. Puerto Rico and two states experienced high ILI activity; New York City and 11 states experienced moderate ILI activity; 6 states experienced low ILI activity; 30 states experienced minimal ILI activity; and the District of Columbia and one state had insufficient data.
- Geographic Spread of Influenza: The geographic spread of influenza in Puerto Rico and 12 states was reported as widespread; 20 states reported regional activity; the District of Columbia, Guam, and 15 states reported local activity; and the U.S. Virgin Islands and three states reported sporadic activity.
Region and state-specific data are available at http://www.cdc.gov/flu/weekly/nchs.htm.
122 Cities Mortality Reporting System:
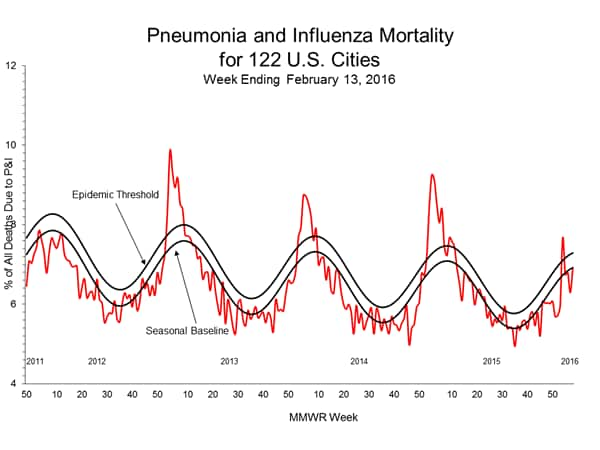
During week 6, 6.9% of all deaths reported through the 122 Cities Mortality Reporting System were due to P&I. This percentage was below the epidemic threshold of 7.3% for week 6.
 Additional data can be found at: http://gis.cdc.gov/GRASP/Fluview/PedFluDeath.html.
Additional FluSurv-NET data can be found at: http://gis.cdc.gov/GRASP/Fluview/FluHospRates.html and http://gis.cdc.gov/grasp/fluview/FluHospChars.html.
Data from the Influenza Hospitalization Surveillance Network (FluSurv-NET), a population-based surveillance for influenza related hospitalizations in children and adults in 13 U.S. states. Cumulative incidence rates are calculated using the National Center for Health Statistics’ (NCHS) population estimates for the counties included in the surveillance catchment area.
Additional data are available at http://gis.cdc.gov/grasp/fluview/fluportaldashboard.html.


