Archive for the ‘Climate Change’ Category
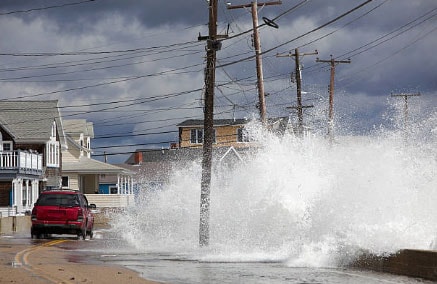
U.S. coastal areas will require significant spending to ride out future storms and rising sea levels — not in decades, but now and in the very near future.
Sunday, June 23rd, 2019“……By 2040, simply providing basic storm-surge protection in the form of sea walls for all coastal cities with more than 25,000 residents will require at least $42 billion, according to new estimates from the Center for Climate Integrity, an environmental advocacy group. Expanding the list to include communities smaller than 25,000 people would increase that cost to more than $400 billion. …….”
Climate change: Vibrio vulnificus reaches Delaware Bay
Wednesday, June 19th, 2019“…..In the past two years, five cases of Vibrio vulnificus, a flesh-eating bacterial infection that is spread by handling or eating contaminated seafood, have been linked to Delaware Bay……
Vibrio vulnificus usually occurs in high-salinity, brackish waters with surface temperatures above 13 degrees Celsius, or 55 degrees Fahrenheit, the study says. It has typically been found in the warm waters of the Gulf Coast and southern states like Louisiana and Texas, especially during the months from May to October.
Vibrio vulnificus causes about 205 infections in the United States every year the CDC estimates. The CDC also said it is important to learn more about the harmful bacteria if you live in areas where hurricanes, storm surges and coastal flooding are possible. The most common cause of infection is eating raw or undercooked shellfish, particularly oysters…..”
King M, Rose L, Fraimow H, Nagori M, Danish M, Doktor K. Vibrio vulnificus Infections From a Previously Nonendemic Area. Ann Intern Med. [Epub ahead of print 18 June 2019] doi: 10.7326/L19-0133

One answer to climate change and the worsening human condition: Camel milk
Friday, May 17th, 2019“……But the snorting beasts now have an additional benefit. They are being hailed for their ability to withstand climate-related droughts that are set to worsen in the Horn of Africa, where temperatures average above 30 degrees Celsius parts of the year.
Their milk has been dubbed “white gold” by food experts who say the creamy liquid could help conquer malnutrition, diabetes and other medical concerns, making it a tempting new superfood for health-conscious Western consumers.
With a growth in camel milk products available – from chocolate bars to baby milk formula and ice cream to “camelcino” coffees – there is a growing demand from consumers from North America to China, market experts say.
“If there is water scarcity, (camels) can go a month without water. Even when they are thirsty they can still produce milk – there is no downside to camels,” said Issack who uses money from milk sales to support his family…..
Camel milk is especially nutritious for young children and the elderly, she said, and selling it to passersby has allowed her to pay her debts and her children’s school fees.
The milk, commonly drunk in countries from the United Arab Emirates to Chad and Mongolia, has a vitamin C content three times as rich as cow’s milk, according to the FAO, and can benefit those who lack access to a varied and balanced diet.
“It’s widely claimed that there are lots of medicinal properties to the milk. It’s a different make-up of the proteins, carbohydrates and fatty acids,” said Simpkin.
“That’s what makes people claim that it’s much more nutritious.”………”
“
The Mauna Loa Observatory, which has measured the parts per million (ppm) of CO2 in the atmosphere since 1958, took a reading of 415.26ppm in the air on 11 May – thought to be the highest concentration since humans evolved.
Wednesday, May 15th, 2019
Site: https://www.ncdc.noaa.gov/paleo-search/study/6091
DOI: https://doi.org/10.1038/nature06949
Citation: Lüthi, D., M. Le Floch, B. Bereiter, T. Blunier, J.-M. Barnola, U. Siegenthaler, D. Raynaud, J. Jouzel, H. Fischer, K. Kawamura, and T.F. Stocker. 2008. High-resolution carbon dioxide concentration record 650,000-800,000 years before present. Nature, Vol. 453, pp. 379-382, 15 May 2008.
Costa Rica: Going “Green”
Friday, March 15th, 2019“……Costa Rica’s green bid, though fraught with challenges, has a head start. Electricity comes largely from renewable sources already — chiefly hydropower, but also wind, solar and geothermal energy. The country has doubled its forest cover in the last 30 years, after decades of deforestation, so that half of its land surface is now covered with trees. ……”
https://www.youtube.com/watch?v=65M4Dlvx-r0
Two damning reports on the negative impact of climate change on global health……
Thursday, February 21st, 2019“…..another dire warning about climate change, released yesterday in The Lancet, the New York Times reported. The report comes on the heels of the US government’s National Climate Assessment, which dropped on Black Friday—and echoes many of its findings. The 2 reports offer the gravest warning yet about the myriad, interconnected health risks of climate change….”
NASA: 2018 was Fourth Warmest Year in Continued Warming Trend
Friday, February 8th, 2019
According to an ongoing temperature analysis conducted by scientists at NASA’s Goddard Institute for Space Studies, the average global temperature on Earth has increased by about 0.8° Celsius (1.4° Fahrenheit) since 1880. Two-thirds of the warming has occurred since 1975, at a rate of roughly 0.15-0.20°C per decade.
Australia: State of the Climate
Sunday, February 3rd, 2019Australia: State of the Climate
Key points
Australia
- Australia’s climate has warmed just over 1 °C since 1910 leading to an increase in the frequency of extreme heat events.
- Oceans around Australia have warmed by around 1 °C since 1910, contributing to longer and more frequent marine heatwaves.
- Sea levels are rising around Australia, increasing the risk of inundation.
- The oceans around Australia are acidifying (the pH is decreasing).
- April to October rainfall has decreased in the southwest of Australia. Across the same region May–July rainfall has seen the largest decrease, by around 20 per cent since 1970.
- There has been a decline of around 11 per cent in April–October rainfall in the southeast of Australia since the late 1990s.
- Rainfall has increased across parts of northern Australia since the 1970s.
- Streamflow has decreased across southern Australia. Streamflow has increased in northern Australia where rainfall has increased.
- There has been a long-term increase in extreme fire weather, and in the length of the fire season, across large parts of Australia.
Global
- Concentrations of all the major long-lived greenhouse gases in the atmosphere continue to increase, with carbon dioxide (CO 2) concentrations rising above 400 ppm since 2016 and the CO 2 equivalent (CO 2-e) of all gases reaching 500 ppm for the first time in at least 800,000 years.
- Emissions from fossil fuels continue to increase and are the main contributor to the observed growth in atmospheric CO2.
- The world’s oceans, especially in the southern hemisphere, are taking up more than 90 per cent of the extra energy stored by the planet as a result of enhanced greenhouse gas concentrations.
- Global sea level has risen by over 20 cm since 1880, and the rate has been accelerating in recent decades.
- Globally averaged air temperature has warmed by over 1 °C since records began in 1850, and each of the last four decades has been warmer than the previous one.
Future
Australia is projected to experience:
- Further increases in sea and air temperatures, with more hot days and marine heatwaves, and fewer cool extremes.
- Further sea level rise and ocean acidification.
- Decreases in rainfall across southern Australia with more time in drought, but an increase in intense heavy rainfall throughout Australia.


