Archive for the ‘Influenza’ Category
Highly pathogenic H5N8 avian flu outbreaks have hit more than a dozen countries
Saturday, December 10th, 2016Citation style for this article: Adlhoch C, Brown IH, Angelova SG, Bálint Á, Bouwstra R, Buda S, Castrucci MR, Dabrera G, Dán Á, Grund C, Harder T, van der Hoek W, Krisztalovics K, Parry-Ford F, Popescu R, Wallensten A, Zdravkova A, Zohari S, Tsolova S, Penttinen P. Highly pathogenic avian influenza A(H5N8) outbreaks: protection and management of exposed people in Europe, 2014/15 and 2016. Euro Surveill. 2016;21(49):pii=30419. DOI: http://dx.doi.org/10.2807/1560-7917.ES.2016.21.49.30419
During week 11 (March 13-19, 2016), influenza activity decreased slightly, but remained elevated in the United States.
Sunday, March 27th, 2016
Synopsis:
During week 11 (March 13-19, 2016), influenza activity decreased slightly, but remained elevated in the United States.
- Viral Surveillance: The most frequently identified influenza virus type reported by public health laboratories during week 11 was influenza A, with influenza A (H1N1)pdm09 viruses predominating. The percentage of respiratory specimens testing positive for influenza in clinical laboratories decreased.
- Novel Influenza A Virus: One human infection with a novel influenza A virus was reported.
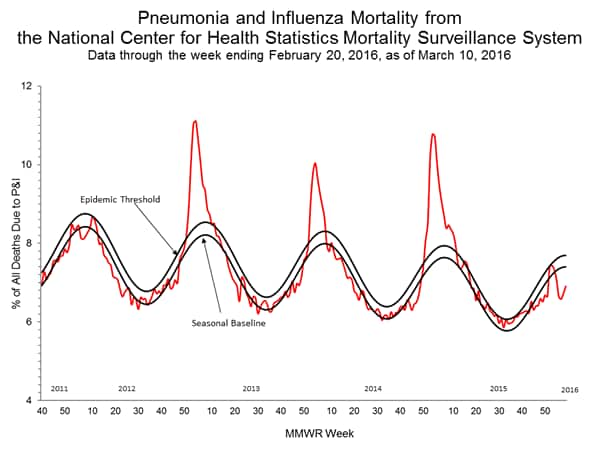
- Pneumonia and Influenza Mortality: The proportion of deaths attributed to pneumonia and influenza (P&I) was below the system-specific epidemic threshold in the NCHS Mortality Surveillance System and above the system-specific epidemic threshold in the 122 Cities Mortality Reporting System.
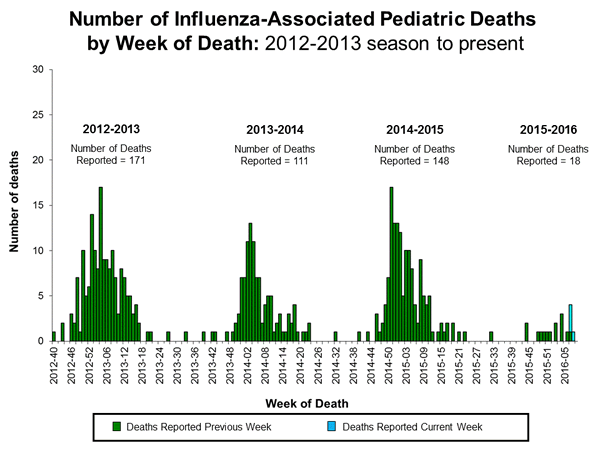
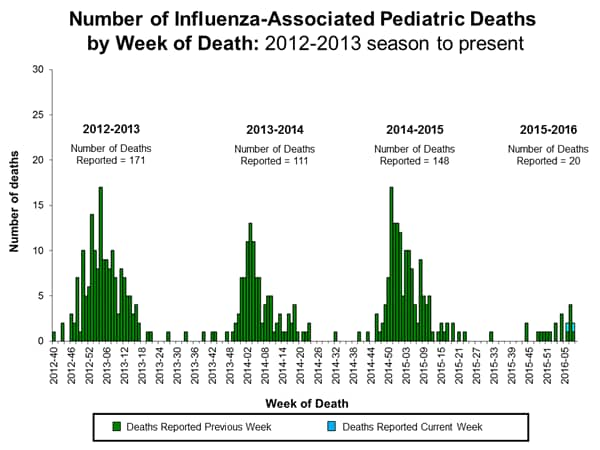
- Influenza-associated Pediatric Deaths: Two influenza-associated pediatric deaths were reported.
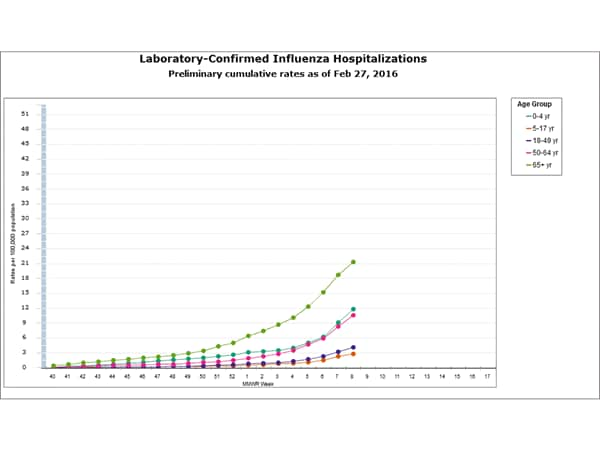
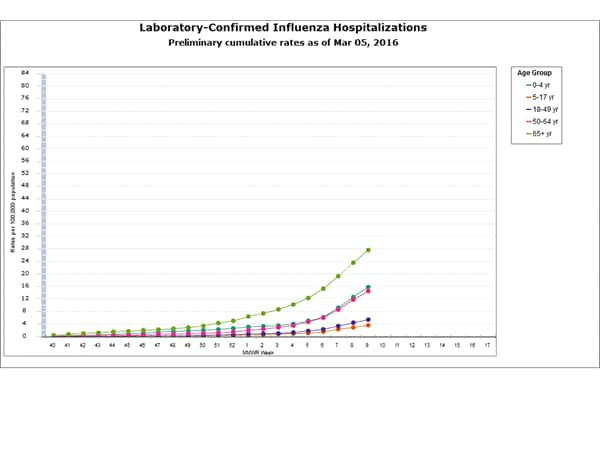
- Influenza-associated Hospitalizations: A cumulative rate for the season of 18.2 laboratory-confirmed influenza-associated hospitalizations per 100,000 population was reported.
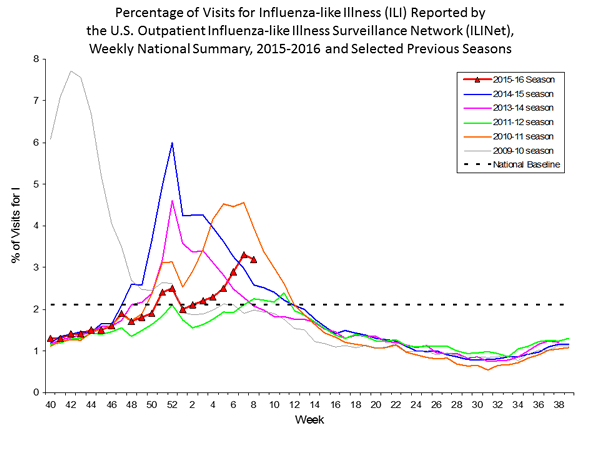
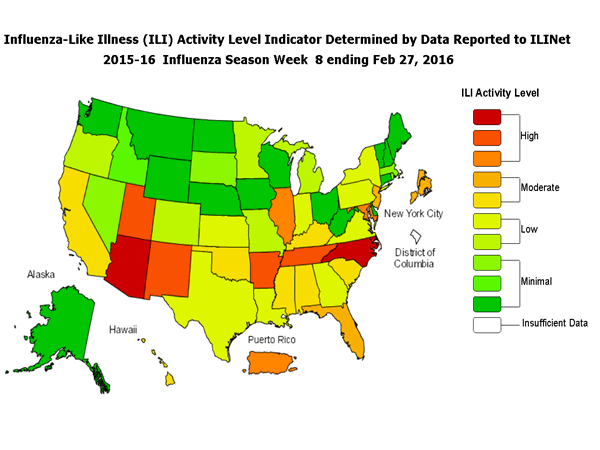
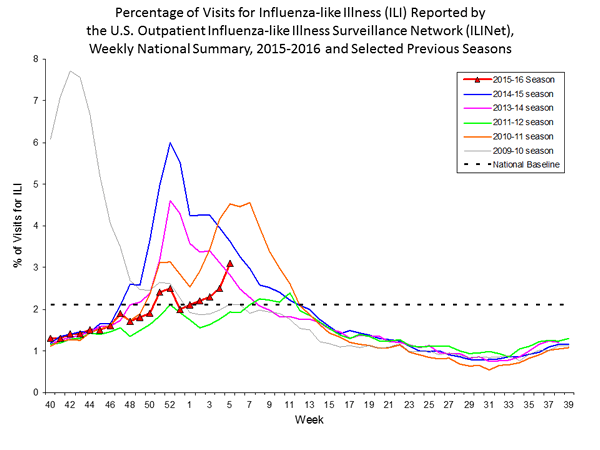
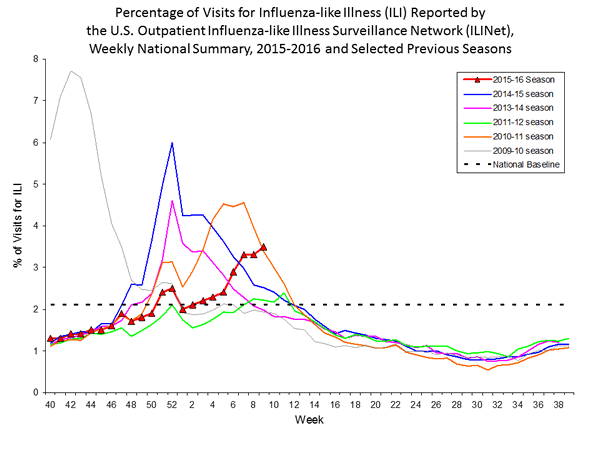
- Outpatient Illness Surveillance: The proportion of outpatient visits for influenza-like illness (ILI) was 3.2%, which is above the national baseline of 2.1%. All 10 regions reported ILI at or above region-specific baseline levels. Puerto Rico and seven states experienced high ILI activity; New York City and eight states experienced moderate ILI activity; 20 states experienced low ILI activity; 15 states experienced minimal ILI activity; and the District of Columbia had insufficient data.
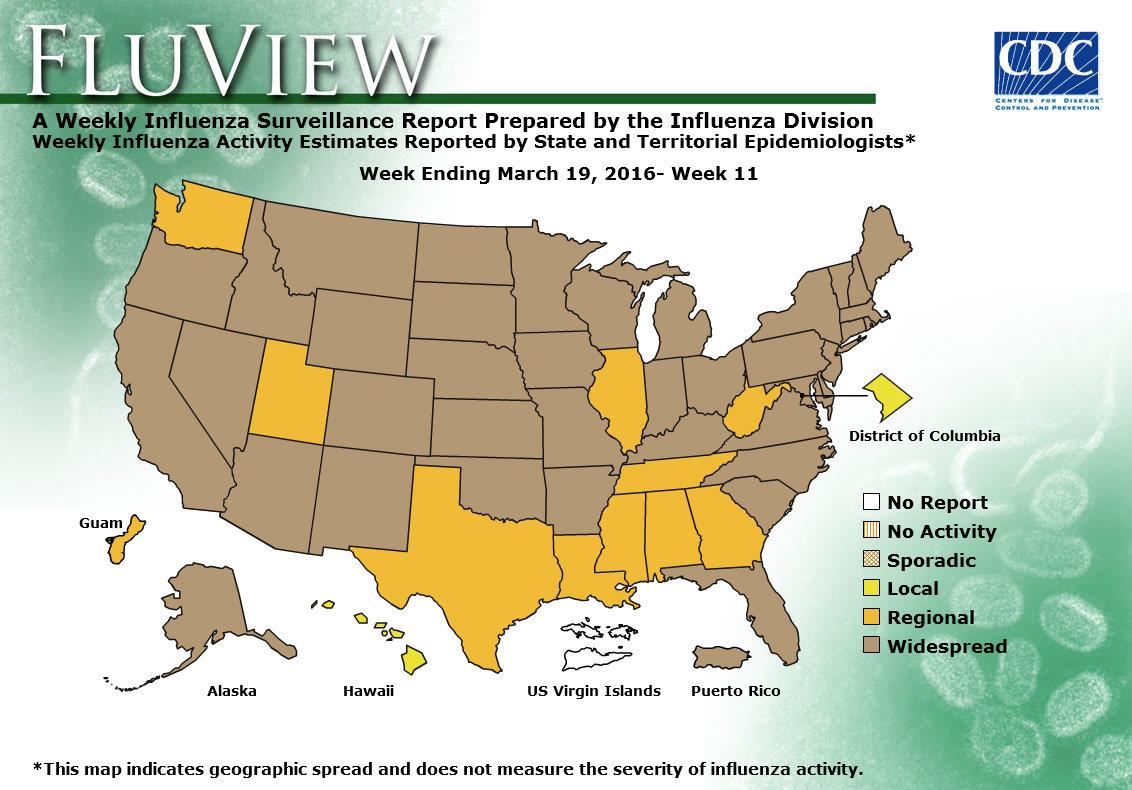
- Geographic Spread of Influenza: The geographic spread of influenza in Puerto Rico and 39 states was reported as widespread; Guam and 10 states reported regional activity; the District of Columbia and one state reported local activity; and the U.S. Virgin Islands did not report.
<!–
–>
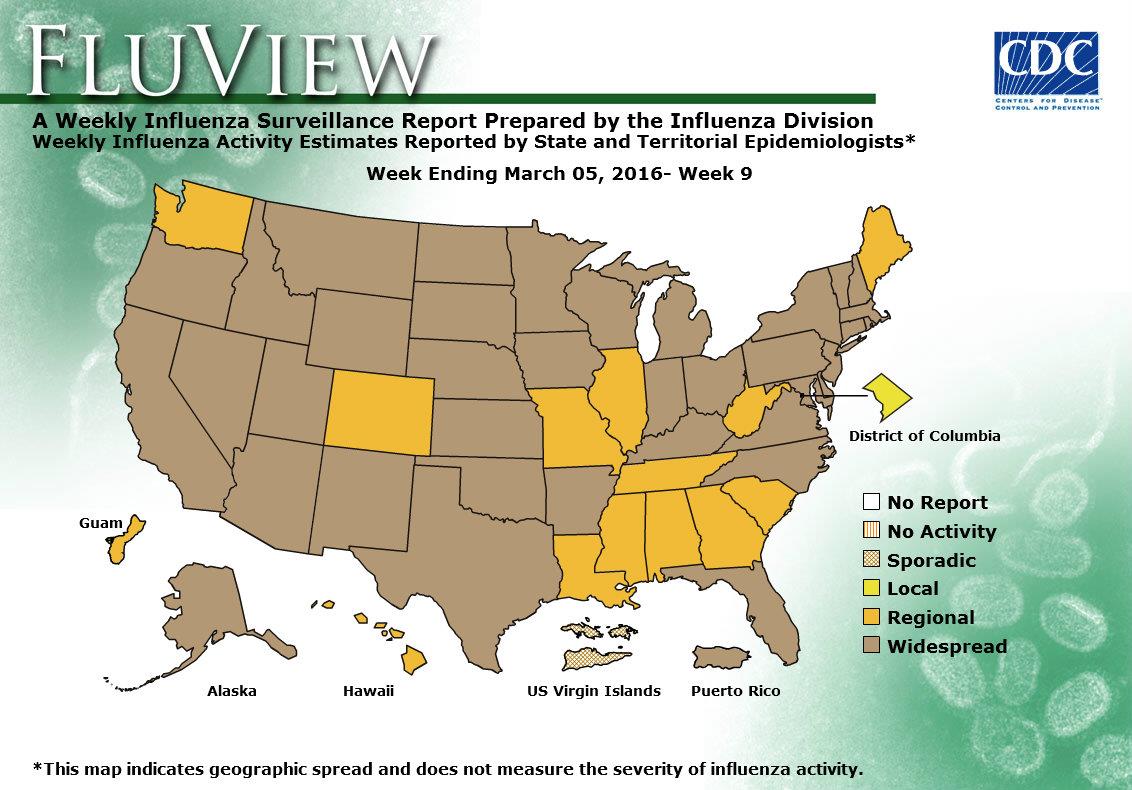
** CDC: During week 9 (February 28-March 5, 2016), influenza activity remained elevated in the United States.
Saturday, March 12th, 2016
- Viral Surveillance: The most frequently identified influenza virus type reported by public health laboratories during week 9 was influenza A, with influenza A (H1N1)pdm09 viruses predominating. The percentage of respiratory specimens testing positive for influenza in clinical laboratories increased.
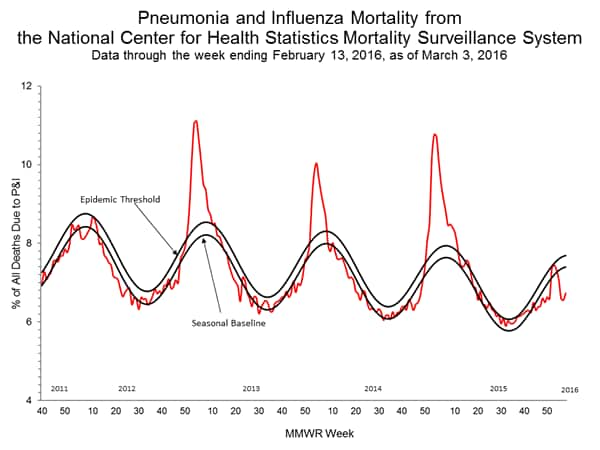
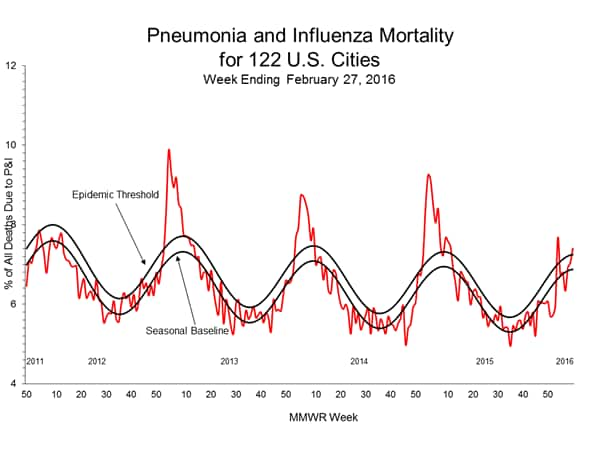
- Pneumonia and Influenza Mortality: The proportion of deaths attributed to pneumonia and influenza (P&I) was below their system-specific epidemic threshold in both the NCHS Mortality Surveillance System and the 122 Cities Mortality Reporting System.
- Influenza-associated Pediatric Deaths: Two influenza-associated pediatric deaths were reported.
- Influenza-associated Hospitalizations: A cumulative rate for the season of 10.4 laboratory-confirmed influenza-associated hospitalizations per 100,000 population was reported.
- Outpatient Illness Surveillance: The proportion of outpatient visits for influenza-like illness (ILI) was 3.5%, which is above the national baseline of 2.1%. All 10 regions reported ILI at or above region-specific baseline levels. Puerto Rico and 10 states experienced high ILI activity; New York City and 13 states experienced moderate ILI activity; 12 states experienced low ILI activity; 15 states experienced minimal ILI activity; and the District of Columbia had insufficient data.
- Geographic Spread of Influenza: The geographic spread of influenza in Puerto Rico and 37 states was reported as widespread; Guam and 13 states reported regional activity; the District of Columbia reported local activity; and the U.S. Virgin Islands reported sporadic activity.
Flu levels in the Northern Hemisphere continued to rise, especially in Europe and North America.
Thursday, March 10th, 2016
Summary
In the Northern Hemisphere high levels of influenza activity continued with influenza A(H1N1)pdm09 predominating and an increase in the proportion of influenza B viruses detected. In the Southern Hemisphere and in tropical countries influenza activity was generally low.
- In Europe ongoing high levels of influenza activity continued to be reported, although in some countries activity seemed to have peaked already. Influenza A(H1N1)pdm09 accounted for most virus detections with an increase in the proportion of influenza B detections. In Russian Federation and Ukraine, elevated SARI activity continued but at lower levels compared to previous weeks.
- In North America, influenza activity increased further with influenza A(H1N1)pdm09 predominating in Canada and United States of America and A(H3N2) in Mexico.
- In Northern/Temperate Asia, influenza activity remained high but seemed to have peaked already in some countries.
- In Western Asia, influenza activity continued to decrease. Oman reported ongoing low levels of both influenza A(H1N1)pdm09 and influenza B viruses.
- In Africa influenza A(H1N1)pdm09 activity was reported in northern Africa.
- In tropical countries of the Americas, Central America and the Caribbean, influenza and other respiratory virus activity were overall at low levels, except Jamaica, and Puerto Rico with high but decreasing influenza activity.
- In South East Asia, ongoing low influenza activity was reported during this period.
- In the temperate countries of the Southern Hemisphere influenza activity remained low at inter-seasonal level.
- National Influenza Centres (NICs) and other national influenza laboratories from 98 countries, areas or territories reported data to FluNet for the time period from 08 February 2016 to 21 February 2016* (data as of 2016-03-04 07:20:12 UTC).The WHO GISRS laboratories tested more than 158158 specimens during that time period. 42727 were positive for influenza viruses, of which 33745 (79%) were typed as influenza A and 8982 (21%) as influenza B. Of the sub-typed influenza A viruses, 19269 (87.7%) were influenza A(H1N1)pdm09 and 2709 (12.3%) were influenza A(H3N2). Of the characterized B viruses, 589 (24.4%) belonged to the B-Yamagata lineage and 1821 (75.6%) to the B-Victoria lineage.
** CDC: Seasonal Flu Activity (week 8, February 21-27, 2016)
Saturday, March 5th, 2016
During week 8 (February 21-27, 2016), influenza activity remained elevated in the United States.
- Viral Surveillance: The most frequently identified influenza virus type reported by public health laboratories during week 8 was influenza A, with influenza A (H1N1)pdm09 viruses predominating. The percentage of respiratory specimens testing positive for influenza in clinical laboratories increased.
- Novel Influenza A Virus: One human infection with a novel influenza A virus was reported.
- Pneumonia and Influenza Mortality: The proportion of deaths attributed to pneumonia and influenza (P&I) was below the system-specific epidemic threshold in the NCHS Mortality Surveillance System and above the system-specific epidemic threshold in the 122 Cities Mortality Reporting System.
- Influenza-associated Pediatric Deaths: Four influenza-associated pediatric deaths were reported.
- Influenza-associated Hospitalizations: A cumulative rate for the season of 7.8 laboratory-confirmed influenza-associated hospitalizations per 100,000 population was reported.
- Outpatient Illness Surveillance: The proportion of outpatient visits for influenza-like illness (ILI) was 3.2%, which is above the national baseline of 2.1%. Nine of 10 regions reported ILI at or above region-specific baseline levels. Puerto Rico and eight states experienced high ILI activity; New York City and nine states experienced moderate ILI activity; 13 states experienced low ILI activity; 20 states experienced minimal ILI activity; and the District of Columbia had insufficient data.
- Geographic Spread of Influenza: The geographic spread of influenza in Puerto Rico and 33 states was reported as widespread; Guam and 14 states reported regional activity; the District of Columbia and one state reported local activity; and the U.S. Virgin Islands and two states reported sporadic activity.
<!–
–>
** The overall effectiveness of this year’s flu vaccine is 59%. Getting a flu vaccine this season reduced the risk of having to go to the doctor because of flu by nearly 60%
Friday, February 26th, 2016CDC: Flu activity increased in the United States.
Sunday, February 21st, 2016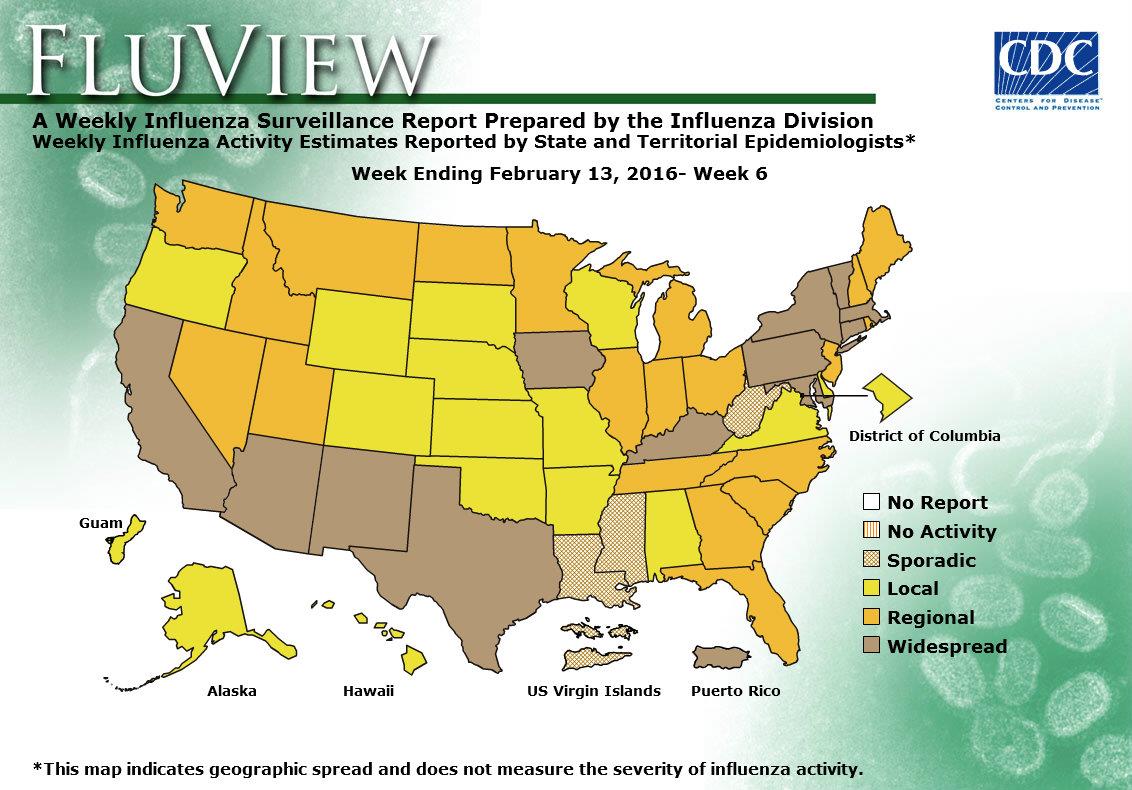
The influenza activity reported by state and territorial epidemiologists indicates geographic spread of influenza viruses, but does not measure the severity of influenza activity.
During week 6, the following influenza activity was reported:
- Widespread influenza activity was reported by Puerto Rico and 12 states (Arizona, California, Connecticut, Iowa, Kentucky, Maryland, Massachusetts, New Mexico, New York, Pennsylvania, Texas, and Vermont).
- Regional influenza activity was reported by 20 states (Florida, Georgia, Idaho, Illinois, Indiana, Maine, Michigan, Minnesota, Montana, Nevada, New Hampshire, New Jersey, North Carolina, North Dakota, Ohio, Rhode Island, South Carolina, Tennessee, Utah, and Washington).
- Local influenza activity was reported by the District of Columbia, Guam and 15 states (Alabama, Alaska, Arkansas, Colorado, Delaware, Hawaii, Kansas, Missouri, Nebraska, Oklahoma, Oregon, South Dakota, Virginia, Wisconsin, and Wyoming).
- Sporadic influenza activity was reported by the U.S. Virgin Islands and three states (Louisiana, Mississippi, and West Virginia).
2015-2016 Influenza Season Week 6 ending February 13, 2016
Saturday, February 20th, 2016
Background:
The Centers for Disease Control and Prevention’s (CDC) Influenza Division collects, compiles, and analyzes information on influenza activity year-round in the United States and produces FluView, a weekly influenza surveillance report, and FluView Interactive. The U.S. influenza surveillance system provides information in five categories collected from nine data sources. This is the first report of the 2015-2016 influenza season, which began on October 4, 2015.
The five categories and nine data components of CDC influenza surveillance are:
- Viral Surveillance:U.S. World Health Organization (WHO) collaborating laboratories, the National Respiratory and Enteric Virus Surveillance System (NREVSS), and human infection with novel influenza A virus case reporting;
- Mortality:National Center for Health Statistics (NCHS) Mortality Surveillance System, 122 Cities Mortality Reporting System and influenza-associated pediatric deaths;
- Hospitalizations:Influenza Hospitalization Network (FluSurv-NET) including the Emerging Infections Program (EIP) and three additional states;
- Outpatient Illness Surveillance:U.S. Outpatient Influenza-like Illness Surveillance Network (ILINet);
- Geographic Spread of Influenza:State and territorial epidemiologists’ reports.
An overview of the CDC influenza surveillance system, including methodology and detailed descriptions of each data component, is available at: http://www.cdc.gov/flu/weekly/overview.htm.
–>
Synopsis:
During week 6 (February 7-13, 2016), influenza activity increased in the United States.
- Viral Surveillance: The most frequently identified influenza virus type reported by public health laboratories during week 6 was influenza A, with influenza A (H1N1)pdm09 viruses predominating. The percentage of respiratory specimens testing positive for influenza in clinical laboratories increased.
<!–
- Novel Influenza A Virus: One human infection with a novel influenza A virus was reported.
–>
- Pneumonia and Influenza Mortality: The proportion of deaths attributed to pneumonia and influenza (P&I) was below their system-specific epidemic threshold in both the NCHS Mortality Surveillance System and the 122 Cities Mortality Reporting System.
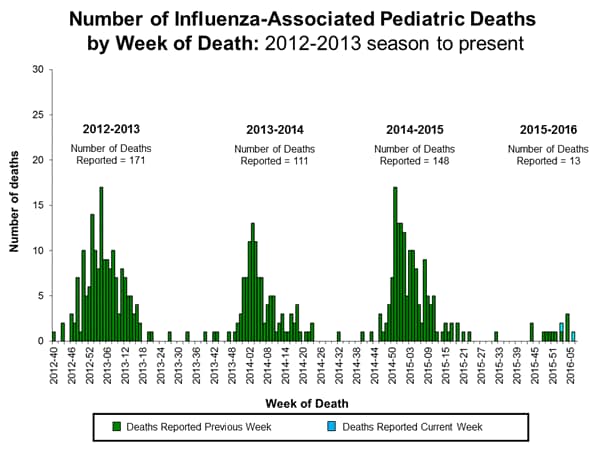
- Influenza-associated Pediatric Deaths: Two influenza-associated pediatric deaths were reported.
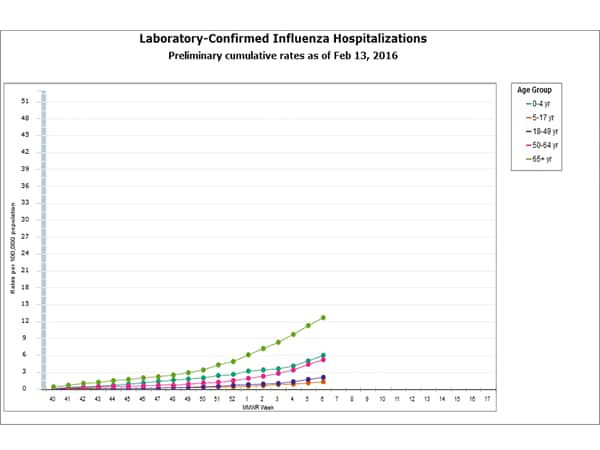
- Influenza-associated Hospitalizations: A cumulative rate for the season of 4.1 laboratory-confirmed influenza-associated hospitalizations per 100,000 population was reported.
- Outpatient Illness Surveillance: The proportion of outpatient visits for influenza-like illness (ILI) was 3.1%, which is above the national baseline of 2.1%. Nine of 10 regions reported ILI at or above region-specific baseline levels. Puerto Rico and two states experienced high ILI activity; New York City and 11 states experienced moderate ILI activity; 6 states experienced low ILI activity; 30 states experienced minimal ILI activity; and the District of Columbia and one state had insufficient data.
- Geographic Spread of Influenza: The geographic spread of influenza in Puerto Rico and 12 states was reported as widespread; 20 states reported regional activity; the District of Columbia, Guam, and 15 states reported local activity; and the U.S. Virgin Islands and three states reported sporadic activity.
Region and state-specific data are available at http://www.cdc.gov/flu/weekly/nchs.htm.
122 Cities Mortality Reporting System:
During week 6, 6.9% of all deaths reported through the 122 Cities Mortality Reporting System were due to P&I. This percentage was below the epidemic threshold of 7.3% for week 6.
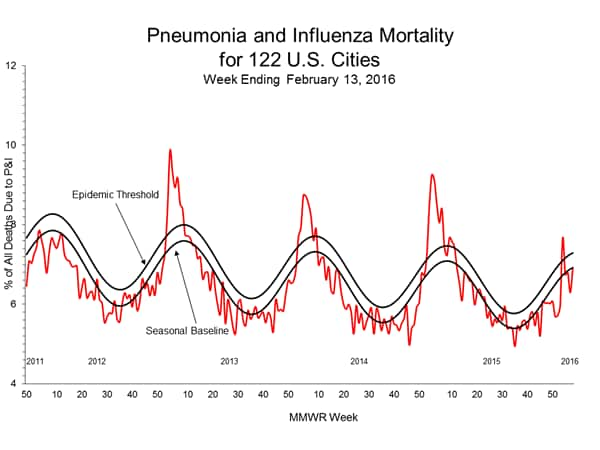 Additional data can be found at: http://gis.cdc.gov/GRASP/Fluview/PedFluDeath.html.
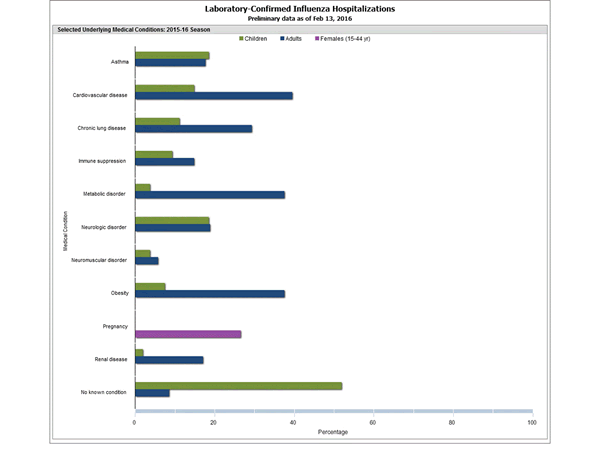
Additional FluSurv-NET data can be found at: http://gis.cdc.gov/GRASP/Fluview/FluHospRates.html and http://gis.cdc.gov/grasp/fluview/FluHospChars.html.
Data from the Influenza Hospitalization Surveillance Network (FluSurv-NET), a population-based surveillance for influenza related hospitalizations in children and adults in 13 U.S. states. Cumulative incidence rates are calculated using the National Center for Health Statistics’ (NCHS) population estimates for the counties included in the surveillance catchment area.
Additional data are available at http://gis.cdc.gov/grasp/fluview/fluportaldashboard.html.
During week 5 (January 31-February 6, 2016), influenza activity increased slightly in the United States.
Sunday, February 14th, 2016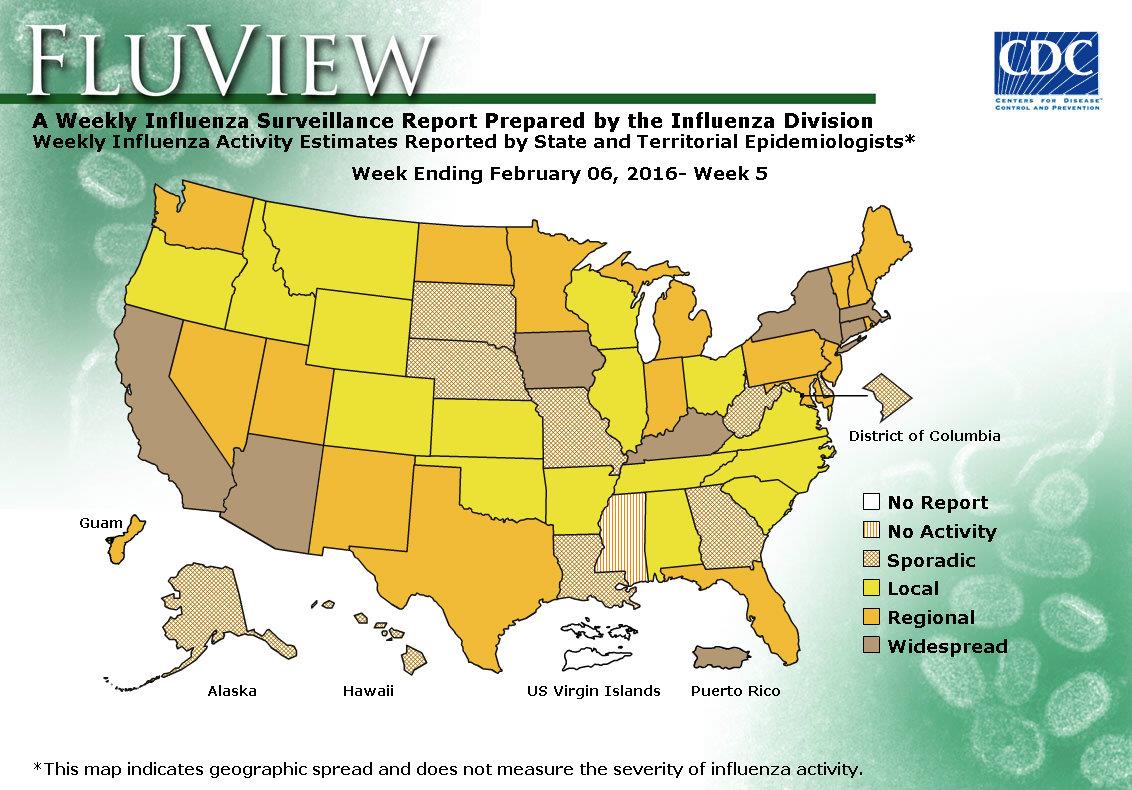
Current flu season: Watch out for H1N1 (so far evidence suggests the circulating strains are similar enough to the one in the vaccine to trigger protection.)
Wednesday, February 10th, 2016“…..8 February 2016
Compared to previous years, northern hemisphere seasonal influenza activity commenced late in some countries in western Europe, North America and eastern Asia. Transmission, as demonstrated by influenza-like illness (ILI) rates, has started to exceed country-specific baseline rates, but is still relatively low in general with the exception of some eastern European countries where a sharp increase of ILI rates has been observed and countries in western Asia where influenza activity may have already peaked.
Among the currently circulating seasonal influenza viruses in the temperate zone, influenza A(H1N1)pdm09 virus is predominating, except in northern China where influenza A(H3N2) and influenza B viruses are widely co-circulating though the proportion of A(H1N1)pdm09 virus is increasing. In a few European countries, influenza A(H3N2) and influenza B viruses are also circulating.
In some countries there have been reports of hospitalizations with severe disease associated with influenza A(H1N1)pdm09 virus infections. Based on the WHO global influenza surveillance, in countries with influenza A(H1N1)pdm09 virus predominating, the hospitalization and intensive care unit (ICU) admission patterns seem to be similar to previous seasons when this virus predominated and where young/middle-aged adults experienced severe disease……”


