Archive for the ‘Influenza’ Category
Week 4: Influenza in Michigan
Saturday, February 2nd, 2019- Number of reports by region: 34 total [C(9), N(3), SE(16), SW(6)]
- Proportion of visits due to ILI: ↑ 2.5% (regional baseline*: 1.8%)
- A total of 250 patient visits due to ILI were reported out of 10,161 office visit
- One (1) pediatric influenza (A/H1N1-09) death has been confirmed by MDHHS for the 2018-2019 flu season.
- Since Oct. 1, there have been 230 (35 pediatric, 195 adult) influenza-related hospitalizations reported in the catchment area for the 2018-2019 season.
- Michigan Sentinel Clinical Lab Respiratory Virus Data Eleven (11) sentinel clinical labs (3SE, 1SW, 6C, 1N) reported during this week
- SE Region • Influenza A: moderate; increasing • Influenza B: low • Parainfluenza: low-moderate • RSV: moderate; variable • Adenovirus: low • hMPV: low-moderate; slight decrease
- Central Region • Influenza A: low-moderate; some increases • Influenza B: sporadic • Parainfluenza: low • RSV: low-moderate; some decreases • Adenovirus: low • hMPV: very low
- SW Region • Influenza A: moderate; slight increase • Influenza B: sporadic • Parainfluenza: low; slight decrease • RSV: moderate; steady • Adenovirus: low • hMPV: low
- North Region • Influenza A: increased • Influenza B: sporadic • Parainfluenza: no data available • RSV: sporadic-low • Adenovirus: no data available • hMPV: no data available


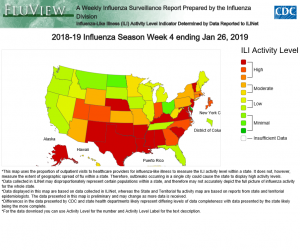
2018-2019 Influenza Season Week 4 ending January 26, 2019: Flu activity increased in the U.S.
Saturday, February 2nd, 2019


2018-2019 Influenza Season Week 3 ending January 19, 2019
Saturday, January 26th, 2019- Influenza activity increased in the United States.
- Influenza A(H1N1)pdm09, influenza A(H3N2), and influenza B viruses continue to co-circulate.
2018-2019 Influenza Season: Week 1 ending January 5, 2019
Saturday, January 12th, 2019CDC estimates that as of January 5:
- 6.2 to 7.3 million people have been sick with flu,
- 2.9 to 3.5 million people have been to the doctor because of flu, and
- 69,300 to 83,500 people have been hospitalized because of flu.
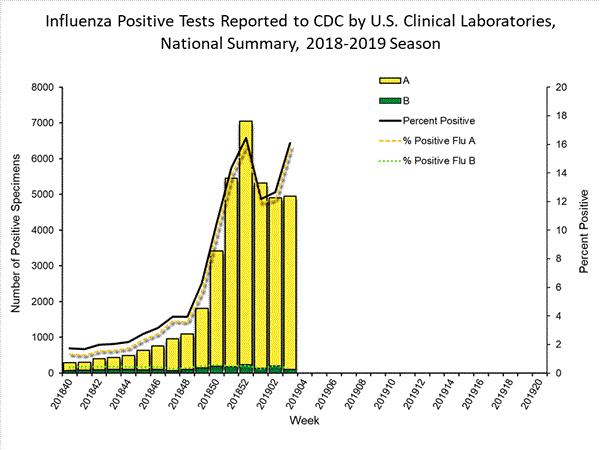
- Viral Surveillance: The percentage of respiratory specimens testing positive for influenza viruses in clinical laboratories decreased slightly. Influenza A viruses have predominated in the United States since the beginning of October. Influenza A(H1N1)pdm09 viruses have predominated in most areas of the country, however influenza A(H3) viruses have predominated in the southeastern United States (HHS Region 4).
- Virus Characterization: The majority of influenza viruses characterized antigenically and genetically are similar to the cell-grown reference viruses representing the 2018–2019 Northern Hemisphere influenza vaccine viruses.
- Antiviral Resistance: All viruses tested show susceptibility to the neuraminidase inhibitors (oseltamivir, zanamivir, and peramivir).
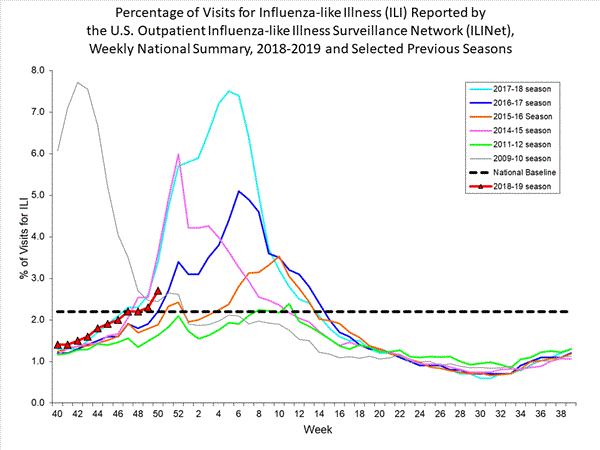
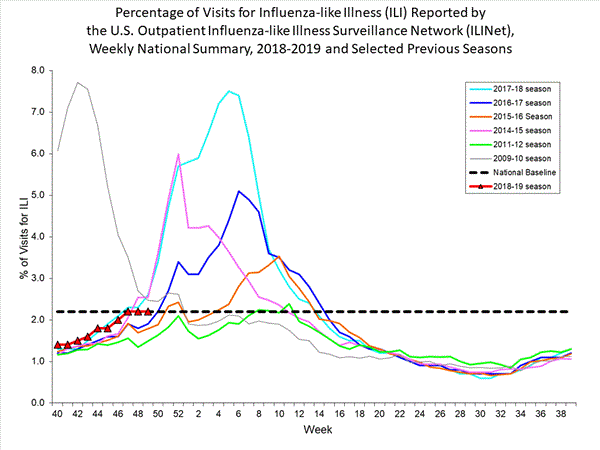
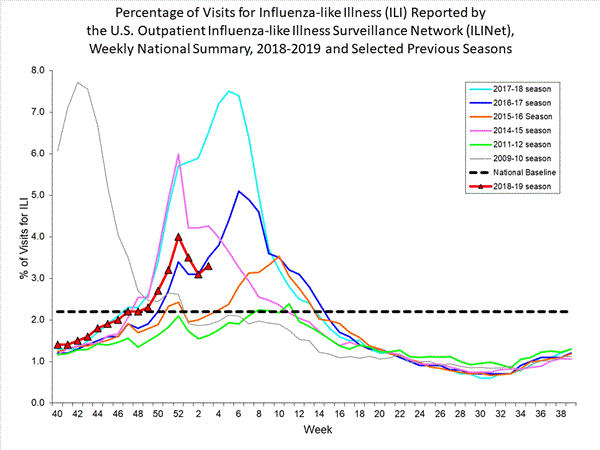
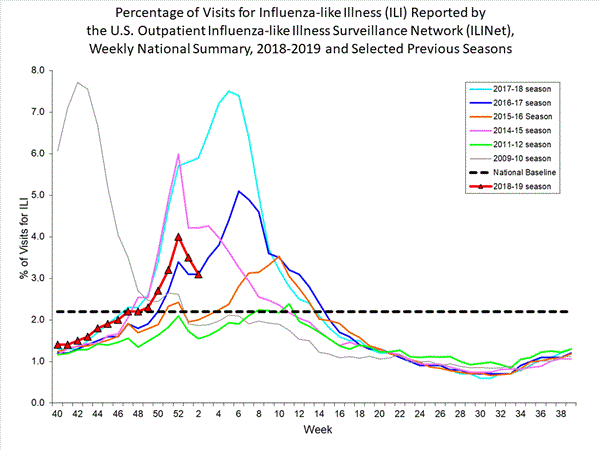
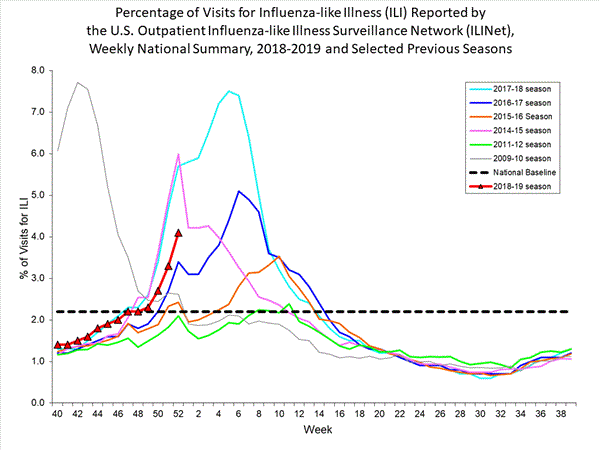
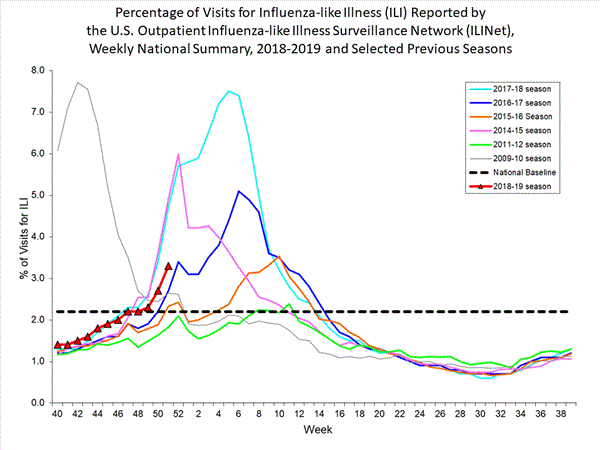
- Influenza-like Illness Surveillance:The proportion of outpatient visits for influenza-like illness (ILI) decreased from 4.0% to 3.5%, but remains above the national baseline of 2.2%. All 10 regions reported ILI at or above their region-specific baseline level.
- ILI State Activity Indictor Map: New York City and 15 states experienced high ILI activity; 12 states experienced moderate ILI activity; the District of Columbia, Puerto Rico and eight states experienced low ILI activity; and 15 states experienced minimal ILI activity.
- Geographic Spread of Influenza: The geographic spread of influenza in 30 states was reported as widespread; Puerto Rico and 17 states reported regional activity; two states reported local activity; the District of Columbia, the U.S. Virgin Islands and one state reported sporadic activity; and Guam did not report.
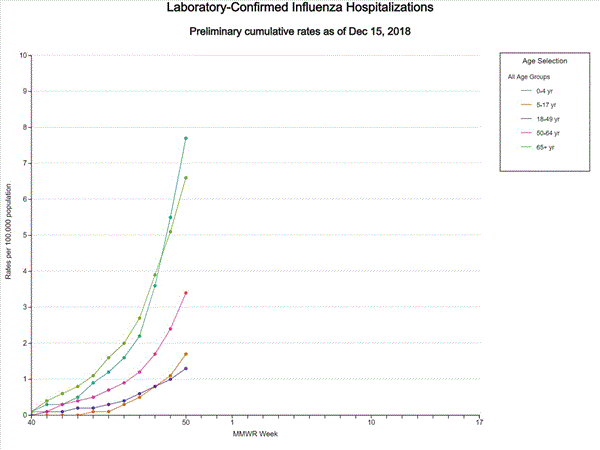
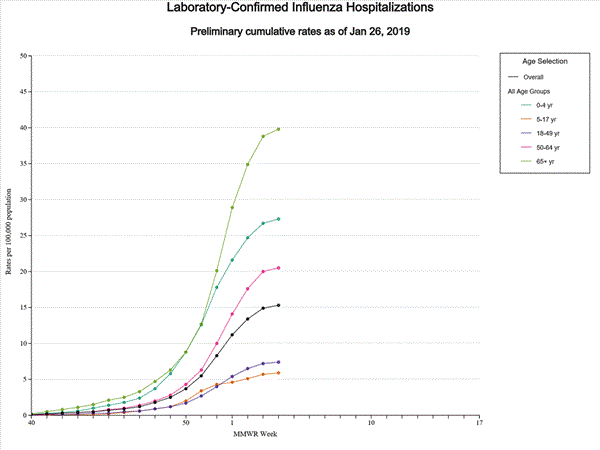
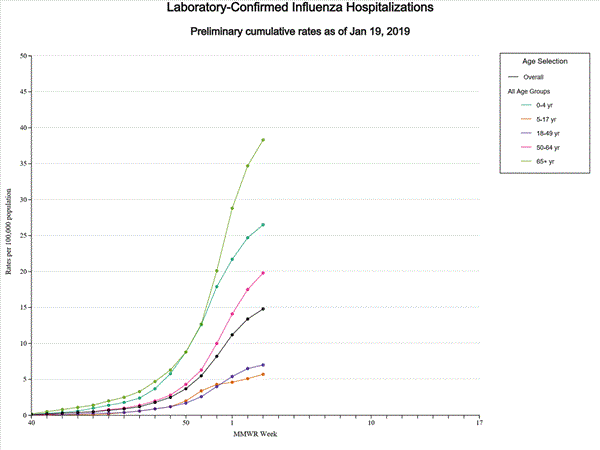
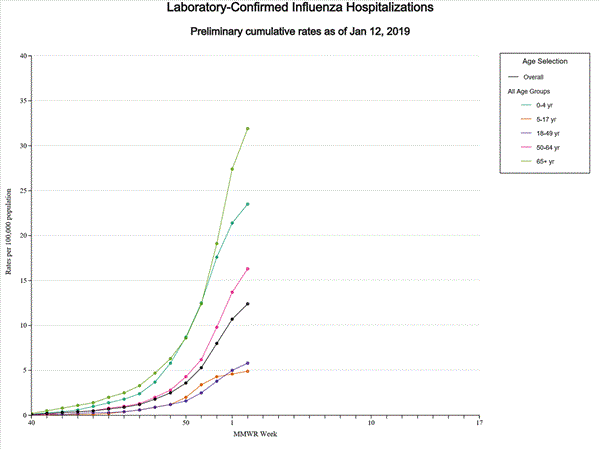
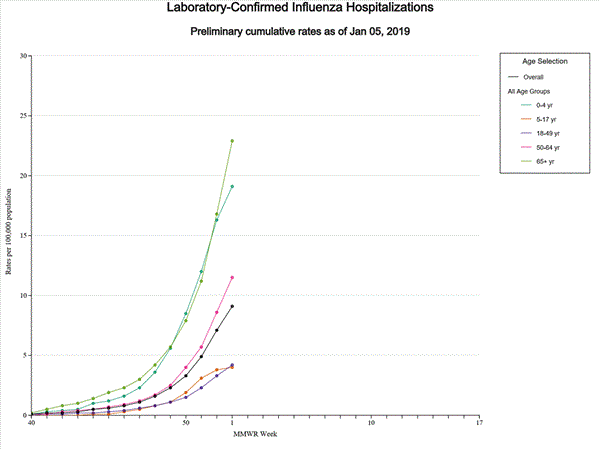
- Influenza-associated Hospitalizations A cumulative rate of 9.1 laboratory-confirmed influenza-associated hospitalizations per 100,000 population was reported. The highest hospitalization rate is among adults 65 years and older (22.9 hospitalizations per 100,000 population).
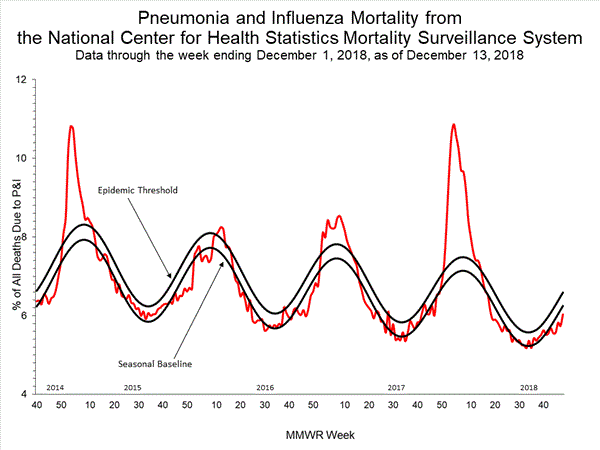
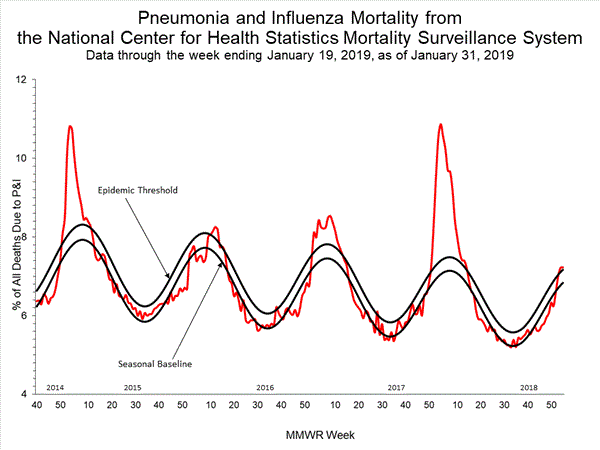
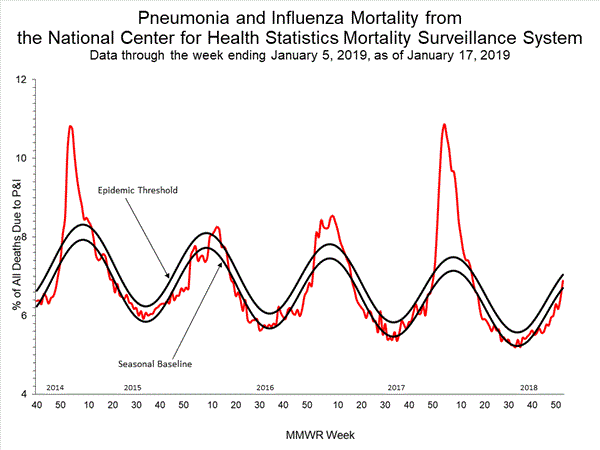
- Pneumonia and Influenza Mortality: The proportion of deaths attributed to pneumonia and influenza (P&I) was below the system-specific epidemic threshold in the National Center for Health Statistics (NCHS) Mortality Surveillance System.
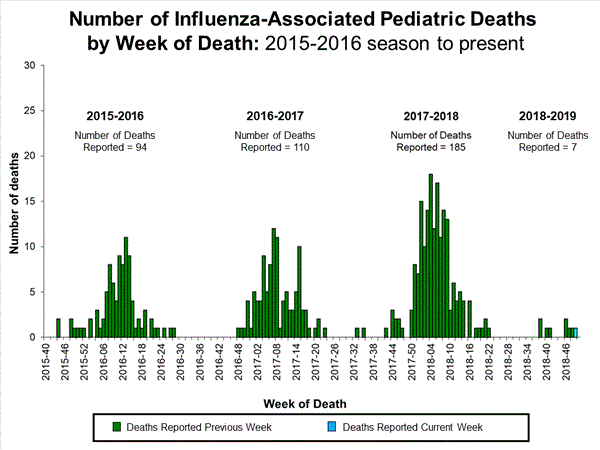
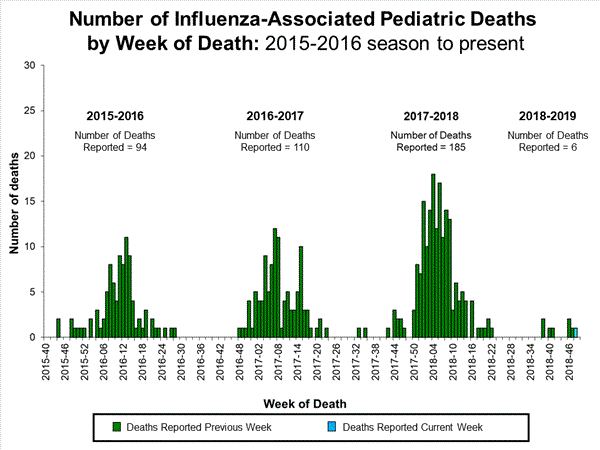
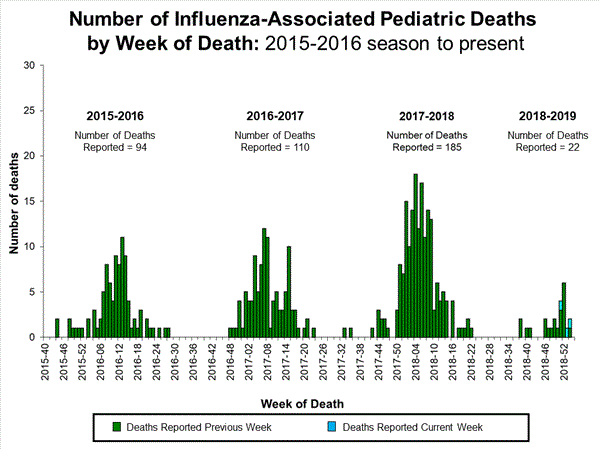
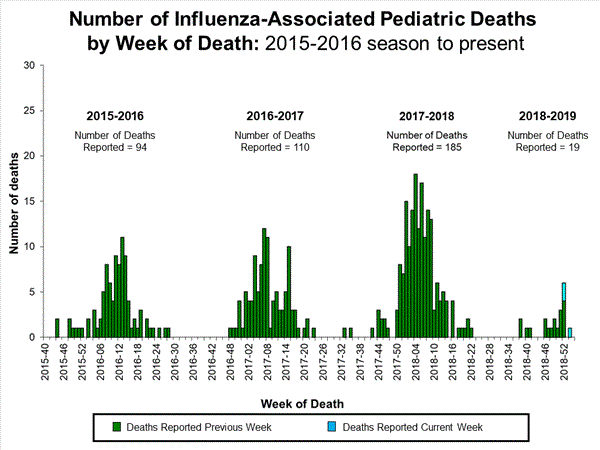
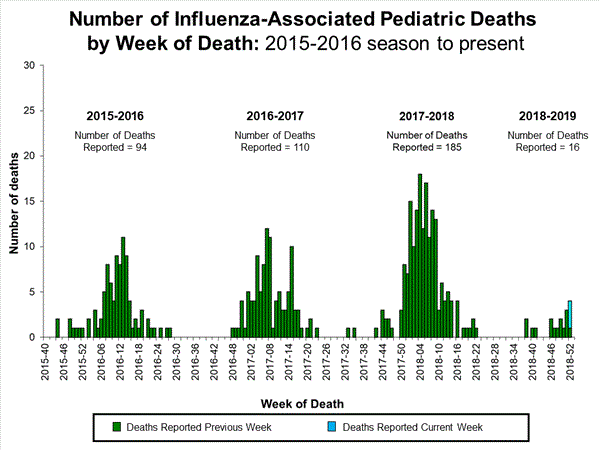
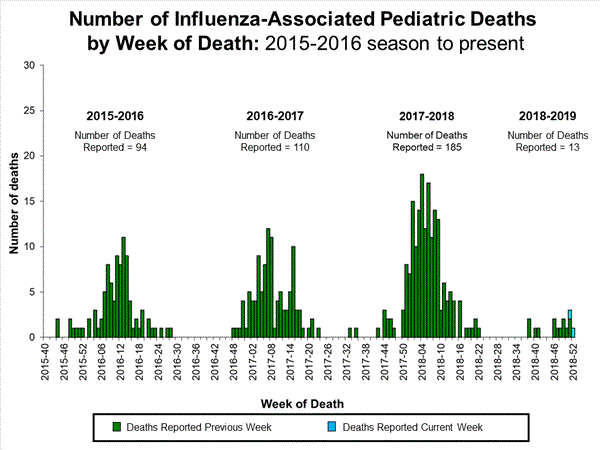
- Influenza-associated Pediatric Deaths: Three influenza-associated pediatric deaths were reported to CDC during week 1.

2018-2019 Influenza Season Week 52 ending December 29, 2018
Saturday, January 5th, 2019Influenza activity in the United States is increasing. Influenza A(H1N1)pdm09, influenza A(H3N2), and influenza B viruses continue to co-circulate. Below is a summary of the key influenza indicators for the week ending December 29, 2018:
- Viral Surveillance: The percentage of respiratory specimens testing positive for influenza viruses in clinical laboratories is increasing. Influenza A viruses have predominated in the United States since the beginning of October. Influenza A(H1N1)pdm09 viruses have predominated in most areas of the country, however influenza A(H3) viruses have predominated in the southeastern United States (HHS Region 4).
- Virus Characterization: The majority of influenza viruses characterized antigenically and genetically are similar to the cell-grown reference viruses representing the 2018–2019 Northern Hemisphere influenza vaccine viruses.
- Antiviral Resistance: All viruses tested show susceptibility to the neuraminidase inhibitors (oseltamivir, zanamivir, and peramivir).
- Influenza-like Illness Surveillance:The proportion of outpatient visits for influenza-like illness (ILI) increased to 4.1%, which is above the national baseline of 2.2%. All 10 regions reported ILI at or above their region-specific baseline level. The increase in the percentage of patient visits for ILI may be influenced in part by a reduction in routine healthcare visits during the winter holidays, as has occurred during previous seasons.
- ILI State Activity Indictor Map: New York City and 19 states experienced high ILI activity; nine states experienced moderate ILI activity; the District of Columbia and 10 states experienced low ILI activity; and Puerto Rico and 12 states experienced minimal ILI activity.
- Geographic Spread of Influenza: The geographic spread of influenza in 24 states was reported as widespread; Puerto Rico and 18 states reported regional activity; six states reported local activity; the District of Columbia, the U.S. Virgin Islands and two states reported sporadic activity; and Guam did not report.
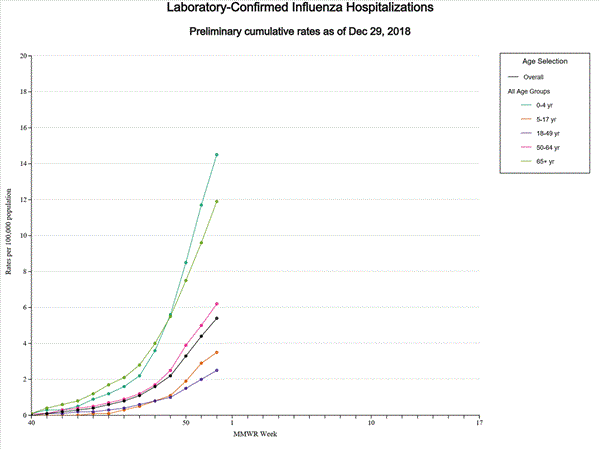
- Influenza-associated Hospitalizations A cumulative rate of 5.4 laboratory-confirmed influenza-associated hospitalizations per 100,000 population was reported. The highest hospitalization rate is among children younger than 5 years (14.5 hospitalizations per 100,000 population).
- Pneumonia and Influenza Mortality: The proportion of deaths attributed to pneumonia and influenza (P&I) was below the system-specific epidemic threshold in the National Center for Health Statistics (NCHS) Mortality Surveillance System.
- Influenza-associated Pediatric Deaths: Two influenza-associated pediatric deaths were reported to CDC during week 52.
Influenza activity in the United States is increasing. Influenza A(H1N1)pdm09, influenza A(H3N2), and influenza B viruses continue to co-circulate.
Sunday, December 30th, 2018Synopsis:
Influenza activity in the United States is increasing. Influenza A(H1N1)pdm09, influenza A(H3N2), and influenza B viruses continue to co-circulate. Below is a summary of the key influenza indicators for the week ending December 22, 2018:
- Viral Surveillance: Influenza A viruses have predominated in the United States since the beginning of October. Influenza A(H1N1)pdm09 viruses have predominated in most areas of the country, however influenza A(H3) viruses predominated in the southeastern United States (HHS Region 4). The percentage of respiratory specimens testing positive for influenza viruses in clinical laboratories is increasing.
- Virus Characterization: The majority of influenza viruses characterized antigenically and genetically are similar to the cell-grown reference viruses representing the 2018–2019 Northern Hemisphere influenza vaccine viruses. A comparison of gene sequences of recent influenza A(H1N1)pdm09 viruses from the U.S. and Mexico/Central America showed them to be similar.
- Antiviral Resistance: All viruses tested show susceptibility to the neuraminidase inhibitors (oseltamivir, zanamivir, and peramivir).
- Influenza-like Illness Surveillance:The proportion of outpatient visits for influenza-like illness (ILI) increased to 3.3%, which is above the national baseline of 2.2%. Nine of 10 regions reported ILI at or above their region-specific baseline level.
- ILI State Activity Indictor Map: New York City and nine states experienced high ILI activity; Puerto Rico and seven states experienced moderate ILI activity; 11 states experienced low ILI activity; the District of Columbia and 22 states experienced minimal ILI activity; and one state had insufficient data. Among the four states along the southern U.S. border, ILI activity increased to moderate in Arizona and high in New Mexico.
- Geographic Spread of Influenza: The geographic spread of influenza in Guam and 11 states was reported as widespread; Puerto Rico and 19 states reported regional activity; 15 states reported local activity; the District of Columbia, the U.S. Virgin Islands and three states reported sporadic activity; and two states did not report.
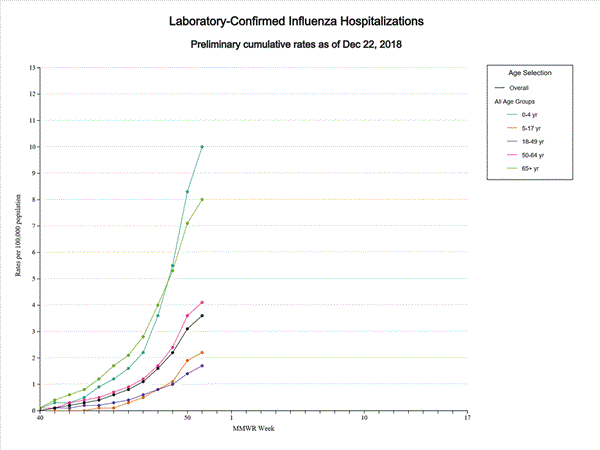
- Influenza-associated Hospitalizations A cumulative rate of 3.6 laboratory-confirmed influenza-associated hospitalizations per 100,000 population was reported. The highest hospitalization rate is among children younger than 5 years (10.0 hospitalizations per 100,000 population).
- Pneumonia and Influenza Mortality: The proportion of deaths attributed to pneumonia and influenza (P&I) was below the system-specific epidemic threshold in the National Center for Health Statistics (NCHS) Mortality Surveillance System.
- Influenza-associated Pediatric Deaths: Four influenza-associated pediatric deaths were reported to CDC during week 51.
2018-2019 Influenza Season Week 50 ending December 15, 2018
Saturday, December 22nd, 2018Influenza activity in the United States is increasing. Influenza A(H1N1)pdm09, influenza A(H3N2), and influenza B viruses continue to co-circulate. Below is a summary of the key influenza indicators for the week ending December 15, 2018:
- Viral Surveillance: Influenza A viruses have predominated in the United States since the beginning of October. Influenza A(H1N1)pdm09 viruses are predominating in most areas of the country. However, in the most recent three weeks, influenza A(H3) viruses were most commonly reported in the southeastern United States (HHS Region 4). The percentage of respiratory specimens testing positive for influenza in clinical laboratories is increasing.
- Virus Characterization: The majority of influenza viruses characterized antigenically and genetically are similar to the cell-grown reference viruses representing the 2018–2019 Northern Hemisphere influenza vaccine viruses.
- Antiviral Resistance: All viruses tested show susceptibility to the neuraminidase inhibitors (oseltamivir, zanamivir, and peramivir).
- Influenza-like Illness Surveillance: The proportion of outpatient visits for influenza-like illness (ILI) increased to 2.7%, which is above the national baseline of 2.2%. Eight of 10 regions reported ILI at or above their region-specific baseline level.
- ILI State Activity Indictor Map: Two states experienced high ILI activity; New York City and nine states experienced moderate ILI activity; Puerto Rico and 11 states experienced low ILI activity; the District of Columbia and 28 states experienced minimal ILI activity.
- Geographic Spread of Influenza: The geographic spread of influenza in Guam and six states was reported as widespread; 18 states reported regional activity; 19 states reported local activity; and the District of Columbia, Puerto Rico, the U.S. Virgin Islands and seven states reported sporadic activity.
- Influenza-associated Hospitalizations A cumulative rate of 2.9 laboratory-confirmed influenza-associated hospitalizations per 100,000 population was reported. The highest hospitalization rate is among children younger than 5 years (7.7 hospitalizations per 100,000 population).
- Pneumonia and Influenza Mortality: The proportion of deaths attributed to pneumonia and influenza (P&I) was below the system-specific epidemic threshold in the National Center for Health Statistics (NCHS) Mortality Surveillance System.
- Influenza-associated Pediatric Deaths: One influenza-associated pediatric death was reported to CDC during week 50.